
Ted Lyons: 300 Wins—Closer with a Closer?
This article was written by Herm Krabbenhoft
This article was published in The National Pastime: Baseball in Chicago (2015)
When he finally hung up his spikes, after hurling his last pitch on May 19, 1946, Ted Lyons had accumulated 260 mound victories, a total which at the time ranked fifth all-time in the American League for most career wins, behind only Walter Johnson (417), Eddie Plank (305), Lefty Grove (300), and Red Ruffing (267).1 Fittingly, each of these five players has been honored with a bronze plaque at the National Baseball Hall of Fame. Lyons, unlike the others, spent his entire career (1923–42, 1946) with a second-division club, the Chicago White Sox.
 Warren Corbett’s excellent article on Lyons, written for SABR’s BioProject, provides a comprehensive macroscopic account of his diamond accomplishments. Lyons “completed more games than any other contemporary starter.”2 Indeed, a check of the relevant “player profile” pages on Retrosheet.org shows that Lyons completed 356 out of 484 career starts, a remarkable 74%, a value higher than those of Cooperstown contemporaries Ruffing (62%) and Grove (65%).
Lyons’ relatively high percentage of complete games leads to interesting interpretation. He compiled a 15–20 won-lost record in 110 games as a relief pitcher, therefore giving him 455 decisions (245 wins and 210 losses) in the 484 contests he started. If one assumes, for the sake of argument, that each of Lyons’ 245 game-starting wins was a complete game, then the remaining (approximately) 111 complete games were game-starting losses.
Leaping out at us is the question, “How many of these (approximately) 111 complete-game losses were the result of the opposition overtaking a White Sox lead in the ninth (or extra) inning?” And, to follow up, “How many of these (approximately) 111 complete-game losses could have been prevented, saved as (incomplete-game) victories, by a successful closer?” To address these provocative questions one needs to take a microscopic look at Lyons’ complete-game losses.
INTRODUCTION
The first order of business is to learn the precise distribution of wins, losses, and no-decisions in Lyons’ 356 complete games. By examining Lyons’ game-by-game pitching log for each of his 21 Big League seasons—as presented in his “player daily” file on the Retrosheet.org website—I determined that Lyons amassed 236 complete-game victories, was shackled with 119 complete- game defeats, and pitched one complete-game no- decision (tie). So, the salient questions become:
How many of Lyons’ 119 complete-game losses were the result of the opposition wiping out a White Sox lead in the ninth (or extra) inning?
How many of Lyons’ 119 complete-game losses might have been prevented and saved as (incomplete-game) victories by a successful closer?
A key related question concerns the 236 complete-game triumphs Lyons achieved:
How many of Lyons’ 236 complete-game wins had a margin-of-victory of three runs or fewer, thereby qualifying for the save rule if a relief pitcher had been brought in successfully?
Next, the rules for crediting a starting pitcher with a Self-Save (SSV) or charging him with a Blown Self-Save (BSSV) need to be formulated. According to the Official Scoring Rules of Major League Baseball, only relief pitchers can be awarded a Save (SV); The Blown Save (BSV) is currently not officially recorded, although some newspaper box scores do include their mention and they are also provided in some compilations of a pitcher’s statistics (e.g., Baseball-Reference. com). Here are the definitions for the SSV and the BSSV used in this article, focused specifically on games in which Ted Lyons was the starting pitcher:
If Chicago was leading by no more than three runs going into:
The top half of the ninth inning when Chicago was the home team, or
The bottom half of the ninth inning when Chicago was the visiting team, or
The bottom half on an extra inning when Chicago was the visiting team, and
If Lyons retired the opposition without allowing the game-tying run, he received credit for a SSV;
If, however, Lyons did permit the tying run to score, he was charged with a BSSV.
NOTE: It is possible for Lyons to have both a BSSV and an SSV in the same game or even more than one BSSV in a game, i.e., in the bottom of the ninth and in the bottom of an extra inning.
RESEARCH PROCEDURE
To answer the above questions I scrutinized the line scores, as presented in the box scores on Retrosheet.org, for each of Lyons’ 484 career starts. I thereby identified those games where Lyons had a Self-Save (SSV) and/or a Blown Self-Save (BSSV). The pertinent results are presented in the Appendices, which are available in the electronic edition of this journal on SABR.org.
RESULTS
Table 1 presents year-by-year summaries of the outcomes (wins, losses, no-decisions) achieved by Ted Lyons in the games he started. In addition, Table 1 also provides the SSV and BSSV numbers and the derived Self-Save Percentage (SSV%), defined as the number of games in which Lyons earned an SSV divided by the sum of his SSV games and BSSV games, multiplied by 100%, i.e. SSV% = [ SSV / ( SSV + BSSV ) ] x 100%.
Examination of Table 1 reveals 112 SSV games and 20 BSSV games for Ted Lyons. Appendix 2 presents half-inning scores for each of the 20 BSSV games.
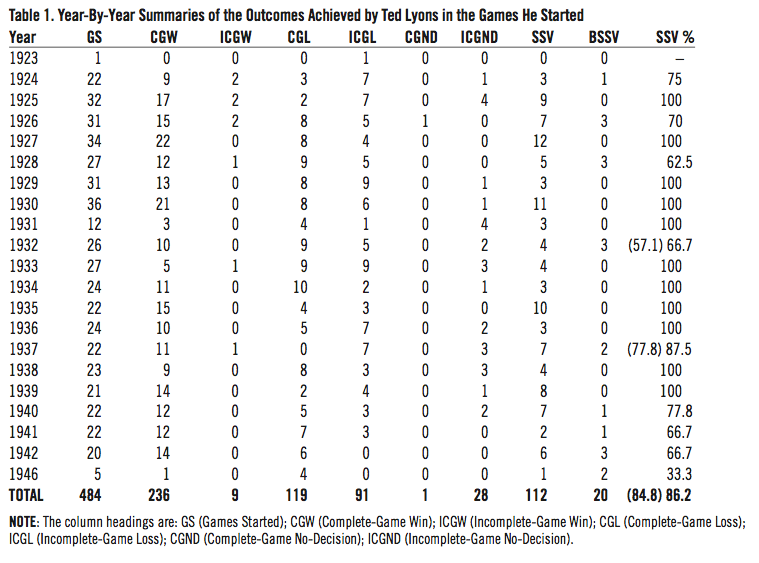
Table 1: Year-By-Year Summaries of the Outcomes Achieved by Ted Lyons in the Games He Started
NOTE: There were two games in which Lyons had both a ninth-inning BSSV and an extra-inning SSV: May 16, 1932, and August 1, 1937 (first game). Thus, Lyons actually had 130 SSV-opportunity games (not 132 SSV-opportunity games). Including both the BSSV and SSV results in the calculation of SSV% affords the TOTAL 84.8 SSV%. If one excludes the transitional BSSV result from each of these two games, the TOTAL Self-Save Percentage is 86.2%.
DISCUSSION
As shown in Appendix 2, thanks to timely comeback rallies engineered by his teammates, Lyons emerged as the winning pitcher in six of the 20 games in which he blew a self-save opportunity, including the previously mentioned games on May 16, 1932, and August 1, 1937 (first game). Two other BSSV games were no-decision games for Lyons (although the White Sox won both). Thus, Lyons was the losing pitcher in 12 of the 20 BSSV games. If the current practice of utilizing a closer to try to secure a victory had been operative during Lyons’ time in the Big Show, each of those losses could have been completely avoided. How many of those dozen losing games would have been converted into (incomplete-game) victories by a successful closer?
To address this question one needs to select the success rate (SV%) of the hypothetical closer for Lyons. First, let’s consider the success rates achieved by the pitchers classified as closers during the 2014 season.3 As shown in Appendix 3, Greg Holland achieved the highest SV% in the American League (95.8), followed by Fernando Rodney (94.0) and Zach Britton (90.2). In the Senior Circuit, the top three closers were Huston Street (96.0), Ardolis Chapman (94.7), and Craig Kimbrel (92.2). Had a 96 SV% closer (like Holland or Street) gone in for Lyons in each of his 130 SSV-opportunity games, Ted might have picked up as many as 125 victories, with five games becoming no-decisions for Lyons (because the closer blew the save).
Next, let’s consider the success rates achieved by the all-time career leaders in most saves (i.e., those with at least 300 lifetime saves). As shown in Appendix 4, the SV% range for these 26 closers is 73.5% (Goose Gossage) to 89.3% (Joe Nathan). Therefore, had an 89 SV% closer (like Nathan, Mariano Rivera, or Trevor Hoffman) replaced Lyons on the mound in each of his 130 SSV-opportunity games, Ted might have ended up with 116 wins, the same number he achieved himself. The median SV% for these relievers is 83.1% (i.e., the midpoint between Jason Isringhausen’s 82.4% and Jose Mesa’s 83.8%). Therefore, if an 83 SV% closer had relieved Ted Lyons in each of his 130 SSV-opportunity games, Ted might have emerged with 108 wins—eight fewer victories than he earned by himself! Table 2 summarizes these hypothetical-closer results.

Table 2: Effect of Using a Hypothetical Closer in the Games in Which Ted Lyons Had Self-Save Opportunities
Clearly, as quantified by his 86.2 SSV%, Ted Lyons did an excellent job self-saving his games with leads of three runs or fewer in the ninth (or extra) inning. Even the very best all-time closers would not have been able to bring Lyons’ lifetime wins closer to 300.
What about Lyons’ games with leads of three runs or fewer in the eighth or seventh innings—i.e., the “Hold” innings? Present-day mound strategy is to have the starting pitcher toss the first six innings (at least), hopefully surrendering three or fewer (earned) runs (thereby achieving a “quality start”) before turning the game over to the bullpen so the set-up men can hold the game during the seventh and eighth innings for the closer in the ninth.
As described in the 2015 edition of The Bill James Handbook, the Save/Hold Percentage (S/HLD%) is a much more realistic evaluation of a pitcher’s success in save situations.4 A “Hold” is defined as follows: “A relief pitcher is given a Hold anytime he enters the game in a Save situation, records one or more outs, and exits the game without giving up the lead.” Appendix 5 lists those games where Lyons had an advantage of three runs (or fewer) when he commenced pitching in the seventh and/or eighth inning. Table 3 summarizes the detailed information presented in Appendix 5.
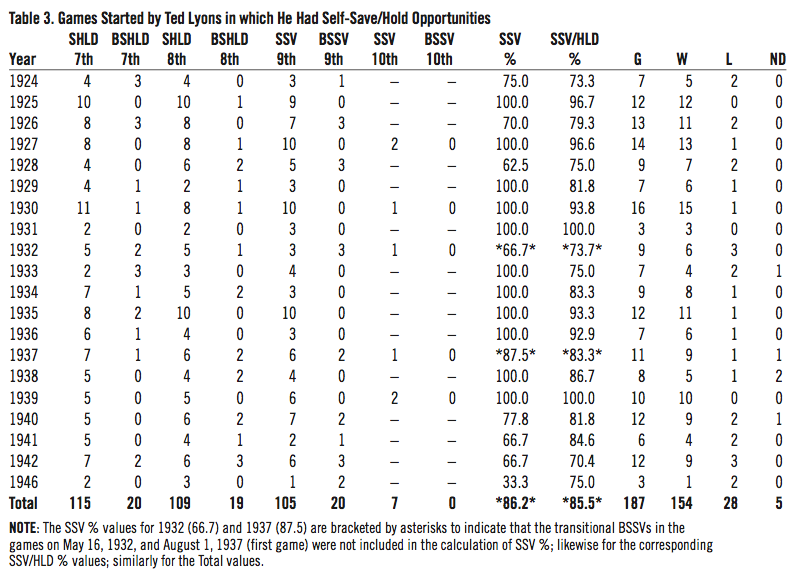
Table 3: Games Started by Ted Lyons in which He Had Self-Save/Hold Opportunities
Inspection of Table 3 reveals that Ted Lyons was confronted with 135 seventh-inning self-hold opportunities and was successful in 115 of them, a success rate of 85.19%. Similarly, Lyons was challenged with 128 eighth-inning self-hold opportunities and he prevailed in keeping the White Sox in the lead 109 times, a success rate of 85.16%. (And, as previously described, Lyons had a self-save success rate of 86.2%.) Combining the stats for Lyons’ self-hold and self-save situations results in an 85.5 SSV/HLD%. How does Lyons’ self-save/hold performance stack up with the performances achieved by bullpens of the ML teams in the 2014 season?
Appendix 6 provides the pertinent information for pitchers who were classified as set-up men during the 2014 season; also presented are the top-ten S/HLD% leaders for each league. As can be seen, the principal set-up men for each AL team achieved a composite Save/Hold success rate of 85%; overall, the AL pitchers assembled an 86 SV/HLD%. For the National League, the corresponding numbers were 87% and 87%. Thus, Ted Lyons’ 85.5 SSV/HLD% is right in the ballpark with these values.
Compared to the top-ten leaders within each circuit, however, Lyons’ SSV/HLD percentage is about ten percentage points lower. What might Lyons have achieved, if, throughout his entire career, he could have been supported by a relief corps similar to that utilized by the 2014 Kansas City Royals bullpen, which fashioned a composite 89.5 SV/HLD% with its top set-up men Wade Davis (92.3%) and Kelvin Herrera (95.2%) and closer Greg Holland (95.8%)? A 90 SV/HLD% bullpen would theoretically convert 187 save-opportunity games into 168 victories—i.e., 14 more wins than the 154 Lyons actually earned in the 187 games he had with Self-Save/Hold opportunities. These additional 14 victories saved by a hypothetical bullpen would give Lyons 274 career wins, which is closer to the cherished 300 winner’s circle but probably not close enough to shout about. In addition, no team has ever had such an effective bullpen year in and year out for a 20-year span, and such a bullpen would only hold the lead 84% of the time anyway.
CONCLUDING REMARKS
First, let’s answer the questions posed in the Introduction.
Eleven of Lyons’ 119 complete-game losses were the result of the opposition wiping out a Chicago lead in the ninth inning. (One of Lyons’ losses in his twelve BSSV defeats was an incomplete-game loss.)
As per charts 1–20 in Appendix 5, 24 of Lyons’ 119 complete-game losses (and four of his incomplete-game losses) might have been prevented and saved as (incomplete-game) victories by successful holders and closers.
Lyons self-saved 112 of his 236 complete-game victories.
With regard to the sub-title query, if Ted Lyons could have been supported by a superlative bullpen in each year throughout his 21-year career, he might have picked up an additional 14 wins or so (an average of fewer than one more win per season) and thereby gotten a little closer to the 300 lifetime wins milestone. Most significantly, however, my comprehensive and in-depth investigation of Ted Lyons’ mound performance shows that he achieved enviable Self-Save results: an 85.5 Self-Save/Hold percentage in securing 154 victories in the 187 games he was confronted with a save situation in the seventh inning or later. Focusing on the critical challenges embodied in last-inning save-situations, Lyons achieved an 86.2 Self-Save Percentage and an 85.5 Self-Save/Self-Hold Percentage, each value being greater than the Save Percentages earned by every relief hurler currently in the Hall of Fame: Dennis Eckersley (84.6), Hoyt Wilhelm (76.9), Rollie Fingers (75.8), Bruce Sutter (74.8), and Goose Gossage (73.5).
The bottom-line take-away from my microscopic examination of the pitching record of Ted Lyons is that he clearly was a Hall of Fame Self-Closer.
HERM KRABBENHOFT joined SABR in 1981. Herm has received SABR Baseball Research Awards for his articles in Baseball Quarterly Reviews on the “Ultimate Grand Slam Homers” Project, with Jim Smith for their articles in BQR on their “Triple Plays” Project, and for his “Baseball Research Journal” articles determining accurate RBI records for Lou Gehrig, Hank Greenberg, and Babe Ruth.
Acknowledgments
With grateful appreciation I heartily thank Tom Ruane (Retrosheet’s Box Score Project Manager) and his fellow Retrosheet volunteers for generating the invaluable Retrosheet Box Score File and derived Player Daily Files.
Notes
1. Ruffing subsequently added three more victories after May 19, 1946, and three more wins in 1947 to finish his career with 273 lifetime triumphs.
2. Warren Corbett, “Ted Lyons,” SABR BioProject.
3. Bill James, The Bill James Handbook 2015, Chicago: ACTA Sports, 2014, 28, 29, 355–65.
4. Bill James, The Bill James Handbook 2015, Chicago: ACTA Sports, 2014, 562, 568.