

Game Scores: Matches, Correlations, and a Possible Umpire Bias
This article was written by Peter Uelkes
This article was published in Fall 2012 Baseball Research Journal
INTRODUCTION
On Sunday July 17, 2011, the Boston Red Sox and Tampa Bay Rays hooked up for the rubber match of a three-game series, both teams’ first after the All-Star break. Josh Beckett started for Boston while Jeff Niemann toed the rubber for Tampa Bay.
 Both starting pitchers went eight shutout innings in the game, therefore handing off a scoreless tie to the bullpens. At that point nobody knew that it would be another eight innings before the first run was scored. Red Sox Dustin Pedroia drove in Josh Reddick for the game’s only run in the top of the 16th inning, giving Alfredo Aceves the win (after the save by Jonathan Papelbon). Of course, neither starter figured in the decision.
Aside from the drama of a game going scoreless into the 16th inning, an interesting statistical tidbit came to light: each starter achieved a game score of 86. Beckett did it by giving up only an infield hit and no walks while striking out six. Niemann gave up two hits and two walks while getting into double figures in strikeouts with ten.
A high-eighties game score is in itself noteworthy. However, both starters achieving the same high game score struck me as remarkable. I therefore did some analysis on matching game scores and related issues, the results of which are presented in the following sections. The data were taken from over 117,500 MLB games in Retrosheet play-by-play data and cover the period 1948 through 2010. (This excludes the above mentioned Red Sox–Rays game which happened in 2011.)
Game scores were introduced by Bill James as a single number which gives an indication of the quality of a starter’s performance and is calculated from standard box score items. The formula (in brief) looks like this:
GS = 50 + 1*(# of outs) + SO – 4*(H+R+ER) – BB + 2*(# of completed innings after the 4th)
A “quality start” is often defined as GS > 50. The highest game scores ever achieved exceed 100. The highest nine-inning GS is 105 from Kerry Wood’s famous 20-K game in 1998. Game scores of 90 or higher are quite rare: many pitchers never achieve those lofty heights. Particularly bad starts, on the other hand, may even result in a negative game score.
Starting at matching game scores, which is more of a curiosity, we will analyze some properties of game scores, including the correlation to its constituent variables, relation to the won/loss decision for the starting pitcher, and the issue of a possible bias toward the home starter regarding the calling of balls and strikes.
MATCHING GAME SCORES
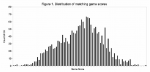 Figure 1 shows the count of matching game scores. A number of observations stem from this. There are quite a few matching game scores for “mid-level” scores in the 40–60 range. Some game scores have more than 60 matches, e.g. a game score of 54 was reached 67 times by both starters in the same game.
For game scores in excess of about 80 there are rarely any matches. This is expected because such lofty game scores are relatively rare, much more so when required by both starters.
The highest matching game score is 92, achieved on September 13, 1967, by Sonny Siebert of the Indians and Gary Peters of the White Sox. Both pitchers went 11 innings and gave up no runs. The White Sox won it, 1–0, in the 17th inning, very similar to the Boston- Tampa Bay game mentioned in the introduction. One major difference, aside from the fact that both starters went three more innings than their modern successors, is that Gary Peters walked 10 (!) batters.
We find the next highest matching game score at 87, achieved twice, first in July 1953 by the Phillies’ Bob Miller and the Braves’ Max Surkont. Both pitchers went 10 innings, giving up no runs. This game ended in a tie after 10 innings and each pitcher were credited with a complete game but no decision. Then in September 1985 the Mets’ Dwight Gooden and the Dodgers’ Fernando Valenzuela, both among the brightest stars of their era, hooked up for an epic duel. Gooden went nine shutout innings with 10 strikeouts while Valenzuela pitched 11 scoreless innings. Neither starter figured in the decision as the Mets scored the winning runs in the top of the 13th inning. Please note that this is the highest matching game score for which the starters got a different number of outs.
The next highest matching game score is 86, reached on May 31, 1975, by the Orioles’ Mike Cuellar and the Angels’ Bill Singer. Both pitchers were credited with a complete game and a decision, as Cuellar was on the winning end of a 1–0 score. Singer struck out 10 but gave up the game’s lone run in the eighth inning. This game has the highest matching game score among contests that didn’t require extra innings. Also, it’s the highest matching game score for which at least one starter (in this case both) figured in the decision.
The recent Beckett-Niemann matchup follows next on the list, but is not included in the dataset as mentioned. It’s the highest matching game score for which at least one starter (both, in this case) went less than nine innings.
The lowest matching game score is a meager 8, “achieved” on June 26, 1987. The culprits were Red Sox ace Rogers Clemens (the reigning AL MVP and Cy Young Award winner who would win another AL Cy the very same year) and Boston’s arch-rival Yankees’ Tommy John. Each starter coughed up eight runs in what turned out to be 12–11 win by the Yankees in 10 innings. (See Figure 1.)
HIGH-SPREAD GAME SCORES
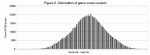 After looking into matching game scores for both starters we will examine the maximum difference between the two opposing starters’ game scores. Figures 2 and 3 show the spread distribution: the count of differences between home and road starter’s game scores. The first one has a normal (linear) y axis, the second one represents the same data with a logarithmic y scale to better show the extreme tail ends of the distribution.
Some key results from the graphic and the corresponding data are represented in Figure 2.
 The highest difference (in absolute terms) is a 104 point spread which happened on August 3, 1998. In the midst of the Yankees 114-win season, their starter Orlando Hernandez achieved a +83 game score with a complete game, nine- inning, one- run effort at the Coliseum in Oakland. The opposing A’s starter Mike Oquist gave up 16 hits and 14 runs, all earned, in five innings. This resulted in a -21 game score. The next highest spread comes in at 89. This happened twice, both times the home starter ended up having the much better game score. (See Figure 3.)
On August 2,1996, the Montreal Expos’ Pedro Martinez had a +84 game score on the strength of eight shutout innings with only two hits. The visiting Cincinnati Reds’ starter Kevin Jarvis gave up 10 runs on 13 hits in 3.1 innings for a -5 game score.
On August 4, 2004, Brian Anderson of the Kansas City Royals pitched a complete game shutout with only two hits against the Chicago White Sox. It improved his record to 2–9 and his ERA to 6.33 (!). The Pale Hose’s starter, Scott Schoeneweis, didn’t fare nearly as well, giving up nine runs on nine hits while getting only four outs.
The distribution is quite symmetrical with a median of 1 and a mean of about 0.86. If one looks at the home and road GS separately, the average home GS is 51.8 while the average road GS is 49.3. The home starter tends to have a slightly better score. The difference is the equivalent of one additional hit given up by the road starter. We’ll come back to this point later. Also, there is no correlation between the quality of the home and road starters’ respective results: the overall correlation coefficient between home GS and road GS is 0.0386 for over 117,500 games.
GAME SCORES vs. DECISIONS
As is well known, not the least thanks to SABR members’ efforts, pitcher won-lost records are a poor indicator of a hurler’s performance or worth to his team. However, most starting pitchers are eager to earn a “W” for their effort every time they toe the rubber. We will therefore take a look at how decisions (W, L, ND) and game scores relate to each other. The offensive side of the game has a big impact on a pitcher’s decision and is not measured in game score at all.
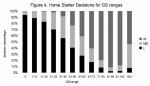 For home starters, the distribution of won-lost decisions in “bins” of GS ranges is shown in Figure 4.
As expected, the higher the game score, the higher the percentage of wins generally becomes. On the tail ends of the spectrum, the sample size is small, giving rise to large fluctuations. For example, there are 26 home starts with game scores in excess of 100, but just over half of them (14) have resulted in wins. There are quite a few tough-luck pitchers like Cincinnati’s Jim Maloney, who pitched an 11-inning complete game with 18 strikeouts on June 14, 1965, giving up only one run for a game score of 106. He had some bad timing for his masterpiece, because the opposing pitchers for the New York Mets, Frank Lary and Larry Bearnarth, combined for 11 shutout innings, handing Maloney the loss.
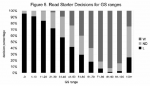 For road starters, the distribution closely resembles the one for home starters, with an even smaller percentage of very high game scores resulting in actual wins for the starting pitcher. (See Figure 5.)
Only three out of twelve road starters with game scores above 100 got a “W” for their efforts!
This may be contrasted with very poor starts—low game scores—nevertheless resulting in a win because of great run support. For example, on May 31, 1979, future Hall-of-Famer Don Sutton of the Los Angeles Dodgers “earned” a win by giving up nine runs on 13 hits in 6 2?3 innings for a game score of 14. His opponent, Vida Blue, only needed 3 1?3 innings in that game to also give up nine runs, resulting in a game score of 5.
So, to summarize the relationship between game scores and decisions, the general trend shows the expected results while also allowing us to easily identify very lucky or very tough decisions compared to the actual pitching performance.
GAME SCORE CORRELATIONS
Looking at the game score formula given previously, we see that GS is derived from six variables: innings pitched (i.e. outs), hits, runs, earned runs, bases on balls, and strikeouts. How strongly does GS correlate with each of these variables? A regression analysis was done for game scores versus each variable, separately for home and road starting pitcher. 117,534 game data sets were used for each—117,534 home starters and of course the same number of road starters.
Table 1 shows the correlation coefficients (r) and their squares (r2).
Table 1: Correlation coefficients of GS to variables
| Home Starter | Road Starter | |||
|---|---|---|---|---|
| Variable | r | r2 | r | r2 |
| IP | 0.785 | 0.616 | 0.778 | 0.605 |
| R | -0.845 | 0.714 | -0.856 | 0.733 |
| ER | -0.831 | 0.691 | -0.842 | 0.708 |
| H | -0.42 | 0.177 | -0.418 | 0.175 |
| BB | -0.06 | 0.004 | -0.064 | 0.004 |
| SO | 0.544 | 0.296 | 0.532 | 0.283 |
GS correlates positively with outs (IP) and strikeouts, as expected from the formula, and negatively with runs, earned runs, hits, and walks, also as expected. The correlation is rather strong with IP and (E)R, moderate for strikeouts, and weak for hits. For bases on balls, the correlation is basically non-existent. Of course, the r2 values don’t add up to 1 (100%) because the variables are not independent of each other. (For example, all earned runs are also runs, and runs are correlated with hits and walks.)
I interpret the observation of a very weak correlation between GS and BB as meaning that walks in and of themselves are not that bad in regard to game score and therefore “quality of start.” Rather, walks that turn into runs are what really hurts a pitcher’s game GS.
HOME/ROAD SPLITS IN VARIABLES: UMPIRE BIAS?
While discussing game score spreads (difference between home and road starters’ game scores) we noticed that on average the home starter has a slight edge—a higher game score by about two points. We will now look into which variables contribute to this difference. For this purpose, the 117,534 games in the data set were analyzed with respect to average values for hits, runs, strikeouts, and walks for the home and road starter, respectively, as shown in Table 2.
Table 2: Variable averages for home and road starters
| Variable | Home Starter | Road Starter | Difference |
|---|---|---|---|
| Hits | 6.265 | 6.186 | 1.27% |
| Runs | 3.047 | 3.188 | -4.52% |
| Strikeouts | 3.981 | 3.596 | 10.20% |
| BB | 2.141 | 2.22 | -3.65% |
| IP | 6.392 | 6.04 | 5.67% |
The “difference” column gives the percentage spread between home and road starters’ variable with respect to the mean value of the two numbers.
The difference in hits is small: both starters give up about the same number of hits. The spreads in runs and bases on balls are somewhat larger, though—keep in mind that the results are highly significant because of the large data set. For whatever reason, road starters walk more batters than home starters. This contrast is even more pronounced when looking at strikeouts: the difference is more than 10%, a significant advantage for the home starter. Especially enlightening is the strikeout-to-walk ratio (K/BB) which is 1.859 for home starters and 1.620 for road starters—a 14.8 percent spread.
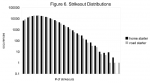 To illustrate that strikeout issue, Figure 6 shows the distribution of strikeouts per start for home and road starters,respectively. Please note the logarithmic y-axis to better represent the right (high-strikeout) tail of the distribution.
A piece of anecdotal evidence for a certain strikeout advantage for home pitchers is also the number of starts with very high K totals: there were three instances with the road starter achieving 19+ strikeouts (David Cone with 19 in 1991, Roger Clemens with 20 in 1996, and Tom Cheney with 21 in 1962) but 12 times this was done by the home starter in the 1948–2010 time frame covered (including Nolan Ryan four times and Randy Johnson three times). (See Figure 6.)
A possible explanation for the home starters’ strikeout advantage may be umpire bias in favor of the home pitcher when calling balls and strikes. This, in turn, may well be (part of) the explanation for the home field advantage existing in MLB.
The last row in Table 2 gives the mean number of outs per start. On average, the home starter gets through 6 1?3 innings while the road starter gets through six innings flat. This may partly explain the strikeout difference, but on the other hand getting strikes called instead of walking batters or having to throw more pitches automatically results in more outs within the pitch-count limits. Also, the road starter walks more batters per start even though he is getting less deep into the games on average!
To further investigate the issue of different strikeout totals for home and road starters, we split the 10.2% figure from Table 2 into different eras. This yields results shown in Table 3.
Table 3: Historical trend for strikeout rates
| Era | Mean K per start for home start |
Mean K per start for road start |
Difference |
|---|---|---|---|
| 1948–60 | 3.371 | 2.961 | +12.90% |
| 1961–70 | 4.283 | 3.801 | +11.90% |
| 1971–80 | 3.745 | 3.353 | +11.10% |
| 1981–90 | 3.798 | 3.458 | +9.40% |
| 1991–2000 | 4.163 | 3.814 | +8.80% |
| 2001–10 | 4.319 | 3.949 | +8.90% |
The overall strikeout totals follow the expected path: the pitching-dominated sixties, a decline in the seventies, and a steady rise since then because of the growth of the “all or nothing” approach at the plate in recent decades, batters who seem to specialize in the “Three True Outcomes” (walk, strikeout, or home run).
 The difference, meanwhile, is in steady decline for the time frame covered by the data set. If the speculation of umpire tendencies to slightly prefer the home pitcher were true, this may slowly get dis-incentivized with more TV coverage and, in recent years, the introduction of systems for identifying balls and strikes (PITCHf/x) which are used by MLB to evaluate umpire performance.
CONCLUSION
We looked at the historical record to identify cases of matching game scores (home and road starter’s game scores being equal) and found some games with quite high game scores meeting the criterion. Games with very high spreads between the two starters’ performance were also analyzed.
The relationship between game scores and pitcher’s won-lost decisions has the expected properties with noteworthy curiosities at the tail-ends of the distributions. An investigation into the correlation of game scores and its constituent variables yielded mostly expected results, as well as a somewhat surprising finding of an almost non-existent correlation between game scores and walks.
In the last section, a number of home/road splits for several variables was performed. We found a strikeout bias in favor of the home team, therefore providing a possible explanation for the home team advantage observed overall in MLB. Whether or not this bias may have to do with certain (possibly unconscious) preferences by the umpires cannot be satisfactorily answered by the current analysis, which was done on box score data exclusively, and may be an interesting topic for further research.
SOURCES
The information used here was obtained free of charge from and is copyrighted by Retrosheet.
PETER UELKES has been a SABR member since 2001. He holds a Ph.D. in Elementary Particle Physics and is currently working as a Senior Project Manager in the telco sector. Peter has considered himself a member of Red Sox Nation since 1990 and made it through the nightmare of 2003 and the redemption of 2004. He lives with his wife and their two boys in Germany, where he has to apportion his rooting interests between the Sox and his hometown soccer team, Borussia Moenchengladbach. This is Peter’s third contribution to the “Baseball Research Journal”, the first one being a joint work with Ron Visco. He may be reached at peter@uelkes.com.