

Krissoff: Society and Baseball Face Rising Income Inequality
Editor’s note: This article by Barry Krissoff from the Spring 2013 “Baseball Research Journal” is a finalist in the Historical Analysis/Commentary category for the 2014 SABR Analytics Conference Research Awards. Voting for the winners will be conducted online from Friday, January 31 to Monday, February 17, 2014. The winners will be announced at the third annual SABR Analytics Conference, March 13-15, 2014, in Phoenix, Arizona. Learn more at SABR.org/analytics.
By Barry Krissoff
Data clearly show that the United States has been experiencing rising income inequality for over two decades. The most comprehensive source of income inequality data is published by the US Bureau of Labor Statistics (BLS) and the Census Bureau. Their annual Current Population Survey publication reports income separated into quintiles (fifths) as well as income earned by the top 5 percent. The roughly 6 million households in the top 5 percent command just over 22 percent of total US income, numbers that have been generally rising since the mid-1970s. This growing inequality has become a contentious issue in our society, from its premise for the Occupy Wall Street movement to its discussion in the presidential campaign. There is a double whammy to this inequality: not only are the top 5 percent relatively more well off than their neighbors with an average income of $311,400 but the middle quintile—$49,800 average income—are absolutely less well off as their real income has declined.
 Who are in the top 5 percent? They include chief executives, financiers, physicians, entertainers, and, yes, athletes. Professional athletes at the top level of their profession are among the highest paid Americans with Major League Baseball, National Football League, and National Basketball Association players’ salaries averaging approximately $3.4 million (2012 season), $1.9 million (2009–10 season), and $4.6 million (2009–10 season), respectively.[fn]USA Today Salaries Database http://content.usatoday.com/sportsdata/football/nfl/salaries/team accessed April 2012.[/fn] The top-paid players in each of the leagues, such as Alex Rodriquez, Tom Brady, and LeBron James, each earned roughly $30 to nearly $55 million per year in salaries and endorsements.[fn]Freedman, Jonah. “The 50 Highest-Earning American Athletes.” Sports Illustrated http://sportsillustrated.cnn.com/specials/fortunate50-2011/index.html, accessed July 2012.[/fn]
What proportion of MLB salaries are in the top 5 percent? All of them. With a base salary in the major leagues of $480,000 in 2012, all players would exceed the top 5 percent. Despite their very high incomes relative to other households in the United States, there is also substantial income inequality within Major League Baseball (MLB). In fact, income inequality within baseball closely mirrors income inequality across US households, albeit at much higher income levels. Remarkably, the share of income that is attributed to the top 5 percent of ballplayers compared to all major league players is even more pronounced than the top 5 percent of income among all US households.
First we will examine whether baseball players’ salaries have always been in the top 5 percent and the extent of income inequality within the sport. Does baseball’s income structure mirror society’s growing inequality? Secondly, we explore whether income inequality has affected performance. Do teams with greater income inequality have less success on the baseball field?
THE BACKGROUND: BASEBALL SALARIES OVER THE LAST 40 YEARS
Have baseball players’ incomes always been in the top percent of US household income? The short answer is no. It took protracted labor negotiations and the emergence of new sources of revenue to thrust baseball players into the upper echelons of America’s income structure. In 1887 professional baseball owners added the reserve clause to contracts restricting their players from signing contracts with new teams to limit players’ options to negotiate salaries in an open market. In essence, players had to accept their team’s salary offer or not play. To counterbalance the strength of team ownership, players formed associations throughout the late 1880s and early to mid-1900s. They had minimal success until the formation of the Major League Baseball Players’ Association (MLBPA) in 1954 and the negotiation of the first Collective Bargaining Agreement (CBA) in 1968.[fn]Caldwell, Terrence. “An Overview and Comparative Analysis of the Collective Bargaining Agreement in the NBA, NFL, and MLB.” (2010) Claremont College Senior Thesis Paper. http://scholarship.claremont.edu/cmc_theses/62/. Accessed April 20, 2012.[/fn] Among other provisions, the CBA increased the minimum salary for a major-league player.
During the 1970s, the reserve clause was extensively altered. A landmark decision by the Supreme Court in 1972 ruled against Curt Flood in his bid to become a free agent, a critical moment in the contentious history between MLB owners and MLBPA. Relations were often characterized by distrust, lack of accommodation, and name calling.[fn]Staudohar, Paul D. “The Baseball Strike of 1994–95.” Monthly Labor Review, March 1997, pp. 21–27.[/fn] In December 1975 a ruling by arbitrator Peter Seitz and subsequently upheld by the courts, created the opportunity for players to move from one team to another for the first time. As Michael Haupert explains in his article on the economic history of baseball, Curt Flood may have lost his case for free agency in the 1972 Supreme Court case, but the players ultimately won the war with the transformation in the reserve clause.[fn]Haupert, Michael J. “The Economic History of Baseball.” http://eh.net/encyclopedia/article/haupert.mlb, accessed April 22, 2012.[/fn]
Eight strikes and lock-outs occurred 1972–95, culminating with the costly 232-day strike for both owners and players in the 1994–95 season. After the 1994–95 strike, major league owners and the MLBPA recognized the high cost of canceling games and the importance of a more harmonious relationship. Four CBAs have been successfully negotiated since the strike with the most recent in 2012. Under the collective bargaining agreement negotiated in 1996, the 1997 minimum baseball salary increased to $150,000, a 38 percent boost. The jump coincided with a turning point for baseball revenue. Driven by new national television contracts from Fox, NBC, and ESPN, television revenue increased to more than $2 billion in 1997 and continued to grow under subsequent contracts with Fox, ESPN, and TBS.[fn]“Major League Baseball Television Contracts.” Wikipedia, http://en.wikipedia.org/wiki/Major_League_Baseball_television_contracts#Baseball_comes_to_Fox_and_stays_with_NBC:_1996.E2.80.932000. 932000, accessed April 27, 2012.[/fn]
Other television revenue expanded as well. Individual teams formed regional sports cable networks or received a rights fee from a local sports cable network (for example: MASN and YES) accruing substantial revenue. The Los Angeles Angels of Anaheim’s Fox TV Sports contract is ostensibly worth $3 billion over 20 years, an agreement that facilitated the signing of Albert Pujols and C.J. Wilson to multiyear accords for a combined $331.5 million.[fn]Stephen, Eric. “Los Angeles Angels New TV Deal Worth $3 Billion Over 20 Years, Per Report.” SBNation, Los Angeles December 8, 2011. http://losangeles.sbnation.com/los-angeles-angels/2011/12/8/2622757/los-angeles-angels-tv-deal-3-billion-20-years-albert-pujols-c-j-wilson-arte-moreno.[/fn] Similarly, a mega-TV contract with Fox has enabled the Los Angeles Dodgers to enter the 2013 season with a payroll that may be over $220 million. Some small team markets have also succeeded in forming regional sports networks. The Cleveland Indians, for example, started SportsTime-Ohio in 2006, receiving $30 million annually in rights fees.[fn]Ozanian, Mike. “The Business of Sports.” Forbes, http://www.forbes.com/sites/mikeozanian/2012/03/21/the-business-of-baseball-2012/.[/fn] In the era of television recording devices and the ability for viewers to fast-forward or skip commercials, the broadcasts of live sporting events command premium dollars.
Forbes estimated dramatic increases in the value of MLB franchises, led by the New York Yankees valuation of over $1.85 billion.[fn]Ozanian, Mike. Ibid.[/fn] This was surpassed in May 2012 when the sale of the Los Angeles Dodgers was completed at $2.15 billion. Industry revenue rose to $6.35 billion in 2011.[fn]Forbes. MLB Team Values; The Business of Baseball. www.forbes.com/mlb-valuations/ accessed March 11, 2013.[/fn] The increase in valuation and revenue of franchises provides greater incentive for owners and the MLBPA to reach successful bargaining agreements.
THE DATA: A LOOK AT THE CHANGES IN BASEBALL SALARIES
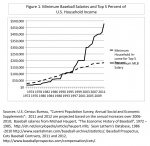
Figure 1 graphs the minimum baseball salary and minimum level of household income required in order to qualify for the top 5 percent between 1972 and 2012.[fn]At the time of the writing, the data for household income were available only through 2010.[/fn] For the first 25 years on the graph, the two series closely mirror each other with minimum baseball salaries fluctuating closely around the top 5 percent household income level, roughly a one-to-one ratio. Afterwards, when the 1997 collective bargaining agreement went into effect, the gap widens nearly continuously. The ratio of the two series shows the minimum baseball salary rising to 2.6 times the top 5 percent minimum of US household income by 2012. It now exceeds the cutoff of the top 1 percentile of US household income.
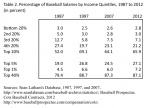
While the minimum baseball salary substantially rose relative to US household income in the post- 1994–95 strike period, middle and top earners experienced an even more dramatic salary boost. The average salary nearly tripled between 1987 and 1997, rising from a $400,000 range to over $1.2 million and nearly tripled again between 1997 and 2012 to over $3.3 million. The top 5 percent of earners brought in four times more salary in 1997 relative to 1987 and nearly three times more between 1997 and 2012, reaching an average salary of $18.5 million in 2012.
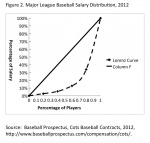
Figure 2 illustrates the cumulative distribution of salaries by percentages for 2012. The diagonal line indicates salary equality; that is, 20 percent of the players earn 20 percent of the salaries, 40 percent of the players earn 40 percent, and so forth. The Lorenz curve shows that the distribution of MLB players’ salaries follows a largely unequal path; the first 20 percent of the players earn about 3 percent of the salaries, the first 40 percent of the players earn about 6 percent of the salaries, and the first 60 percent of the players earn about 13 percent of the salaries. In contrast, the top 20 percent of the players (reading the graph starting from the right side) command over 65 percent of the salaries.
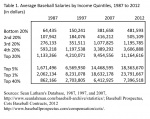
Tables 1 and 2 provide more detail by exemplifying the dynamic changes over the 1987 to 2012 period. Table 1 shows the average salary by quintile and by the top 40, 5, and 1 percent. In all the categories, the average salary has substantially increased. Similar to the Lorenz curve, Table 2 shows the share (but not cumulative) of baseball salaries by quintile and by the top 40, 5, and 1 percent. The top 5 and 1 percent command 27.1 and 7.2 percent share of all MLB player salaries in 2012 compared to 19.0 and 4.5 percent 25 years earlier. The top 5 percent of baseball salaries earn 100 times more than the minimum amount required to qualify for the top 5 percent of US household income and 38 times more than the minimum MLB salary. Succinctly put, the wealthier baseball players are becoming more affluent not only compared to household incomes but also to many of their peers.
PERFORMANCE AND SALARY INEQUALITY
Our next focus is to examine the relationship between team performance and salary inequality. With salary inequality on the rise in MLB, is team performance affected? Much research has been done examining the relationship between players’ and teams’ performances and their salaries. In a competitive environment, we would expect the high performing players to gravitate to teams willing to pay commensurate compensation, thereby leading to successful teams. Larger market teams would have an advantage since they have the ability to generate more revenue. However, several links may not hold to assure this outcome. First, as discussed earlier, the labor market for players is restrained by the collective bargaining agreement; most significantly, free agency is limited to players after their sixth year in the major leagues and players’ eligibility for arbitration occurs only in their third year.[fn]The top players with 2 plus years experience may qualify for arbitration as well.[/fn] Second, there is a level of uncertainty regarding player performance; a player who has had success may sign a large contract with a new team but the team is not assured of continued high caliber accomplishments.
Third, measuring players’ or teams’ performances is not necessarily straightforward. What metrics are most important? For a batter it might be runs batted in, runs scored, or more recently developed measures like on base percent plus slugging (OPS) or batting average on balls in play (BABIP). Similarly, for a pitcher the criteria might be wins, earned run average, or fielding independent pitching (FIP). An alternative approach would be to directly look at the bottom line. Does the star attract larger attendance or more TV viewers than the average player or bring in more revenue from jersey sales? When we look at a team’s performance the focus can be on the same metrics as a player, using aggregate team statistics, or can be measured more simply in wins or winning percentage.
Baseball analysts and economists have addressed these issues for many years. Scully, Bradbury, and Gennaro have written well cited books and articles examining batters’ and pitchers’ performances and salaries.[fn]Scully, Gerald. The Market Structure of Sports, University of Chicago Press, 1995; J.C. Bradbury. The Baseball Economist, Penguin Group, 2007; Vince Gennaro. Diamond Dollar$, Maple Street Press, 2007.[/fn] Other books have focused on team performance and salaries.[fn]See for example Zimbalist, Andrew. May the Best Team Win, Brookings Institution Press, 2003.[/fn] The consensus is that baseball teams with higher salaries are more successful at winning games and championships, but higher salaries do not ensure victories. Morrissey finds that about half the time the World Series winner had average players’ salaries that exceeded the MLB average by at least 25 percent and only once were both World Series teams below the average salary between 1985 and 2006.[fn]Morrissey, Mo. “Do Higher Baseball Salaries Translate into Championships.” http://voices.yahoo.com/do-higher-baseball-salaries-translate-championships-472253.html.[/fn] We calculated the average salaries for 2007–11 and found that all of the World Series winning teams exceeded the league average salaries and the salaries of their World Series opponents.
While salary levels and performance have been examined, the issue of salary inequality and performance has not. Why should salary inequality matter for MLB players who are clearly among the top wage earners in the country? The relative income hypothesis, first developed by James Duesenberry, suggests that individuals are concerned not only with absolute income but with how their income compares to others and in what income percentile they are in. An underlying premise of the Occupy Wall Street movement and the popular concern about the top 1 percent of society’s income earners is at least partially explained by the relative income hypothesis. But baseball players are professionals, with even the lowest paid among them earning salaries that place them among the wealthiest individuals in the country, so would we expect income inequality within a team to be an issue affecting performance?
We compared a team’s performance and income inequality measures for the thirty major league teams in 2010. For team performance, we used winning percentage. For income inequality we used two statistics, the top three players’ share of team salary and the Gini coefficient, the latter of which can measure income inequality with one indicating maximum inequality— one person having all the salary—and zero indicating salaries are equal among all players.
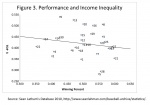
A scatter diagram comparing winning percentages and the share of the top 3 players’ salaries for each team illustrates that there is only a very slight negative relationship (Figure 3). The correlation coefficient equals –0.18.[fn]The correlation coefficient measures the interdependence of variables and can range in value from -1 to +1, with -1 indicating a perfect negative relationship, 0 indicating no relationship, and +1 indicating a perfect positive correlation at +1.[/fn] This negative relationship holds at the extremes—the Cleveland Indians had the highest income inequality with Travis Hafner, Jake Westbrook, and Kerry Wood accounting for over 50 percent of the team’s salary, but won only 69 games, while the Boston Red Sox had the lowest income inequality with 21 players earning over $1 million and won 89 games. For other teams, though, like the Cincinnati Reds, the top 3 players earned around 50 percent of the team’s salary yet they won their division with 91 wins. Moreover, there was no clear pattern for low salary teams; some had high income inequality like Cleveland but others had more equal distribution like the San Diego Padres.
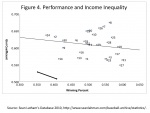
The Gini coefficient provides a more comprehensive measure than the top 3 salaries since it includes salaries for all players on a team. Similar to the top 3 measure, the Gini coefficient metric also showed a slightly negative relationship between salary inequality and performance (Figure 4). The correlation coefficient is again –0.18 but this time only if we exclude Baltimore and Pittsburgh. These two teams had losing records and relative salary equality. They finished last in their respective divisions with Pittsburgh winning only 57 games, the fewest wins in major league baseball. Pittsburgh also had the lowest team salary and no player earned more than $5 million. Baltimore was 18th in the major leagues in team salary with more than half the team earning at least $1.2 million.
Income inequality does not seem to be a strong factor affecting a major league baseball team’s performance. It does not seem to create tension among players as it does for society at large. There are a few explanations of why this appears to be the case. First, a team consists of a small number of players, generally in the range of 25 to 30 individuals, who spend a large amount of time with each other over the course of a season. Together these factors create a bond that could be called “mateship”—sharing of personal information, camaraderie, and friendship. It is a bond strengthened by an “us against them” mentality found in any competitive team environment. The story of Carlos Beltran’s imminent departure from his New York Mets’ teammates after eight years on the team in the middle of the 2011 season to join the San Francisco Giants is a worthwhile example. Beltran, one of the highest paid players on the Mets team, took his teammates to a Cincinnati steakhouse as a parting gesture. The event recognized all they had shared during their time together as Mets, but also signified that the bond was now over. He would henceforth be a member of a new team and his allegiances would be toward the Giants. Second, if Duesenberry’s hypothesis exists in baseball, it seems more likely that players would be comparing their salaries to peers playing the same position as them, rather than to their teammates. A second baseman would compare his salary to other second basemen with similar statistics, rather than comparing it to his own team’s center fielder’s salary. Third, many of the currently low income young players have reasonable expectations of much higher salaries once they become arbitration eligible and free agents, a luxury that most working people in society will never have. Finally, all MLB players are earning salaries that are high enough that they may feel their relative wealth within their individual teams is not very important.
CONCLUSION
Income inequality has grown in society and in baseball. Top players can earn 40 to 50 times more than their teammates. This mirrors the changes that we have witnessed in some corporate executive board rooms relative to rank and file workers. However, there are key differences. Like any group sport, a team of baseball players has a common goal—to win games and ultimately be victorious in the World Series. Add this relatively straightforward focus to the fact that all major league players are earning high salaries, often considerably more than the “bottom 99 percent” of the US population, and therefore it is not surprising that income inequality is not an important factor in determining performance.
In contrast, societies’ objectives are considerably more complex. In our mixed capitalist economic system, individuals follow their own self-interest and aspire to find gainful employment optimizing their income and satisfaction. The government sectors and charitable organizations aim to provide safety and security by establishing laws and to make available education, affordable food and nutrition, and other redistributive transfers so that all residents can attain a minimum standard of living. The recession years have placed greater stress on achieving minimum standards, let alone middle income levels, and greater income inequality than in more prosperous years. Occupy Wall Street exemplified and brought attention to these pressures. Could society achieve its goals like a group of major leaguers on a baseball field, if we played as a team by improving communication and reaching common ground?
ACKNOWLEDGEMENTS
The author appreciates the input from Robert Franco, Stacey Rosen, John Wainio, two anonymous peer reviewers, and Clifford Blau fact-checker, in preparing this article, and the support and patience of his family, Jayne, Jamie, and Dana. Cecilia Tan provided excellent editorial assistance.
BARRY KRISSOFF is a professional economist and avid baseball fan. He is looking forward to the first World Series championship for the Washington Nationals. He appreciates the input from John Wainio, Stacey Rosen, and Robert Franco in preparing this article and the support and patience of his family, Jayne, Jamie, and Dan.
Originally published: January 27, 2014. Last Updated: January 27, 2014.