
Baseball’s First Power Surge: Home Runs in the Late 19th-Century Major Leagues
This article was written by Christopher D. Green
This article was published in Fall 2011 Baseball Research Journal
Many casual baseball fans and serious sabermetricians alike hold the belief that the home run was not a terribly important part of the game until the arrival of Babe Ruth in the outfield of the New York Yankees in 1920. Just the year before, Ruth had hit 29 homers to slip past Ned Williamson’s single season home run record of 27, a mark that had stood unchallenged for 35 years. The record had been tainted from the outset, however, having been set in a year—1884—in which Williamson’s Chicago White Stockings played in a park with fences less than 200 feet from home plate and had changed their ground rules to count balls over the fence as home runs rather than doubles.[fn]That same year, for the same team, Fred Pfeffer hit 25, Abner Dalrymple hit 22, and Cap Anson hit 21. Thanks to John Cappello for pointing out Chicago’s fence problem. [/fn] Since then, only two players had come close to Williamson. One was Buck Freeman, who played right field for the old National League Washington Senators and hit 25 in 1899, nearly twice as many as he would hit in any of his other 10 major league seasons. The other was Gavvy Cravath, the Philadelphia Phillies right fielder, who hit 24 in 1915. In 1920, however, Ruth demolished his new mark, bashing 54 balls over the fence and changing the character of the game ever after. The year before Ruth broke Williamson’s record, 1918, the average number of home runs hit by an entire major league team was 14.7, about one every 9.5 games.
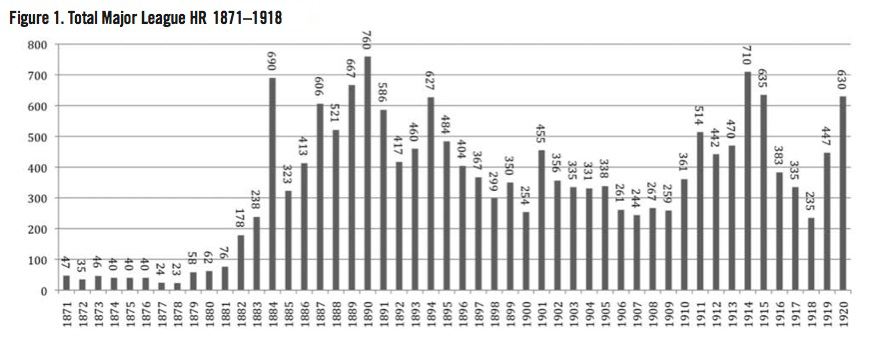
But is it true, as is often assumed, that the major league power game had always been so anemic as it was just before the Sultan of Swat hit the scene? Let’s look at the first 48 years of major league baseball from the National Association in 1871 through 1918 to see what part the home run played in the early game.[fn]For those who prefer to exclude the NA from the “major leagues,” nothing of what follows will be substantially affected.[/fn] Figure 1 shows the total number of major league home runs hit each year.
Figure 1: Total Major League HRs, 1871-1918

(Click image to enlarge)
The graph is neither random nor uniform. It shows a definite structure. For the first 11 years of major league baseball’s existence, the home run was an infrequent event which, although exciting in itself, did not have a significant impact on the game as a whole. Starting about 1882, however, the number of home runs began a decade-long, exponential increase. First, it more than doubled from just 76 in 1881 to 178 in 1882. It increased by another 34 percent in 1883. In 1884 it nearly tripled from the year before, to 690, but this number is not to be taken at face value. That was the year, as mentioned above, that the Chicago White Stockings changed the ground rule in their tiny Lake Front Park from balls going over the fence being counted as doubles to their being scored as home runs. The following year they moved to a different park of more conventional dimensions. Skipping over 1884, the number of home runs in 1885 rose 36 percent over what it had been two years earlier. This was followed by a 28 percent increase (to 413) in 1886, and a whopping 47 percent increase, to 606, in 1887. Home run production fell off somewhat in 1888, to “just” 521, but then it resumed its meteoric rise, climbing to 667 in 1889, a year-over-year increase of 28 percent. Finally, in 1890, home run production reached its 19th-century peak of 760, exactly ten times the number that had been hit just nine years earlier in 1881.
There are many possible explanations for such explosive growth. One is that the number of teams and even leagues was quite variable at this early point in the evolution of the professional game. In 1881, there was only one league, the National, with only eight teams. Just three years later, in 1884, there were three leagues—the National, the American Association, and the Union Association—collectively comprising 33 teams. The Union Association collapsed after a single year, reducing the number of major league teams back to 16, but this is still double what it had been in 1881. The number of leagues and teams remained stable until 1890, when the emergence of the Players League brought the total number of major league teams up to 25.[fn]However, the Baltimore Orioles of the AA played only 38 games that year, and the Brooklyn Gladiators, also of the AA, played only 100. All other teams played between 128 and 140 games.[/fn]
Figure 2: Total Major League HR/AB, 1871-1918

(Click image to enlarge)
It is important to note here that, whatever else, the curve of increased home runs across the 1880s does not look very much at all like the increase in the number of teams. Essentially, from 1883 to 1890, the number of teams was stable at 16 but for the UA spike in 1884 and the smaller PL spike in 1890. The home run curve, by contrast, shows large annual increases nearly every year. Nevertheless, to account for the possibility that the increased number of home runs across the 1880s was simply a statistical artifact of increased number of the teams, games, and players, I plotted the number of home runs hit as a proportion of the number of at bats (See Figure 2). The pattern of results, while not identical to the earlier graph, is much the same. The rise starts a little earlier, 1879, and continues on, with a little more year-to-year regression than in the original graph, until 1889. The 1884 spike is attenuated to a large degree. The increase from 1878 to 1889 represents more than a five-fold increase in the proportion of at bats that result in a home run (from .0017 to .0087). The year 1890, unlike in the original graph, does not represent the peak of 19th-century home run hitting. Instead, one sees production fall back somewhat from 1889 (to .0067). After three more years of unsteadiness, it reaches it 19th-century peak of .011 in 1894. Indeed, this would be the highest rate of home run hitting in the majors until 1921, when the Bambino re-shattered his own record by hitting 59 (and, perhaps more importantly, six players, including Ruth, hit more than 20 home runs for the first time in major league history).
So changes in the numbers of leagues and teams does not seem to have been the major factor behind the power surge of the 1880s and 1890s. However, the comings and goings of franchises are not the only possible explanations of the home run increase of the late 19th-century.[fn]I would like to thank a number of SABR members for pointing out a variety of possible explanations: Mark Armour, David Vincent, John Cappello, John Thorn, and especially Steve Hatcher.[/fn] This was a time during which the rules of the modern game were under development, and any number of rule changes might have influenced home run frequency. In 1879, the year of the first rise in home run rate (i.e., home runs as a proportion of at-bats), pitchers were first required by rule to face the batter. That might conceivably increase home runs, but it would not explain the continuing rise over the next decade-and-a-half. Moreover, if this rule change gave batters an advantage, it should be reflected in their batting averages as well, but major league batting averages actually declined from 1878 (.259) to 1879 (.254). They declined even further in 1880 (.245). So it doesn’t seem like this rule change accounted for any increase in hitting statistics.
In 1881, the pitcher’s box was moved back from 45 to 50 feet. This might have allowed batters to get a better look at the ball and, thereby, hit more home runs. Again we should look to a more general measure of batter success, batting average, in order to test this hypothesis. Indeed, major league batting averages increased from 1880 (.245) to 1881 (.260), but then fell back the following year (.248).[fn]Batting average is not the “best” metric of batter performance, and most sabermetricians prefer slugging percentage or OPS. However, the problems with batting average notwithstanding, what is needed here is a hitting statistic that is independent of home run rates, making slugging percentage a poor choice in this instance because it is confounded with the rate at which home runs are hit. In any case, one finds a similar pattern for slugging percentage here: .320, .338, .330 for 1880, 1881, 1882, respectively. The fallback is not as great in 1882 as with batting average precisely because the number of home runs (and the home run rate) continued to climb in 1882, contaminating slugging percentage.[/fn] Thus, the 1881 increase in batting average seems to have been a random “blip” rather than being directly attributable to the increased distance of the pitcher. Or, it was due to the increased pitcher distance, but after the 1881 season, pitchers devised ways to compensate for the challenges it posed. In any case, unlike batting average, home run rate continued its climb in 1882.
The year 1882 also marked the arrival of the American Association. One might argue that the home run rate increase that year was caused by a dilution of pitching talent (though no top pitchers moved from the NL to the AA). But even if one endorsed this claim, then one would have to explain the marked decrease in batting average that same year. If one argues that the dilution of hitting talent led to the decrease in batting average, then this would seem to foreclose the argument that dilution of pitching talent led to the increase in home runs. One cannot have it both ways.
Another set of rule changes that might have affected hitting was the number of balls required for a walk. In the late 1870s, it took nine balls to send a batter to first. Then the number steadily decreased: eight in 1880, seven in 1881, six in 1884, briefly back up to seven for 1886, then down to five for 1887, and four in 1889.[fn]Reputable sources vary on the exact years. These are derived from Total Baseball.[/fn] It is hard to say what effect this had on home run production. One might argue that more balls meant long at bats, which, in turn, meant more opportunities to hit home runs. In that case, the decrease in the number of balls required for a walk would have been expected to correspond to a decrease in the number of home runs, the opposite of what we observe over the course of the 1880s. On the other hand, giving pitchers the luxury of more balls before a batter walked may have enabled them to throw more tricky pitches, with the attendant increased risk that they would miss the strike zone. If so, lowering the number of balls per walk would have forced pitchers to pitch more consistently to the strike zone, giving batters more chances to hit home runs, which is what we, in fact, see during the 1880s. In any case, changes in the walk rules cannot explain why, if they were somehow responsible for the increase in home runs during the 1880s, the number of home runs then turned around and declined during the 1890s.
There were minor changes to the number of strikes required for an out during this period as well—four strikes in 1887, then back to three strikes in 1888—but those changes would seem to afford little opportunity to explain the rise and fall of home run rates over the late 19th century. Other changes to the size of the pitchers box and eventual reduction to the modern strip of rubber seem similarly insufficient to explain changes in home run production during this era.
Perhaps it is best to look at the records of the individual hitters who drove the power surge. The online appendix shows all hitters who had 15 or more home runs in a single season from 1871 until 1918. There were only 40 such player-seasons over the 48 years. None of those player-seasons came in the 1870s or the early 1880s. The earliest of the player-seasons with 15 or more home runs was 1884, in which four players made the grade. Unfortunately, all were Chicago White Stockings in the season tarnished by short fences: Ned Williamson (27), Fred Pfeffer (25), Abner Dalrymple (22) and Cap Anson (21).
The next earliest year in which a player hit 15 home runs in a season was 1887, when the mark was achieved by three players: Billy O’Brien of the Washington Nationals (19), Roger Connor of the New York Giants (17), and Fred Pfeffer of the Chicago White Stockings (16). (Pfeffer was the only one of the four 1884 White Stockings to repeat, legitimately, his earlier feat.) The following year, 1888, saw only one player reach 15 home runs: Jimmy Ryan of the Chicago White Stockings (16). (Ryan had not been on the 1884 team.)
The march of the sluggers resumed in 1889 when a record six players reached 15. They were led by Sam Thompson of the Philadelphia Quakers (NL) who was the first non-1884-Chicago-White-Stocking to hit 20 in a season. He was closely followed by his cross-town rival, Harry Stovey, who hit 19 for the Philadelphia Athletics (AA). Also hitting 19 was Bug Holliday of the Cincinnati Red Stockings (AA). Jerry Denny of the Indianapolis Hoosiers (NL) hit 18 and Jimmy Ryan of the Chicago White Stockings hit 17. Ryan was the first player who was not a member of the 1884 White Stockings to hit at least 15 home runs twice. Rounding out the class of 1889 was Charlie Duffee of the St. Louis Browns (AA), with 16.
Although 1890 saw more home runs hit (760) than any other single season in the 19th century, no player hit more than 15. The total increase was due to the appearance of the nine teams of the Player’s League in 1890. Interestingly, for reasons that are unclear, there was a simultaneous drop in the proportion of at bats that resulted in home runs (from .0087 in 1889 to .0067 in 1890). With the collapse of the Players’ League, 1891 witnessed a drop in the total number of ML home runs, as not only were fewer teams playing, the top pitching talent was once again concentrated. That year also saw the return of the 15+ HR hitter: Mike Tiernan of the New York Giants (NL) and Harry Stovey, now of the Boston Beaneaters (NL), each hit 16. Stovey was only the second player to hit 15 or more home runs twice (among non-Chicago White Stockings of 1884) after Jimmy Ryan.
Individual power seemed to skip the 1892 season, but the pace picked up again in 1893 when two Philadelphia Phillies reached the mark: Ed Delahanty hit 19, and Jack Clements hit 17 in just 94 games. In 1894—the only year in the 19th-century that the home run rate reached above 1 percent of at bats—four players topped 15 home runs. Leading the way were two Boston Beaneaters (NL): Hugh Duffy (18) and Bobby Lowe (17). Tied with Lowe was Bill Joyce (17) of the Washington Senators (NL), who reached the level in just 99 games. Behind was Bill Dahlen (15) of the NL Chicago franchise, which had picked up the nickname the “Colts.”
After that, home run production began to decrease. In 1895, Bill Joyce repeated his feat of 17—the first player to hit 15 or more in consecutive seasons—but he took 126 games to reach the mark this time. No one else did the deed that season. No one at all made the grade in 1896 or 1897. In 1898, Jimmy Collins of the Beaneaters just made it, hitting exactly 15. Then, in 1899, Buck Freeman of the Washington Senators (NL) set a new mark among non-members of the 1884 Chicago White Stockings by slugging an unheard-of 25. One measure of how exceptional Freeman’s feat was is that the second place finisher, Bobby Wallace (12) of the St. Louis Perfectos (NL) had less than half of Freeman’s total. Home run hitting continued to fall through the 1900s. Only two players hit more than 15 the entire decade: Sam Crawford of the Cincinnati Reds (NL) in 1901 with 16 and Socks Seybold of the Philadelphia Athletics (AL) in 1902, also with 16. In 1906, the raw home run total reached its lowest level (261) since 1883 and, in 1907, the major league home run rate reached its lowest level since 1880, more than a quarter-century earlier. The reasons remain unclear.
There was a modest rise (and fall) in home run hitting through the 1910s. In 1911 Frank Schulte of the Cubs hit 21 and Fred Luderus of the Phillies hit 16.[fn]The cork-centered ball was introduced in the 1910 Word Series and used during the 1911 season. This may well explain why 1911 home run production stands out in the otherwise relatively smooth rise and fall in home run production during 1909–1918. It does not explain that modest ten-year hump as a whole, however. [/fn] In 1913, Gavvy Cravath of the Phillies emerged as, perhaps, the game’s first consistent power hitter, cracking 19 that year, another 19 in 1914, and then 24 in 1915. In 1913 Cravath was joined on the 15+ list by his team-mate Fred Luderus, who hit 18. With the brief appearance of the Federal League in 1914, a number of other hitters momentarily broke through: In addition to Cravath was Vic Saier of the Cubs with 18, Dutch Zwilling of the Chicago Chi-Feds (FL) with 16, Sherry Magee of the Phillies with 15, and Bill Kenworthy of the Kansas City Packers (FL) also with 15. In 1915, below Cravath was just Hal Chase of the Buffalo Blues (FL) with 17.
With the collapse of the Federal League, and the re-concentration of pitching talent in the NL and AL, came a collapse of home run hitting as well. The major league home run total plummeted from 635 to 383. Why it dropped to levels lower than those seen before the appearance of the FL is unknown. In addition, no individual player hit 15 or more home runs in 1916, 1917, or 1918. The year 1918 witnessed the lowest major league home run total (235) in a full 36 years. In 1919, Babe Ruth, then still a pitcher with the Boston Red Sox, set the record of 29, mentioned at the start of this article. Moving to the Yankee outfield in 1920, he hit a stunning 54 and the game was never the same.
In conclusion, there seems to have been a trend toward more home run hitting in the late 19th century that stalled, for reasons that are not entirely clear, in the mid-1890s. The increase does not seem to have been a direct result of either league expansions or of rule changes, though both phenomena played some part. The emergence of a number of powerful players in the 1880s and 1890s seems to have been an important factor, but none of them became regular hitters of 15 or more home runs during that period: only two accomplished the feat even twice (excluding Pfeffer, who did it once during the tainted 1884 White Stockings season). The stall of the upward home run trend in the mid-1890s was followed by a colossal crash that brought home run totals and rates down by the mid-1900s to levels that had not been seen since the early 1880s. The nadir home run rate of .003 in 1907 represented a decrease of nearly three-quarters of its 1894 peak of .011—a drastic drop off in home run hitting in just over a decade. Again, the reason is not entirely clear. The development and widespread adoption of the hit-and-run strategies that players like Ty Cobb would raise to an art form may be the reason. But the lure of the game-breaking potential of the home run could never die entirely. The 1910s saw a modest rise in home run hitting again, driven partly by the momentary appearance of the Federal League, but power hitting was falling out of favor again when Babe Ruth arrived on the scene to change the way home runs were seen forever more.
CHRISTOPHER GREEN is a professor of psychology at York University in Toronto, where he teaches mostly statistics and history of psychology. He authored a piece in the 2004 “The National Pastime” about the work of psychologist Coleman Griffith with the Chicago Cubs in the late 1930s. He can be reached via e-mail at christo@yorku.ca.