
A Graphical View of the SABR Era
This article was written by Jim Albert
This article was published in Fall 2011 Baseball Research Journal
INTRODUCTION
Baseball has had a rich history in the forty years since the founding of SABR in 1971. It is interesting that SABR began at about the same time as the introduction of the designated hitter (DH) in the American League in the 1973 season. The intent of this article is to use graphs to show changes in batting, pitching, speed, strategy, attendance, and the length of games over the SABR era. Since the DH is used only for home games in American League ballparks, we focus on how these different baseball measures differ between the National and American leagues.
(Editor’s note: Click on an image below to enlarge it.)
RUN SCORING
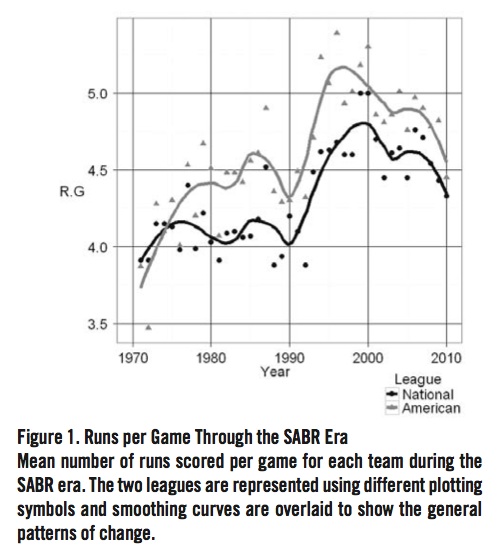
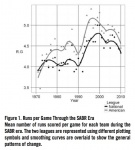
Teams win by scoring more runs than their opponents and so it is natural to look first at the pattern of run scoring across the SABR era. Figure 1 displays the mean number of runs scored per game for each team for the seasons 1971 through 2010; NL teams are displayed using black dots and AL teams using gray diamonds. Lowess smoothing curves are overlaid (black for the NL, gray for the AL), and these curves will be shown helpful for seeing the basic patterns of run scoring (and other baseball measures) across time. We see a general increase in run scoring from 1971 to 1985, followed by a brief lull until 1990 and then a dramatic increase until 1998. In recent years from 1998 to 2010, there has been a general decrease in run scoring. There is an obvious DH effect in run scoring, as the American League has consistently scored more runs than the National League. Also the patterns of run scoring in the two leagues has been roughly parallel in the period from 1980 to 2010, indicating that there are factors (such as the use of steroids) that have had equal effects on offense in both leagues during this period.
DIFFERENCE BETWEEN THE LEAGUES
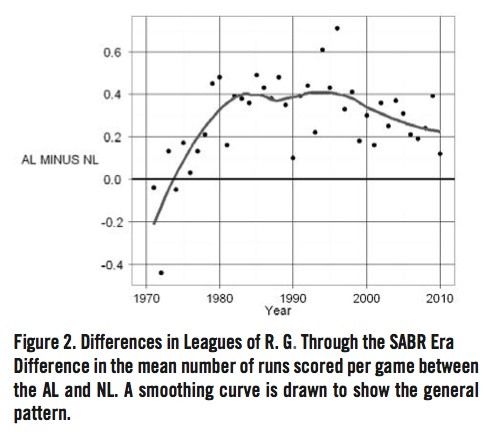
To better understand the difference in run scoring between the two leagues, Figure 2 displays the difference. AL MINUS NL = Average Runs Scored by an AL Team MINUS the Average Runs Scored by a NL team during the SABR era. It is interesting to note that the AL tended to score about 0.4 runs more runs per game (per team) for the period 1980 to 2000, but the difference has been decreasing slightly from 2000 to 2010.
HOME RUN HITTING
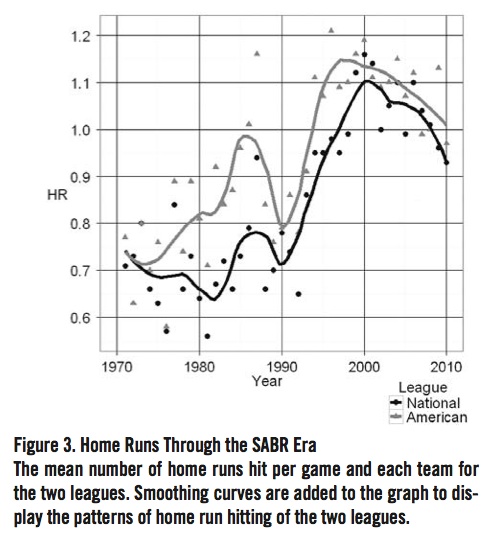
Since run scoring is strongly associated with home run hitting, it seems natural to explore next the pattern of home run hitting in the SABR era for each league. Figure 3 plots the mean number of home runs hit per game per team and overlays the points with smoothing curves. The pattern of home run hitting as shown in Figure 3 mirrors the general patterns in Figure 1—as run scoring increases, so does the rate of hitting home runs. Again there are two dramatic increases in home run hitting, the first increase occurring between 1975 and 1985, and the second increase between 1990 and 2000. There has been a gradual decrease in home run hitting in the last ten years.
WALKS
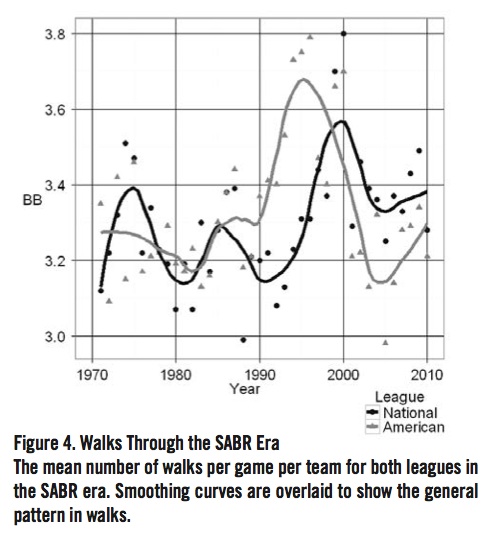
Although much less dramatic than the home run, a walk is an effective way for a batter to get on base and the media currently appreciate players who are careful about swinging at pitches and are good in drawing walks. Figure 4 demonstrates that the average number of walks per game and team has gone through dramatic changes during the SABR era. From 1970 to 1985, the average number of walks first increased until 1975, decreased from 1975 to 1980, and started to increase again until 1985. During the early period, it is difficult to distinguish the two leagues with respect to walks. From 1985 to 1995, walks become more common in the American League—in 1995, the AL averaged about 0.4 more walks (per game per team) than the NL. But in recent years, 2000 to 2010, the pattern has reversed and there have been consistently more walks issued by NL pitchers.
STRIKEOUTS
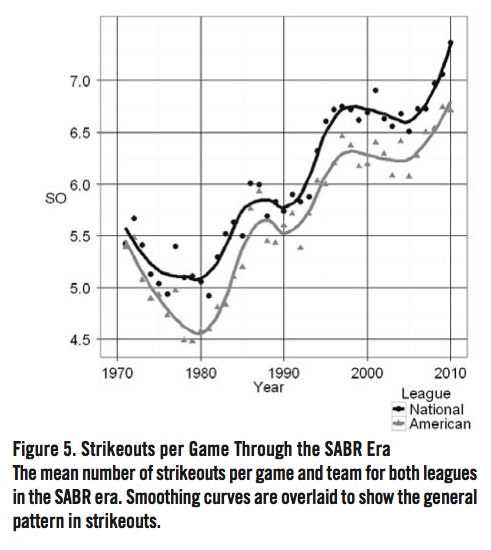
Home runs are intrinsically connected with strikeouts. As a player hits more home runs, it is common to believe he has a greater propensity to strike out. Figure 5 demonstrates that the mean number of strikeouts per game per team has gone through dramatic changes in the SABR ear. From 1980 to 2010, the mean number of strikeouts has increased from 4.5 to 6.7 in the AL, and from 5.1 to 7.3 in the NL. Generally, one sees one additional strikeout per game in a NL game (compared to an AL game) which can be attributed to the pitcher in the batting lineup.
SPEED—STOLEN BASES
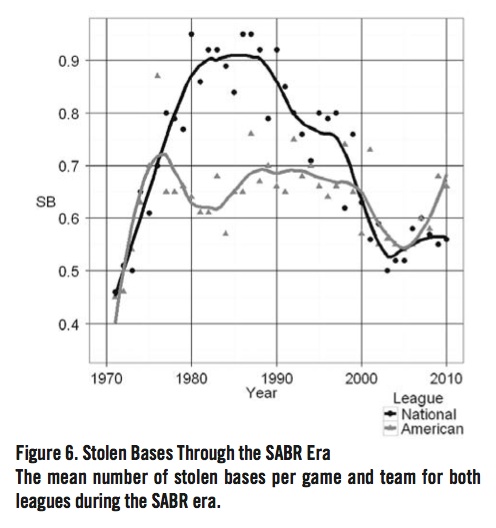
One exciting aspect of baseball is the use of speed to move around the bases and make fielding plays. One particular “speed play” is the stolen base. Figure 6 displays the mean number of stolen bases per game for each team for each league in the SABR era. The prevalence of the stolen base increased for both leagues from 1971 to 1976. But in the period 1976 to 2000, the stolen base was much more common in the National League; in the early 1980’s, the NL had approximately 0.3 more stolen bases per game per team. This pattern is expected since the AL has been scoring more runs and hitting more home runs, and the stolen base represents a “small ball” alternative method of scoring. In the recent period, 2000 to 2010, the stolen base average has been similar for both leagues.
STRATEGY—THE USE OF THE SACRIFICE BUNT
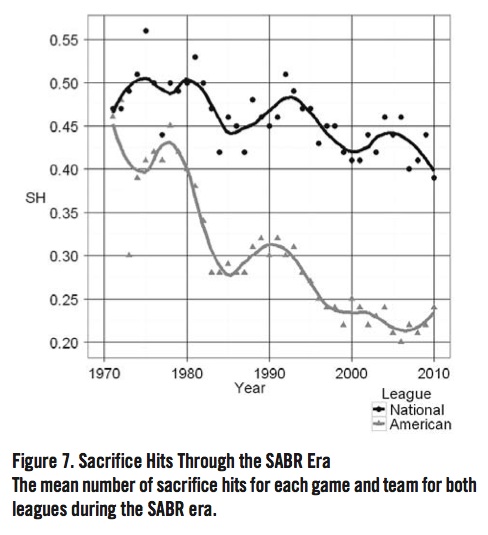
One obvious way the DH impacts baseball strategy is in the use of the sacrifice bunt. Pitchers in the NL will often attempt a sacrifice bunt to advance runners to second or third base and AL pitchers rarely have the same opportunity. Figure 7 displays the mean number of sacrifice hits per game per team for both leagues. As expected, sacrifice hits are much more prevalent in the NL; in recent years, the mean number of sacrifice hits in the NL is double the mean number of SH in the AL.
USE OF PITCHERS
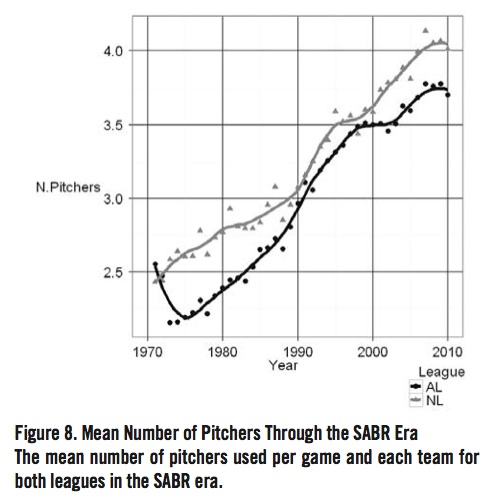
The use of pitchers has gone through dramatic changes in the SABR era. We all know that unlike 40 years ago, it is very uncommon for a starting pitcher to throw a complete game. Figure 8 displays the mean number of pitchers per game per league across the SABR era. There are two general comments. First, likely due to the DH rule, the NL tends to use about, an average, a half of a pitcher more per game per team than the AL. Also there has been a steady increase over the 40-year period in the number of pitchers used. Since the team roster is a fixed size, one would think that there would be some limit to the number of pitchers used in a game and so these graphs would tend to level off to some constant value over time.
BASEBALL ATTENDANCE
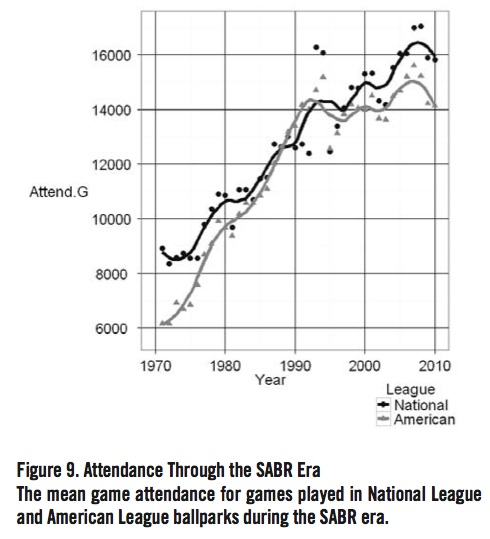
How has the popularity of baseball changed in the SABR era? Figure 9 displays the average attendance for games played in the NL ballpark and games played in the AL ballpark. The good news gleaned from this figure is that there has been a steady increase in the average attendance in both leagues. For most of the years, the NL has averaged a higher attendance then the AL—in recent years, the average attendance at a NL game is 2,000 higher than at an AL game.
TIME OF GAME
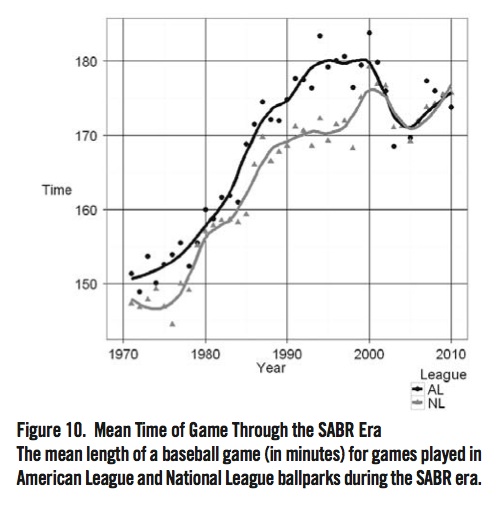
One general concern about baseball is that it is perceived to be a slow game compared to other sports such as basketball and football. How has the time of a baseball game changed over the SABR era? Back in 1971, the mean length of a game was about 148 minutes (two and a half hours) in the NL and about 151 minutes in the AL. The mean lengths of games has shown a steady increase until about 1995 when the games averaged 180 minutes in the AL and 170 minutes in the NL. It is interesting that the mean game times decreased in the period 2000 to 2005 and increased in the last five years. Two obvious reasons for the change in game times are the increases in run scoring (Figure 1) and the number of pitchers used (Figure 7).
CONCLUDING REMARKS
The source of the data for most of these graphs is Sean Forman’s baseball-reference.com website, where tables give summaries of many pitching and batting measures for each league in the history of Major League Baseball. The original data source is the game logs provided by the Retrosheet organization at retrosheet.org; several graphs were created using Retrosheet game logs for the seasons 1971 through 2010. The graphs were created using the ggplot2 package (Wickham, 2009) using the open-source R statistics system.
JIM ALBERT is a statistics professor at Bowling Green State University and has been a SABR member for many years. He has a keen interest in the statistical analysis of baseball and was a coauthor (with Jay Bennett) of “Curve Ball: Baseball, Statistics, and the Role of Chance in the Game” that won The Sporting News–SABR Baseball Research Award in 2001. He is current editor of the “Journal of Quantitative Analysis of Sports” and has been a Phillies fan since childhood.
Sources
- R Development Core Team (2011), “R: A language and environment for statistical computing,” R Foundation for Statistical Computing, Vienna, Austria, www.R-project.org.
- Wickham, H. (2009), ggplot2: Elegant Graphics for Data Analysis, Springer, New York.