Does a Pitcher’s Height Matter?
This article was written by Glenn P. Greenberg
This article was published in Fall 2010 Baseball Research Journal
In 1993 the Los Angeles Dodgers traded a setup man for a very good second baseman on the Montreal Expos. It may have seemed like the Dodgers had just ripped off their trading partner. The setup man had a great arm but, according to Tommy Lasorda, he was too small to handle the rigors of starting and therefore had limited potential. The pitcher was Pedro Martinez.
 There are many baseball theories. Some theories— for example, that control is the most important part of pitching—have merit. But some are wrong. Case in point: Players used to say that Bob Feller’s fastball rose, but physics has proven that it couldn’t, that it was physically impossible.
One common baseball theory is that taller pitchers are more durable and just intrinsically better than shorter pitchers. In this article I investigate whether that notion is true. I examined this theory by using a number of statistical techniques, including linear regressions and chi-square tests. For all linear regressions, transformations and nonlinear regressions were done but failed to substantially improve the r-squares. For an explanation of how the statistics were analyzed you can read the appendix at the end of the article.
In my analysis, I examined only players who were good enough to be drafted. As a result, the most this paper can say is that, when it comes to players who are good enough to be drafted in the Rule 4 amateur draft, the correlation between height and a player’s effectiveness or durability is not statistically significant. It is possible, regardless of the findings of this article, that there is a correlation between height and a player’s effectiveness or durability at lower levels, but I do not address the issue here, because of insufficient data and confounding variables, such as social pressures that convince shorter people to play positions other than pitcher.
The idea that taller pitchers are more effective and durable is ingrained in baseball. For example, Whitey Ford signed with the Yankees after they offered him more than the Dodgers did, who “told me they thought I was too small anyway,” Ford recalled many years later.1 At first glance, the theory makes intuitive sense. Taller pitchers are more intimidating, throw on a greater downhill plane, and release the ball closer to the plate. You would think that someone taller would be able to throw harder since they have longer arms and their greater size should enable them to be better able to withstand the punishment of pitching.
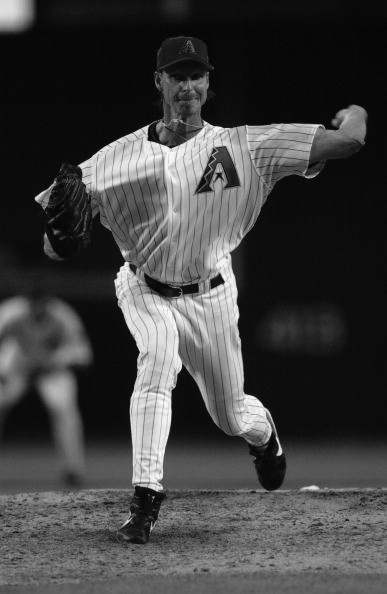
However, if you start to think about these assumptions, many of them just don’t hold up. While Randy Johnson was incredibly intimidating at 6-foot-10, the same can be said for Pedro Martinez at 5-foot-11. While longer arms, acting as levers, are certainly helpful in throwing hard, having a quick arm is just as important, if not more so. When it comes to durability, each pitcher is throwing his hardest, so his muscles are working at their hardest. Jon Rauch is not trying less hard to throw his 92-mph fastball than Francisco Rodriguez is trying when he throws his fastball at 92 mph. “We’re not selling jeans here,” as Billy Beane, responding to scouts who said that Jeremy Brown had a bad body, is quoted in Moneyball. Under this thinking height should not have a significant impact on a pitcher’s effectiveness or durability.
Pitching Effectiveness
The first question to be studied is whether height has an effect on major-league pitchers’ effectiveness. Taking the years 1990 through 2007, I looked at starting pitchers who qualified for the earned-run-average title for one season or more and at relief pitchers who pitched in 45 or more games (or the equivalent in a strike-shortened season) while starting fewer than ten games.
As you can see in table 1, the data show no evidence of a statistically significant correlation, for starting pitchers, between height (in inches) and any of the customary measures of pitching effectiveness. These include strikeouts per nine innings, walks per nine innings, strikeouts per walk, home runs per nine innings, WHIP (walks plus hits divided by innings pitched), and earned run average. The highest r-square was .5 percent for a nonlinear regression for strikeouts per nine innings pitched. An r-square of .5 percent is extraordinarily small. It means that height has little ability to predict the number of strikeouts per nine innings a pitcher would throw. In addition, the p-values are all very high, the lowest being .14—almost three times greater than the maximum p-value indicating statistical significance.
Table 2 shows that there is also no correlation between height and effectiveness for relief pitchers. The highest r-square is .3 percent, which is simply too small for the line to have predictive powers. The p-values are also well above the .05 limit, too high to be statistically significant. As a result, it can be said that the statistics do not show a correlation between pitching height and effectiveness for an established major-league pitcher.
In sum, the data indicate that height is essentially irrelevant when a pitcher is good enough to become an established major-league pitcher.
At this point we can say out loud what our eyes say when we watch Tim Lincecum or Greg Maddux. Height does not matter for major-league pitchers because only the truly talented make it to the major leagues in the first place.
Making it to the Majors
What should be important to major-league franchises is finding players who have the talent to become major-league pitchers. If taller minor-league pitchers are more effective, then it makes sense to scout taller pitchers. There is the belief that taller, leaner young pitchers are more “projectable”—more likely to throw harder as they get older—than their shorter counterparts. For example, Joel Zumaya was drafted in the eleventh round in 2002 despite topping out only in the upper 80s, because he had a “projectable” body. If the theories about pitchers’ heights are correct, one would expect drafted pitchers who are taller, both starters and relievers, to be more likely to make it to higher levels in the minor leagues and to become established major-league pitchers. Looking at the Rule 4 amateur draft from 1985 through 2002, we actually find no correlation between the two variables (table 3). The p-value of .21 is well above the maximum of .05 for showing a statistically significant correlation between height and professional advancement. The evidence, therefore, said that there is no correlation between height and making it to the majors—or to Triple A, or to Double A, and so on—as a pitcher.
The data for three subcategories were then examined for the likelihood of becoming
- an established major-league pitcher,
- an established major-league starting pitcher,
- an established major-league relief pitcher.
The study applied the same criteria as were used for evaluating pitching effectiveness. The p-values were .61 for an established pitcher, .52 for an established relief pitcher, and .005 for an established starting pitcher. As a result, it can be said that there was insufficient evidence to show a correlation between height and becoming an established major-league pitcher in general (whether a starter or a reliever) but that there was enough evidence to show a correlation between height and becoming specifically an established major-league starting pitcher. While drafted shorter players are just as likely to become established major-league relief pitchers and established major-league pitchers in general, taller pitchers are more likely to become established major-league starting pitchers.
Table 1. Established Major-League Starting Pitchers, 1990–2007
| Dependent Variable | Linear Regression R-Squared | P-Value of Data | Sign of the Effect (If there is one) |
|---|---|---|---|
| Walks / 9 innings pitched | .0001 | .82 | N/A |
| Earned-run average | .00001 | .94 | N/A |
| Home runs / 9 innings pitched | .003 | .29 | N/A |
| Strikeouts / 9 innings pitched | .005 | .14 | N/A |
| Strikeouts / walk | .0006 | .61 | N/A |
| WHIP (Walks plus hits divided by innings pitched) | .0003 | .73 | N/A |
Table 2. Established Major-League Relief Pitchers, 1990–2007
| Dependent Variable | Linear Regression R-Squared | P-Value of Data | Sign of the Effect (If there is one) |
|---|---|---|---|
| Walks / 9 innings pitched | .0007 | .48 | N/A |
| Earned-run average | .0026 | .19 | N/A |
| Home runs / 9 innings pitched | .0008 | .46 | N/A |
| Strikeouts / 9 innings pitched | .003 | .13 | N/A |
| Strikeouts / walk | .00003 | .89 | N/A |
| WHIP | .001 | .42 | N/A |
Table 3. Rule 4 Amateur Draft, 1985–2002
| Dependent Variable | P-Value of Chi-Square Test | Sign of the Effect (If there is one) |
|---|---|---|
| Round drafted | 0 | Positive * |
| Highest level got to in professional baseball (majors, AAA, etc.) | .21 | N/A |
| Becoming established major-league pitcher | .61 | N/A |
| Becoming established major-league starting pitcher | .005 | Positive** |
| Becoming established major-league relief pitcher | .52 | N/A |
The explanation for these results is uncertain. Brad Steil, director of baseball operations for the Minnesota Twins, writes that it is possible that “perhaps there are just more taller pitchers who are able to meet the minimum standard of performance that allows a pitcher to be a major league starter.”2 On the other hand, I speculate that shorter pitchers are given fewer opportunities to make it as an established major-league starting pitcher because of the preconceptions that are embodied in the theory being tested here. In effect, then, as with Pedro Martinez, the commonly held belief becomes a self-fulfilling prophecy.
If shorter pitchers have the same ability as do taller pitchers to advance through the minor-league system and to get major-league hitters out, then the quality of their pitches should be equal. Also, shorter pitchers walk the same number of players per nine innings, pitch the same number of innings, and get injured at the same rate (as will be shown later) as taller pitchers. Given this information shorter pitchers should be just as durable as taller pitchers in any given game, as well as throughout the season. As a result, the conclusion that makes the most sense is that the reason for the statistically significant correlation between height and becoming an established major-league starting pitcher is opportunity rather than any difference due to genetics.
Durability
Another reason shorter pitchers are drafted later is durability. The theory is that shorter pitchers are less durable than taller ones. David Cameron stated the prevailing theory about durability in an article in Baseball Prospectus: “There is validity to the belief that shorter pitchers have a smaller margin for error. In order to generate the same power as a pitcher with more natural strength, they can tend to put more pressure on their arms, thus leading to poor mechanics and eventual injuries.”3
The first question when it comes to durability is, for starting pitchers, whether a short pitcher can throw as many innings as a tall pitcher can or, for relievers, whether a short pitcher can throw as many innings and appear in as many games. As table 4 reflects, the r-squares never got above even .003, or .3 percent, no matter what was done to the data. The p-values also were well above .05, the maximum level of statistical significance. These data show insufficient evidence of a correlation between height and a pitcher’s use during a season.
The second question is how likely a pitcher is to pitch year after year without getting injured. One way of measuring that is to see how many years an established major-league starting pitcher was able to qualify for the ERA title and how many years an established major-league relief pitcher was able to throw in more than 45 games. The p-value for the starting pitchers was .98, and for relief pitchers .it was .45—which essentially means that the chances that there is a correlation between height and years as an established major league starting pitcher or relief pitchers are about as great as the chances that Switzerland will start World War III.
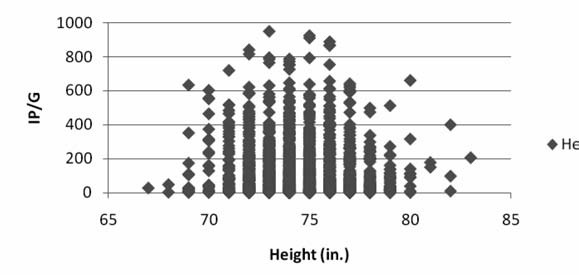
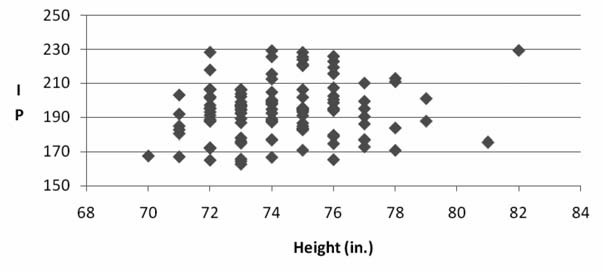
Height was not correlated to durability in seasons in which players were healthy, but that fact does not end the analysis. For us to be able to say that height does not correlate to durability at all, short pitchers would have to throw as much and stay off the disabled list as much as taller pitchers. The data for players on the disabled list at any time during 1994 through 2007 can be seen in table 5. There is no statistically significant correlation for games started or innings pitched; the highest r-square being .002 and the lowest p-value being .096. However, there is a correlation between height and games—a negative one: greater height correlates to fewer games pitched.
Table 4. Durability Data for Starting and Relief Pitchers, 1990–2007
| Dependent Variable | R-Squared | P-Value of Data | Sign of the Effect (If there is one) |
|---|---|---|---|
| Innings pitched (SP) | .003 | .31 | N/A |
| Innings pitched (RP) | .003 | .19 | N/A |
| Games (RP) | .0016 | .30 | N/A |
| Dependent Variable | P-Value of Chi-Square Test | Sign of the Effect (If there is one) | |
| Seasons qualified for ERA title | .98 | N/A | |
| Seasons of 45 or more game appearances (with other stipulations) | .45 | N/A |
The evidence on a correlation between height and disabling injuries tends to confirm these data. Dr. Robert Altbaum of Westport, Connecticut, categorized injuries that led to being placed on the disabled list. The eight categories that he employed were non-baseball injuries, injuries that are unlikely to be related to a pitcher’s height, nagging pitching injuries, serious injuries to body parts other than the arm, precursors to arm injuries, serious arm injuries, minor injuries, and injuries that are unable to be determined. Injuries that are unlikely to be related to height are injuries like blisters and infections. “Nagging injuries” are relatively minor injuries to parts of the body other than the arm; examples would include groin strains and knee tendinitis.
Games by Height for Players Who Appeared on the Disabled List
Precursors to serious arm injuries are arm injuries—such as elbow strains and rotator cuff tendinitis—that, while not serious in themselves, can lead to serious arm injuries. Serious arm injuries are injuries— such as torn ulnar collateral ligaments or torn rotator cuffs—that prevent the pitcher from continuing to pitch for some time, may require surgery, and may threaten the pitcher’s career. These are the three types of injuries to which shorter pitchers are supposedly more susceptible.
None of the p-values for any variable with respect to disabled-list stints is below .05, the maximum level for statistical significance. This means that there was no evidence of a statistically significant correlation between height and the number of disabled-list stints, the number of days spent on the disabled list or disabled-list stints due to nagging injuries, to serious arm injuries, or to precursors to serious injuries.
These data demonstrate that there is no statistical evidence that shorter pitchers are more or less durable than taller pitchers. The statistics suggest that they are just as prone to each type of injury,they recover at the same rate and they get injured as often. Given that durability is the most often cited concern for baseball executives when drafting shorter pitchers, the evidence in this study that durability does not correlate to a pitcher’s height is highly significant. Brad Steil explained the prevailing theory as “You know, a large, strong body is more durable in general.”4 However, the data contradict that claim.
Throwing Arm
There is one final piece to the puzzle. Baseball has overlooked the “height rules” for left-handed pitchers because of their dearth. The data for the left-handed pitchers could have affected the numbers for all pitchers as a whole. If height has an effect on success or durability for right-handed pitchers, then baseball teams should still draft taller right-handed pitchers over shorter ones.
Table 5. Disabled List, 1994–2007
| Dependent Variable | P-Value of Chi-Square Test | Sign of the Effect (If there is one) | |
|---|---|---|---|
| Number of disabled list (DL) stints | .63 | N/A | |
| Number of DL stints due to nagging injuries | .27 | N/A | |
| Number of DL stints due to precursor to a serious arm injury | .36 | N/A | |
| Number of DL stints due to a serious arm injury | .82 | N/A | |
| Dependent Variable | R-Squared | P-Value of Data | Sign of the Effect (If there is one) |
| Games | .006 | .0018 | Negative* |
| Games started | .002 | .096 | N/A |
| Innings pitched | .00001 | .88 | N/A |
* The taller the fewer games appear in
The data found in tables 6 through 10 and in graphs 2 and 3 show that conclusions previously set forth are unaffected when separated by throwing arm. The highest r-square for right-handed pitchers was .009, meaning that only .9 percent of the data was explained by the graph. The highest for a left-handed pitcher was .033, so that 3.3 percent of the data was explained by the graph.
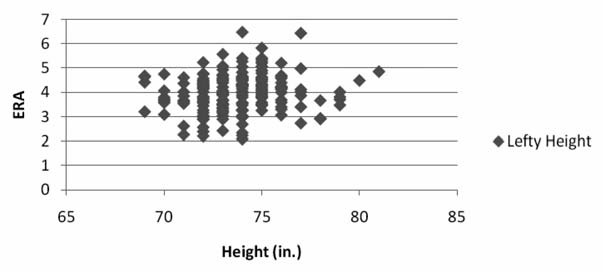
Left-Handed Pitchers, Earned-Run Average by Height
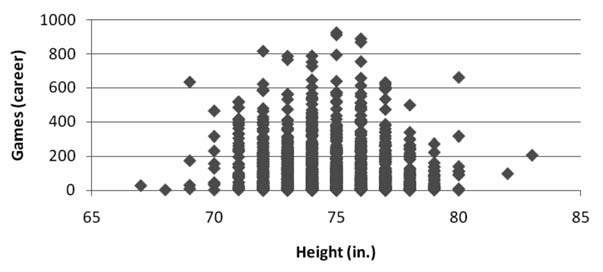
The only variables for which the p-value was lower than .05 was the earned-run average of lefthanded relief pitchers, the number of games appeared in by right-handed pitchers who had spent at least one stint on the disabled list, and innings pitched (per season) by left-handed starting pitchers. There is no apparent explanation for these correlations, especially absent any correlation for the other variables. Indeed, the correlation for the earned-run average of left-handed relief pitchers—the taller the pitcher the higher his earned-run average—is the reverse of commonly accepted wisdom. Again, the taller the player, the fewer games he appeared in. While the number of innings pitched per season by left-handed starting pitchers is in the hypothesized direction, it is questionable what is the cause and what is the effect.
Right-Handed Pitcher with DL Time, Game Appearances by Height
Since there is no difference in this statistic for right-handed starting pitchers, the reason shorter pitchers throw fewer innings may be that they’re less durable or it may be that managers and baseball executives believe that shorter pitchers are less durable. Even if starting left-handed pitchers who are shorter are in fact less durable, the difference, while statistically significant, is still not that great.
The data speak for themselves. Baseball organizations have been scouting, signing, and developing players based on a fallacious assumption. Shorter pitchers are just as effective and durable as taller pitchers. If a player has the ability to get drafted, then he should be drafted in the round that fits his talent.
The opportunity for major-league clubs is currently at its greatest potential. Clubs that value short pitchers with talent have an opportunity similar to those of clubs that, a decade or more ago, valued on-base percentage at a time when many of their competitors did not.
Table 6. Right-Handed versus Left-Handed Pitchers, Established Major-League Starting Pitchers, 1990–2007
| Dependent Variable | R-Squared | P-Value of Data | Sign of the Effect (If there is one) |
|---|---|---|---|
| Right, Left | Right, Left | Right, Left | |
| Walks / 9 innings pitched | .002, .007 | .47, .38 | N/A, N/A |
| Earned run average | .001, .013 | .56, .22 | N/A, N/A |
| Home runs / 9 innings pitched | .002, .006 | .44, .43 | N/A, N/A |
| Strikeouts / 9 innings pitched | .0001, .007 | .27, .39 | N/A, N/A |
| Strikeouts / walk | .0002, .004 | .82, .52 | N/A, N/A |
| WHIP | .0001, .01 | .84, .28 | N/A, N/A |
Table 7. Right-Handed versus Left-Handed Pitchers, Established Major-League Relief Pitchers, 1990–2007
| Dependent Variable | R-Squared | P-Value of Data | Sign of the Effect (If there is one) |
|---|---|---|---|
| Right, Left | Right, Left | Right, Left | |
| Walks / 9 innings pitched | .001, .0111 | .49, .15 | N/A, N/A |
| Earned run average | .0016, .0195 | .38, .05 | N/A, Positive* |
| Home runs / 9 innings pitched | 2.64e-6, .0069 | .97, .25 | N/A, N/A |
| Strikeouts / 9 innings pitched | .0012, .0144 | .45, .10 | N/A, N/A |
| Strikeouts / walk | .0003, .00005 | .68, .92 | N/A, N/A |
| WHIP | .0019, .0074 | .34, .24 | N/A, N/A |
Table 8. Right-Handed versus Left-Handed Pitchers, Rule 4 Amateur Draft, 1985–2002
| Dependent Variable | P-Value of Chi-Square Test | Sign of the Effect (If there is one) |
|---|---|---|
| Right, Left | Right, Left | |
| Round drafted | 1.48e-12, 4.07e-7 | Positive, * Positive* |
| Highest level got to in professional baseball (Majors, AAA, etc.) | .22, not enough data | N/A, not enough data |
| Becoming established major league pitcher | .43, .81 | N/A, N/A |
| Becoming established major league starting pitcher | .006, .45 | Positive**, N/A |
| Becoming established major league relief pitcher | .80, .45 | N/A, N/A |
Table 9. Right-Handed versus Left-Handed Pitchers, Disabled List, 1994–2007
| Dependent Variable | P-Value of Chi-Square Test | Sign of the Effect (If there is one) |
|---|---|---|
| Right, Left | Right, Left | |
| Number of disabled-list (DL) stints | .11, not enough data | N/A, not enough data |
| Number of DL stints due to nagging injuries | .14, not enough data | N/A, not enough data |
| Number of DL stints due to precursor to a serious arm injury | .29, not enough data | N/A, not enough data |
| Number of DL stints due to serious arm injury | .78, not enough data | N/A, not enough data |
| Days spent on the DL | .71, .43 | N/A, N/A |
| Dependent Variable | R-squared | P-Value of Data | Sign of the Effect (If there is one) |
|---|---|---|---|
| Right, Left | Right, Left | Right, Left | |
| Games | .009, .003 | .0013, .24 | Negative*, N/A |
| Games started | .0004, .005 | .49, .12 | N/A, N/A |
| Innings pitched | .0009, .003 | .31, .27 | N/A, N/A |
| Walks / 9 innings pitched | .001, .0111 | .49, .15 | N/A, N/A |
* The taller the fewer games appeared
Table 10. Right-Handed versus Left-Handed Pitchers Starting and Relief Pitchers, Durability Data, 1990–2007
| Dependent Variable | R-Squared | P-Value of Data | Sign of the Effect (If there is one) |
|---|---|---|---|
| Right, Left | Right, Left | Right, Left | |
| Innings pitched (SP) | .0002, .033 | .81, .05 | N/A, Positive* |
| Innings pitched (RP) | .0006, .0044 | .60, .36 | N/A, N/A |
| Games (RP) | .0019, .0018 | .33, .56 | N/A, N/A |
*The taller the more innings pitched
| Dependent Variable | P-Value of Chi-Square Test | Sign of the Effect (If there is one) |
|---|---|---|
| Right, Left | Right, Left | |
| Seasons qualified for ERA title | not enough data, not enough data | not enough data, not enough data |
| Seasons of 45 or more game appearances (with other stipulations) | not enough data, not enough data | not enough data, not enough data |
Appendix
Everyone with an interest in baseball bandies about baseball statistics. Even the most casual fan can spot trends and correlations, such as the tendency of players’ performance to decline after a certain age. Statisticians, however, examine trends not through casual inference but rather through applied mathematics.
Left-Handed Starting Pitchers – Innings Pitched (Season) by Height
One thing a statistician does is look for mathematical correlations between two variables. Statisticians find correlation, or lack of correlation, between two variables in a number of ways. One is by making scatter-plot graphs and seeing how “closely” different types of lines fit (accurately represent) the data. The lines are linear regressions, and the statistic that shows how closely the lines fit is called the “R-square value.” R-squares range from a “no fit” of 0 percent, or 0.00, to a “perfect fit” of 100 percent, or 1.00.
When the line does not perfectly fit, there are residuals, which are the differences between the line and the actual data. A graph of residuals should demonstrate no pattern; the graph should look random. If the residuals do not look random, then the data need to be altered to see correlations by creating “transformations.” Transformations include things like squaring data. The same rules for the r-squares of a linear regression apply for transformations.
Another way statisticians look at correlations is through p-values. “P-value” is the common term used to express probability. Things either happen by chance or they are not random and are deemed “statistically significant.”
When an event or correlation between two variables occurs, the statistical question is, “What is the likelihood that this is due to chance?” For example, if two events are linked and the probability that this occurred by chance is only 1 in 1,000, we would say the p-value is .001. Since the likelihood that it occurred by chance is so low, we assume the linkage is not random and therefore is statistically significant. The lower the pvalue, the lower the possibility the correlation is by chance and the greater the likelihood it is significant. By convention, statisticians say a p-value ? 0.05 (the probability of an association by chance is less than or equal to 1 in 20) is called statistically significant.
There is another way to find correlations, and that is size of the effect. Size of the effect is a measure of the strength of a relationship between two variables. While this way of testing is popular among some statisticians, using p-values and r-squares are far more common in publications. Also, finding the size of the effect would most likely have yielded no difference in the results, and so size of the effect is not included in the data.
GLENN P. GREENBERG is a former collegiate baseball pitcher who has always been interested in the use of statistics in baseball.
Acknowledgments
Anthony Van Daalen and Graham Schneider provided help with the statistical analysis. President Robert Oden and Athletic Director Leon Lunder of Carleton College provided generous financial support. Professor Charles Pavitt (University of Delaware) provided help with general information on this subject. Baseball coach Aaron Rushing (Carleton College) and Brad Steil (director of baseball operations for the Minnesota Twins) contributed important insights. Robert Altbaum, M.D., of Westport, Connecticut, provided assistance with the medical issues involved. However, the conclusions are solely those of the author.
Notes
1 Wayne Coffey with Peter Botte, “Short-Sighted: Smaller Pitchers Don’t Measure Up to Scouts, Teams,” New York Daily News, 10 June 2001.
2 Brad Steil, e-mail interview, 8 May 2009.
3 David Cameron, “Prospecting: Short Pitchers,” Baseball Prospectus, 3 July 2003, http://www.baseballprospectus.com/article.php?articleid=2064.
4 Brad Steil, telephone interview, 8 May 2009.


