

The Hidden Value of Glovework
This article was written by Vince Gennaro
This article was published in Summer 2010 Baseball Research Journal
When Jack Zduriencik replaced Bill Bavasi as the Mariners’ general manager, it didn’t take long for the savvy Mariner fan base to realize that changes were afoot. Zduriencik, who apprenticed under the Brewers’ general manager Doug Melvin, had operated in an organization that valued data and analysis as a critical component of their decision-making process. Gone are the days when general managers can consistently make sound decisions based purely on intuition and experience. That approach went out the door—or should have—about a decade ago when the Dodgers signed Kevin Brown to a seven-year, $105-million contract. The stakes have gotten too large and the business is far too complicated for seat-of-the-pants decision making. One ill-informed decision, such as a poor, long-term free-agent contract, could send an organization into a tailspin that might cost them an entire generation of fans before they can recover.
Zduriencik had to find a way to efficiently compete with clubs with more resources, including the division rival Los Angeles Angels, as well as the perennial American League powerhouses, the Yankees and Red Sox. The key to competing efficiently is to get the biggest bang for your payroll bucks by finding “value.” One approach is to determine which player-performance attributes or skills are “discounted” in baseball’s labor market. If a player attribute that translates into runs scored or runs prevented is not priced accurately—much as on-base-percentage was undervalued pre-Moneyball—it might lead to a cost-effective roster strategy. Another approach is to develop a roster strategy that uniquely fits a team or, more specifically, a ballpark. The Red Sox are masters of this approach, tailoring their roster to the Green Monster at Fenway Park. This means that right-handed fly-ball hitters are “worth” more to the Red Sox than to most teams, as their would-be outs at other ballparks are often doubles or home runs at Fenway. The Green Monster also allows Boston to have a near-DH patrol left field with minimal consequences. When the Red Sox gameplan their 95 to 100 targeted regular-season wins each year, their roster strategy implies that their expectation is to win 55-plus games at home and play .500 ball on the road.
To capitalize on both of these definitions of “value,” Zduriencik and his top assistant Tony Blengino focused on building a first-rate defensive ballclub. Arguably, defense has become the new on-base-percentage, the latest attribute or skill that seems to be undervalued in the market for players. I’ve conducted an in-depth analysis of the free-agent market—MLB’s most fluid labor market—and concluded that a run prevented through stellar defensive play can be purchased at about one-third of the cost of a run generated through offensive performance. Beyond the way MLB teams value defense, the distinctiveness of Safeco Field, with its expansive outfield, lends itself to a ballpark-based roster strategy. By building a top defensive club, with a particular focus on outfield defense, the Mariners could have a distinct competitive advantage for 90 of their 162 games, including games played at spacious McAfee Coliseum in Oakland.
In recent years, the development of defensive metrics such as Ultimate Zone Rating (UZR) by Mitchel Lichtman and the Plus/Minus Ratings developed by John Dewan have become widely discussed and frequently used among MLB teams. The primary intent of these statistics is to shine a light on the defensive side of individual players, providing teams and fans with a comparative scale on which to measure defensive performance. The data are focused on the primary, or direct, effect of defense—which is the impact of good or bad defensive plays on baserunners allowed and on baserunners advanced and, ultimately, the translation of those defensive plays into a team’s runs allowed. For example, UZR data say that the starting outfield of the 2008 Mariners performed slightly above average, saving about 10 runs above average, contributing the equivalent of approximately one additional win of the Mariners 2008 total of 61 wins. By contrast, the 2009 version of the Mariners’ outfield, anchored by defensive standout Franklin Gutierrez, saved about 50 runs above average, making their outfield defense responsible for approximately 5 of the 85 Seattle wins.
Figure 1
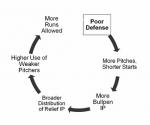
While the defensive metrics allow us to quantify a player’s impact on his team’s runs allowed and, ultimately, wins, the measures stop short of quantifying the secondary, or indirect, effect of defense on pitching and pitching usage. Most baseball insiders and analysts would agree that the impact of defense is not limited to the baserunners allowed and the likelihood the baserunners will score. For example, another consequence of a defensive misplay—a play that should have turned a batted ball into an out—is the additional number of pitches required to secure the out. For poor defensive teams the additional pitches can add up and alter how a team deploys its pitchers, often placing an inferior pitcher on the mound in a crucial situation. For stellar defensive teams the opposite may be true— their best pitchers may garner a higher share of innings pitched, raising the overall effectiveness of the team’s pitching staff. One example of a major-league manager’s belief in this “secondary effect” is embedded in a statement made by Mets’ manager Jerry Manuel at a pregame press conference on May 6, 2009. “An error by Luis Castillo last night caused J. J. Putz to throw more pitches, making him unavailable for tonight’s game,” Manuel observed, drawing a connection between defensive misplays and a pitcher’s workload.1
To test this hypothesis, I attempted to measure the secondary effects of defense on pitching usage. (See figure 1.) Looking at the issue from the negative side— poor defense—illustrates the point. The logic chain says that poor defense leads to missed opportunities to convert batted balls into outs, which leads to shorter outings by starting pitchers, which by definition leads to additional bullpen innings. More specifically, I tested to find whom these additional bullpen innings were allocated to, my suspicion being that they fell into the hands of the lowest-quality relievers. If this were true, the net result would be additional runs allowed by a poor defensive team because of an inefficient allocation of pitching—a secondary, indirect effect of poor defense. We would also expect the reverse to be true of top defensive teams.
I analyzed five years, 2004 through 2008, of team-level defense and pitching data to test for the secondary effect of defense on pitching. (For more details on the methodology of the analysis, see “Secondary Effects of Defense on Pitching” on page 102.) There are several key conclusions of the study that have implications for the Mariners’ strategy of building a strong defensive team. First, analyzing the top-quartile and bottom-quartile defensive teams shows clear support for the connection between the quality of a team’s defense and its pitching usage. Top defensive teams average approximately one-half inning per game more out of their starting pitcher. While that may not sound like a lot, taking away or adding one-half inning to a bullpen that averages three innings per game is a 17 percent change in the bullpen’s workload. For the typical team, that translates into about an 80-inning swing, over the regular season, between starting pitchers or the bullpen, just on the basis of the quality of the defense. (See figure 2.)
Figure 2. Distribution of IP for Top and Bottom Quartile
| Starting Pitcher IP per Game | Bullpen IP per Game* | |
|---|---|---|
| Top-Quartile Defensive Teams | 6.0 | 3.0 |
| Bottom-Quartile Defensive Teams (+80 Bullpen Innings) | 5.5 | 3.5 |
*Adjusted for total IP
It’s not just that innings get moved from starters to the bullpen. It’s also important to understand which relievers tend to pitch the innings resulting from shorter starts. Needless to say, if the starter gets pulled in the fifth or sixth inning, teams are typically not calling the closer or setup man—arguably a team’s best relief pitchers—to work those innings. These innings are often logged by the very end of the bullpen bench, even though it may be a critical, high-leverage situation, with runners on base in a close game. If we divide a pitching staff into three groups—starting pitchers, the top four relievers, and all other relievers— we can illustrate the point. While the worst defensive teams tend to move about 80 innings from starting pitchers to the bullpen, the innings are redistributed within the bullpen, with the weakest relievers getting more work. (See figure 3.)
Figure 3. Distribution of IP for Best and Worst Defense
| Total Innings | Starting Pitchers | Top 4 Relievers | Other Relievers |
|---|---|---|---|
| Best Defense | 970 | 275 | 195 |
| Worst Defense | 890 | 240 | 310 |
| WORST | -80 | -35 | +115 |
The distribution of a team’s pitching quality can have a large impact on the secondary effect. While poor defensive teams tend to redistribute innings to relievers at the bottom of the bullpen depth chart, a team can, if it has excellent bullpen depth, mitigate the negative secondary effect of poor defense. The 2008 Yankees are a prime example. While they were among baseball’s worst defensive teams, their outstanding bullpen depth meant the innings that got shoved deep into the bullpen were still adequately handled by no-name but effective relievers. Finally, the analysis uncovered a clear synergy between the quality of a team’s defense and the quality of their starting pitching. If we match top-quartile defense with top-quartile starting pitching we see the same tendencies—longer outings by starters and a more favorable allocation of bullpen innings—but to a much greater degree than those measures for all top-quartile defensive teams. The converse is true for teams with the poorest defense and worst starting pitching.
THE MARINERS’ TRANSITION TO A TOP DEFENSIVE TEAM
The Mariners’ transition from a mediocre to a top defensive team began shortly after Zduriencik stepped in as general manager. In a three-team trade in December 2008, he landed the Indians’ Franklin Gutierrez and the Mets’ Endy Chavez—two fly-catchers who are regarded as being among the best in all of baseball. A second key trade occurred on the eve of the trading deadline in late July 2009 as the Mariners picked up shortstop Jack Wilson, a defensive standout, from the Pittsburgh Pirates. Defensive improvements quickly showed on the field and on the stat sheets. According to UZR, the Mariners’ defense went from 21 runs (relative to the MLB average defense) in 2008 to +86 runs in 2009. The improvement of 107 runs saved, due to defense, vaulted the Mariners from the twentieth-best defensive team to the best defensive team in baseball, in just one year. This glovework implies an additional 10 wins in 2009 from defense alone.
Often a roster strategy is most effective when it’s combined with another complementary strategy. In the case of the Mariners, it was their transition to being a team of fly-ball pitchers, after being a more groundball-fly-ball-balanced club in 2008. While their 2008 groundball-fly-ball ratio was 1.25—near the league average— the 2009 pitching staff had the third lowest groundball-fly-ball ratio. What better way to leverage a great corps of fly-chasers in a big ballpark than to load up on fly-ball pitchers. No doubt the two strategies worked in concert. Despite turnover on the pitching staff, including the loss of Jarrod Washburn and Brandon Morrow, the first half of the 2010 season saw a continuation of this strategy as only the San Francisco Giants registered a lower groundball–fly-ball ratio.
Now let’s look beyond the direct runs-allowed (or runs-prevented) value from the baserunners and into the secondary effect of defense—how it affects pitching usage and its translation into runs allowed. The 2009 Mariners saw a pronounced shift in innings through our three pitcher groupings—starting pitchers, top four relievers, and the remainder of the bullpen. Compared to 2008, thirty-nine innings were shifted from starting pitchers to the bullpen. Perhaps more significant were the sixty-four innings that were shifted from depths of the bullpen to the premier arms in the bullpen. (See figure 4.) The top four bullpen arms in 2009 (defined by relief innings pitched)—David Aardsma, Mark Lowe, Miguel Batista, and Sean White—pitched more than 58 percent of Seattle’s relief innings, versus 49 percent by their counterparts in 2008.
Figure 4. Distribution of IP, Mariners, 2008 and 2009
| Total Innings | Starting Pitchers | Top 4 Relievers | “Other” Relievers |
|---|---|---|---|
| 2009 Mariners | 961 | 287 | 205 |
| 2008 Mariners | 905 | 260 | 270 |
| 2009 Mariners* | +56 | +27 | -65 |
*Mariners pitchers had 17 more innings pitched in 2009 than in 2008.
As we discussed earlier, in order for the secondary effect of improved defense to be maximized, several key ingredients need to be present. The ideal formula is high-quality starting pitchers and top relievers combined with a lack of depth in the bullpen. This scenario makes the shift of innings, resulting from improved defense, from the dregs of the bullpen to top relievers and starters even more impactful. Also, the secondary effect tends to be greatest when the improvement in defense is at positions that have the greatest impact on outs—namely, the infield. In the infield, the difference between a great play or a bad play is almost always the difference between an out and a baserunner. In the outfield, great defense will convert some batted balls into outs but will also limit the damage of others, by turning doubles into singles or triples into doubles. As a result, great outfield defense can have a great impact directly on runs allowed but tends to have a proportionately smaller secondary effect. Since a solid portion of the Mariners’ improved defense came in the form of outfield play, and because the difference in quality between Seattle’s best pitchers and least effective pitchers tends to be modest, the secondary effect of their 2009 defensive improvement was worth only about eight runs, or one additional win.
RE-SIGNING JACK WILSON
Wilson arrived in the last year of his contract but had an $8.4-million option for the 2010 season. Recognizing that this price tag was significantly above market, the Mariners and Wilson reached agreement on a deal of $5 million per year for 2010 and 2011. Some will argue that the deal is pricey for a light-hitting, oft injured aging shortstop who could have been cut loose from the Mariners for a mere $600,000 buyout. But those who have a deep appreciation for the true value of defense are more likely to see the virtue of this deal. I’ve developed a model of the behavior of the free-agent market and its “pricing” of free-agent contracts. The model incorporates about 800 transactions over the past six years and includes the player’s age, position, past performance, and even his track record of durability. By plugging each of these factors into the model, we are able to estimate how the free-agent market is likely to “value” any player. Evaluating Wilson at face value—taking his historical performance stats literally—the model prices the shortstop at about $3 million per year. This valuation reflects the reality that teams price a player’s defensive contribution at about only one-third the value of a player’s offensive contribution. However, if we re-price Wilson’s primary contribution—his defense, or runs saved—at the same rate as a player’s offensive contribution, or runs created, his value soars to approximately the $5 million per year doled out by Seattle. For Jack Wilson as well as for a front office that seems to place equal value on offensive and defensive contributions, the Wilson signing may prove to be a winning deal. Wilson’s injuries and missed playing time limited his first-half 2010 contribution, but a two-year deal cannot be judged at the mid-point of year one.
TAKING THE NEXT STEP IN 2010
No doubt the Mariners’ front office would like to see the team’s transformation into a standout defensive ballclub continue in 2010. The free-agent signing of Chone Figgins provides a solid and versatile defender, who can play second or third base. A full year of Jack Wilson will be a welcome sight for Mariners pitchers in 2010, as his attention-grabbing, highlight-film plays not only generate outs but also conserve pitches, potentially allowing starters to go deeper into games. (For an assessment of the Wilson deal, see “Re-signing Jack Wilson” on page 101.) Another way for Seattle to gain more bang for their defensive prowess is to fortify their pitching staff. Teams with strong fielding and strong pitching garner significantly more of the secondary benefits of defense than those with strong defense and mediocre pitching. A good example of this in recent times was the 2005 World Series teams, the Houston Astros and the Chicago White Sox. Both clubs were outstanding defensively and had stellar starting pitching. As a result, they had an astonishingly low amount of relief innings—414 and 401, respectively. The low bullpen usage allowed them to give the ball to their top four relievers often, as they represented a staggering 68 percent and 64 percent of all bullpen innings worked for their teams that year. The acquisition of Cliff Lee prior to the 2010 season was an attempt to bolster their pitching staff. Lee emerged as not only a top pitcher but also one who goes deep into games. With both Lee and Felix Hernandez at the top of the Mariners’ rotation in 2010, they had two pitchers in MLB’s top ten in innings pitched per start. In the case of Lee, he has a good chance of increasing his ranking because of the defense playing behind him.
Entering the 2010 season, the prospects of the Mariners stealing a few extra wins by maximizing the secondary effects of defense was promising. The addition of Cliff Lee to the rotation, along with a full season of Jack Wilson and Chone Figgins, would be expected to shift additional innings to starting pitchers, allowing the reduced bullpen innings to be even more efficiently allocated among the top relief pitchers. The Mariners’ combination of great defense and improved starting pitching should allow their top relievers to work a higher percentage of “meaningful innings”—innings when the game is on the line. It was reasonable to expect the net result of the secondary effect of defense to be worth an additional three wins to the 2010 Mariners. The team’s poor start to the season and the trading of Cliff Lee before the midseason trade deadline may change things in the short run but should not alter the sound, long-term strategy of general manager Jack Zduriencik.
SECONDARY EFFECTS OF DEFENSE ON PITCHING
I analyzed five years, 2004 through 2008, of team-level defense and pitching data to test for the secondary effect of defense on pitching. (I did not use the more commonly referred-to “run value” of defenders, but instead I analyzed the impact of defensive plays on outs, since the hypothesis is predicated on converting batted balls into outs. The “out value” is geared to capturing, for example, a shortstop’s misplay of a groundball that allows a baserunner to reach first, or an outfielder’s catch of a line drive that would have dropped in for a hit, rather than an outfielder’s misplay that turns a would-be double into a triple.) Since the premise is “defense affects pitching usage,” I also analyzed pitching performance as measured by fielding-independent pitching (FIP), looking for contrasts between the best and worst defensive teams. More specifically, I divided pitchers for each team into three categories—starting pitchers, top four relievers, and the remaining relievers. I looked at the innings distribution across the three groups of pitchers within a team, for good and bad defensive teams. Finally, I examined the quality differential of a team’s starters, top four relievers, and remaining relievers, in order to measure how the shift in innings resulting from good or bad defense impacted runs allowed.
It’s not as simple as translating the quality of a team’s defense into the average number of innings pitched by its starting pitchers. Beyond stellar defense, another reason for depth in starting pitching could be that the quality of the starting pitching is high. In order to isolate the impact of defense, I normalized the average innings per starter for the quality of the starting pitching. While the measure is by no means perfect, I was able to home in on the impact of defense on pitching usage. I also had to analyze NL and AL teams separately, since they operate in environments far different from each other. Without a designated hitter, National League teams may abort the benefits of great defense and its conservation of pitch counts because they were trailing in the game and needed a pinch-hitter. This situation is specific to the NL and distorts any interleague comparison of innings per starting pitcher. Curiously, even though defense stands to have a greater impact on pitching usage in the AL than in the NL, it’s in the NL that the best defensive teams are clustered. From 2004 through 2008, 71 percent of the top-quartile defensive teams are in the NL, and 76 percent of the bottom-quartile teams are in the AL.
VINCE GENNARO is a consultant to MLB clubs and the author of “Diamond Dollars: The Economics of Winning in Baseball” (Maple Street Press, 2007). He teaches sports-business management in graduate programs at Columbia University and Manhattanville College. He is executive director of Manhattanville’s Sports Analytic Institute.
Author’s Note
This article is adapted from “The Hidden Value of Glovework,” by Vince Gennaro, in Maple Street Press Mariners Annual 2010, ed. Dave Cameron (Hanover, Mass.: Maple Street Press, 2010), 55–60, and from a presentation given at the SABR national convention, July 2009.
Notes
1 SNY.tv, 6 May 2009.