
The Many Flavors of DIPS: A History and an Overview
This article was written by Michael Davies - Dan Basco
This article was published in Fall 2010 Baseball Research Journal
How much control, if any, does a pitcher have over whether a batted ball in play falls in for a hit? What if something that had traditionally been regarded as the pitcher’s responsibility was simply the residue of luck?
Asking himself these questions,1 Voros McCracken, a paralegal who participated in a Rotisserie league in his spare time, went on to develop the concept of DIPS, defense-independent pitching statistics. Posting to the Usenet group rec.sports.baseball on November 18, 1999, almost eleven years ago to the day we are writing this, he described the “pitching evaluation tool” he was kicking around in his head and asked for some feedback. “I call it ‘Defensive Independent Pitching’ and what it does is evaluate a pitcher base[d] strictly on the statistics his defense has no ability to affect.”2
EARLY PITCHING STATISTICS
The early history of pitching and pitching statistics has been told often. Alan Schwarz in The Numbers Game does the job well.3 Originally, the pitcher’s job was to serve the ball over the plate so the batter could hit it. The idea that his job was to make the ball hard to hit was slow to take hold. In his biographical article on Jim Creighton, “the greatest pitcher of his day,” John Thorn notes that
the 1850s did produce some pitchers who tried to deceive batters with “headwork”—which meant changing arcs and speeds, and sometimes bowling wide ones until the frustrated batter lunged at a pitch. (The latter tactic produced such incredible, documented pitch totals as that in the second Atlantic–Excelsior game of 1860, when the Atlantics’ Matty O’Brien threw 325 pitches in nine innings, Creighton 280 in seven.) On balance, however, the pioneer pitcher and batter were collaborators in putting the ball in play rather than the mortal adversaries they have been ever since. Creighton added an illegal but imperceptible wrist snap to his swooping low release.4
In 1912, when the practice of pulling starting pitchers had begun to grow more common, John Heydler, National League president, dropped “earned runs per game” in favor of a new statistic, “earned-run average,” which joined G, IP, W, L, win percentage, SO, BB, and H in the list of pitching stats that, a century later, are still the most familiar and mainstream, the ones most likely to appear next to a pitcher’s name on the scoreboard.
WINS, LOSSES, AND ERA QUESTIONED
When wins, losses, and ERA became the primary measuring stick for pitchers, observers started to notice how much variation from year to year there was in the top-ten lists in wins and ERA.
As early as 1944, Ted Oliver, in his self-published Kings of the Mound: A Pitcher’s Rating Manual, described a formula, Weighted Pitcher’s Rating, used to assess the pitcher’s wins and losses relative to his team’s wins and losses.5
In the late 1970s, Bill James started tracking pitcher run support.
In 1992, Michael Wolverton, a Stanford computer-science graduate, developed SNWL, support-neutral won–lost. SNWL assigns to a pitcher a number, a fraction of a win or a loss, that’s calculated from his innings pitched and runs allowed. Around this time, in the 1990s, Keith Woolner, then a software developer with Oracle, invented Composite Opponent Pitcher rating, which tracked a pitcher’s “strength of schedule,” or the difficulty of his opponents.6
But none of these metrics addressed the real issue involved in the effort to evaluate pitchers solely on their wins and losses. The outcome of the game is the product of runs scored as well as of runs prevented. Let’s assume that 50 percent of a game’s outcome is run prevention. How much of that is the pitcher’s responsibility?
Doesn’t ERA solve all the problems that this question poses? Not entirely. Here’s Michael Wolverton, writing at Baseball Prospectus, on the limitations of ERA:7
I’ve done it! I’ve solved the problem of removing the corrupting influence of fielding on pitchers’ runs allowed. We simply pay a sportswriter to sit in the press box, munch Cheetos, and decide which safeties would have been outs with normal fielding effort. Whenever one of these “errors” occurs, we reconstruct the inning—not the game, mind you, just the inning—pretending as if the error never happened. Count up the runs that would have scored in this hypothetical reconstructed inning, and you have a revised run total for the pitcher. Things get a lot more complicated for relievers and team totals, and we’ll broaden the ‘plays that should have been made’ definition a little bit, but you get the idea.
The problem is that the distinction between an earned run and an unearned run is based on errors and passed balls, which are largely subjective decisions made by official scorers. Moreover, if an error is made when there are two outs and then the pitcher goes on to put runners on base and give up runs, all the runs are counted as unearned. Then there are routine double plays not turned and missed plays that an average fielder might have made but that aren’t scored as errors—even though the fielders are at fault, all the runs the fielders give up are charged to the pitcher. Consider also that, after a pitcher has left a game, his ERA will still rise if a reliever allows the inherited runners to score, while the reliever’s ERA remains unscathed.
OTHER STATISTICS
In the original Rotisserie league of the 1980s, batters were tracked for batting average, home runs, RBIs, and stolen bases. Pitchers were tracked by wins, ERA, saves, and—the innovation of Dan Okrent, the godfather of fantasy baseball—a baserunners-allowed ratio, which we now know as WHIP (walks plus hits per inning pitched).8
Component ERA (ERC) was invented by Bill James and introduced in 2000 in Stats All-Time Major League Handbook.9 To get ERC, first you have to calculate a Pitcher’s Total Base Estimate (PTB), which reflects a pitcher’s hits allowed, home runs allowed, unintentional walks, and hit batsmen. The PTB is then figured into a formula that includes walks, hits, hit batsmen, batters faced, and innings pitched.10
WHIP and ERC for individual pitchers are more consistent—they vary less from year to year—than do ERA or winning percentage but still have built into them the assumption that hits are entirely the pitcher’s responsibility.
VOROS McCRACKEN
Voros McCracken joined a Rotisserie league in 1999 and began following sabermetric websites, where it was generally recognized that ERA was not a pure measure of pitching but reflected to some extent the fielding behind the pitcher. McCracken was frustrated that sabermetricians mostly threw up their hands at the prospect of trying to distinguish pitching effectiveness from fielding. “This seemed like a stupid approach to the problem, to give up,” McCracken said, and he set out to solve the problem logically.
He divided pitching stats into two categories: events (singles, doubles, triples, sacrifice flies, groundball and fly-ball outs) that the defense behind him contributed to and those events (strikeouts, walks, home runs, hit by pitches) that it did not. Using Excel software and applying some of what he learned in a statistics course at Butler, he went to work analyzing the data.11
Stripping the pitcher’s performance down into its component parts—strikeouts, walks, home runs, and hits—McCracken discovered that there was a high year-to-year correlation between a pitcher’s strikeout rates (r = 0.792) and walk rates (r = 0.681), medium correlation for home-run rates (r = 0.505), and very low correlation (r = 0.153) in BABIP (batting average on balls in play). (McCracken was using the symbol $H instead of BABIP; what we now call BABIP has been known as HPBP [hits per ball in play] and in-play average [IPAvg] as well as $H. In this article we will use the acronym BABIP.)
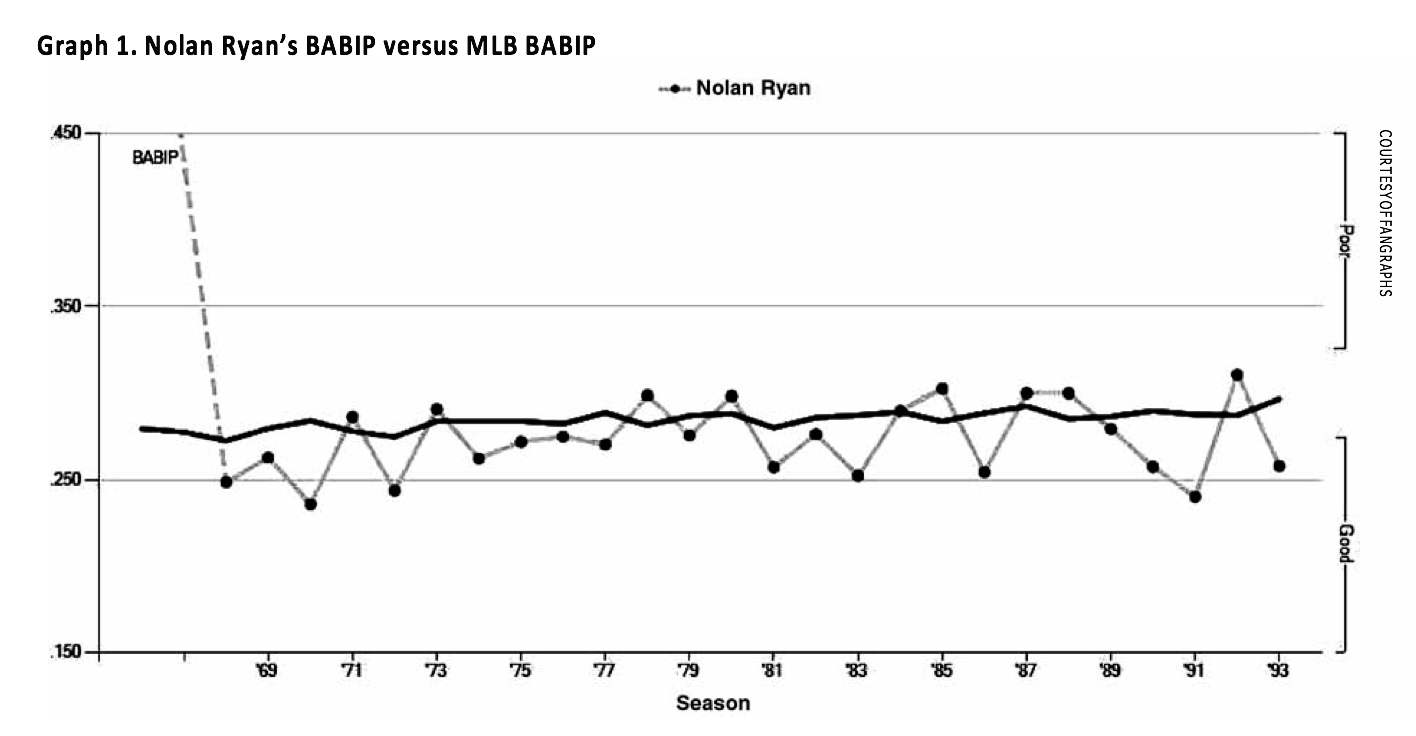
Individual pitchers might jump from top to bottom of the league in BABIP in consecutive years, or from bottom to top. The graph below illustrates the volatility of BABIP for individual pitchers. While for the whole league BABIP remained close to constant, rising and falling only gently over the course of Nolan Ryan’s career, his personal BABIP was constantly spiking and plummeting. On the whole, his BABIP was below league average—some years, dramatically below it—but in eight different seasons, distributed widely across his 27-year MLB career, he was either at or above (though, when above, usually only slightly) the league average.
Graph 1. Nolan Ryan’s BABIP versus MLB BABIP
The seasons McCracken looked at specifically for pitcher performance were 1998 and 1999. In broad terms: McCracken’s DIPS calculations were designed to determine what a pitcher’s stats would have been if he pitched in an average ballpark with an average defense and, most important, had average luck when it came to balls in play.12 The original formulas McCracken used for balls kept out of play and hits per ball in play were
- Balls kept out of play = (HR + BB + HBP + SO) / TBF
- Hits per ball in play = (H – HR) / (Outs + H – SO – HR)
He found the pitcher had control over the balls kept out of play but not over the hits per ball in play.13 He concluded that “you can better predict a pitcher’s hits per balls in play from the rate of the rest of the pitcher’s team than from the pitcher’s own rate,” which suggests that the hits surrendered by a pitcher may be more a reflection of team defense and park than of pitching ability.14
McCracken posted his query on this subject to the Usenet group in 1999 and fourteen months later, in January 2001, found a receptive audience for his article “Pitchers and Defense: How Much Control Do Hurlers Have?” which was posted online at Baseball Prospectus.15 Shortly thereafter, Rob Neyer of ESPN briefly discussed it.16 According to McCracken, “All hell broke loose,” as he received 1,700 e-mails in two days,17 from sabermetricians who took varying degrees of exception to McCracken’s assertion that “there is little if any difference among major league pitchers in their ability to prevent hits on balls in play.”18 Craig R. Wright and Bill James wrote in to Neyer with reservations about McCracken’s theory,19 beginning the long and ongoing discussion within the sabermetric community over whether pitchers have control over hits on balls in play and, if they do, how much. James changed his mind after further research. From the 2001 edition of The New Bill James Historical Abstract:
- Like most things, McCracken’s argument can be taken too literally. A pitcher does have some input into the hits/innings ratio behind him, other than that which is reflected in the homerun and strikeout column.
- With that qualification, I am quite certain that McCracken is correct.
- This knowledge is significant, very useful.
- I feel stupid for not having realized it 30 years ago. 20
McCracken’s work caught the attention of Paul DePodesta, assistant general manager of the Oakland A’s. After reading the article, “the first thing I thought of,” he said, “was Chad Bradford.” Bradford, a submarinestyle right-handed pitcher, was posting ERAs below
- for the AAA affiliate for the Chicago White His unorthodox delivery led traditional scouts to believe he was never going to be an effective bigleague pitcher. Bradford’s walk rate, strikeout rate, and home runs allowed made his statistics look even better than his microscopic ERAs. General manager Billy Beane pulled off a steal of a trade to acquire Bradford, who would become one of the most dominant setup men for the A’s in the period 2001–4.21
Meanwhile, McCracken, who finished in first place in his fantasy league for three years, was sifting through his inbox in August 2002 when he noticed a message from the Boston Red Sox. “Would you be interested in working for us?”22
STUDIES PROVING McCRACKEN WRONG
McCracken’s work got people thinking about pitching performance with fielding factored out. The thinking manifested itself in forms ranging from insults directed at McCracken’s work and sanity to thoughtful and thorough research by those looking to prove or disprove his idea. The two leading responses to McCracken’s work came in July 2003 from Tom Tippett at Diamond Mind Baseball and in February 2004 from Mitchel Lichtman at Baseball Think Factory.
Part of what most made Tom Tippett’s work compelling was that he drew his data from a much longer period, 1913 through 2002, than did McCracken, who initially looked at only two seasons, 1998 and 1999. Tippett drew three main conclusions.
- Pitchers do influence BABIP.
- A pitcher shows statistically significant BABIP consistency across the length of his career.
- Small influence over BABIP (much smaller than influence over strikeouts and walks) is still significant because such a large percentage of balls are put into play.
Tippett observed that McCracken may have been misled by the bad BABIP numbers that Greg Maddux, Randy Johnson, and Pedro Martinez had in the 1999 season. Most seasons they posted BABIP numbers lower (better) than the league average. Also of note: Six of the top 35 pitchers in career BABIP were knuckleballers (Charlie Hough was the best overall), and soft-tossing lefties like Jamie Moyer had low BABIPs despite low strikeout rates. (In Moyer’s case, he made up for the low strikeout rate with an exceptionally low walk rate.) Successful pitchers with low strikeout rates and high BABIPs—Tommy John is an example—led Tippett to suggest further research on the ability of pitchers to induce double-play groundballs.23
Mitchel Lichtman’s sample was from the twelve-year period 1992–2003. In his article on DIPS at Baseball Think Factory, he analyzed different kinds of BIP (balls in play) and defined six categories:
- infield line drives
- outfield line drives
- infield pop flies
- outfield pop flies
- outfield fly balls
- non-bunt groundballs
He calculated the percentage of BIP that each of these categories represented, the BABIP for each category, and the year-to-year correlations for each of those. Lichtman found that, while McCracken was correct in that a pitcher does not have much control over his overall BABIP, he does have considerable control over individual components such as groundball and fly-ball rates. Additionally, he found that park factor and defense exert considerable influence over year-to-year correlations.24
Further work by various writers at Baseball Prospectus led to additional conclusions:25
- Major league pitchers have a better BABIP than minor league pitchers who never made it to the big leagues.
- The ability to induce infield pop-ups is a repeatable skill by major league pitchers.
- Pitchers have considerable control over whether the ball is hit on the ground or in the air. Groundballs are significantly less likely to go for extra-base hits but do go through more often for singles.
- Pitchers have less control (as opposed to no control) over hits than over walks, strikeouts, and home runs.
- Run average (RA), simply RA = R/IP * 9, has a greater yearto-year correlation than ERA.
Additionally, Erik Allen, Arvin Hsu, and Tom Tango used regression analysis to break down the responsibility of what determines the outcome of a batted ball:26
- Luck, 44 percent
- Pitcher, 28 percent
- Fielding, 17 percent
- Park, 11 percent
Tom Tango further elaborated this on his website, where he discussed the concept of DRS, the defensive responsibility spectrum, which lists the categories of recorded events in a baseball game.27 The events on the far left are 100 percent the responsibility of the pitcher. Events on the far right are 100 percent the responsibility of the fielders. Everything else is listed in between.
Defensive Responsibility Spectrum
HBP, balk, pickoff, SO, BB, HR, WP, SB, CS, 2B, 3B, 1B, batting outs, PB, running outs
Bill James too has begun to look at pitching in a new light. At one time he was resigned to thinking that the predictability of pitching performance was low. In
The Bill James Handbook 2010, his revised view of the matter involves the difference between what he calls elemental stats and summary stats. Elemental stats for pitchers include strikeouts, innings, and walks. These are the components that make up summary stats such as ERA. Because it’s complex, reflecting several elemental stats as well as fielding and park factor, ERA is, like a pitcher’s won–lost record, hard to predict. Accurate prediction of a pitcher’s elemental stats increases the accuracy of his predicted summary stats.28 The Hardball Times has run several studies using batted-ball data from Baseball Info Solutions. Several important conclusions were drawn by David Gassko in “Do Players Control Batted Balls? (Part Two)” in The Hardball Times 2007 Annual. Gassko concluded that pitchers show some consistency, though not much, in home runs allowed per outfield fly ball allowed. THT studies suggested that outfield fly balls allowed are more consistent year to year than are home runs allowed per outfield fly balls allowed.29
NEW METRICS
Since McCracken’s article in 2001, many metrics have been developed in an effort to better evaluate a pitcher’s performance and to project his future performance. How is an earned run truly “earned” against a pitcher? The thought process of sabermetricians on this subject had changed. Runs, Dayn Perry explains, “are more like molecules than atoms. They’re compounds made up of singles, doubles, triples, home runs, walks, errors, stolen bases, baserunning, sacrifices, balks, hit batsmen, strikes, balls, fouls into the stands, and so on. To evaluate how a pitcher is doing his job, we need to focus on how well he masters the game at an atomic level.”30
Defense-independent pitching statistics can be divided into two basic categories: those that use only what are widely considered to be entirely defenseindependent statistics (strikeouts, walks, hit batters, balks) and those that include batted-ball data (groundball and fly-ball rates, and so on.). The second group claims a preponderance of the newer metrics, because sabermetricians increasingly agree that pitchers have some control over BABIP, although how much is still a point of contention.
Batted-Ball Data Not Required
McCracken’s DIPS formulas and FIP (fieldingindependent pitching), a stat based on Bill James’s Component ERA, are the only widely used DIPS statistics that do not require batted-ball data (groundballs, fly balls, and line drives).
McCracken’s DIPS ERA (Version 1.0). The only individualplayer stats that McCracken used to calculate DIPS ERA were batters faced, home runs, walks, intentional walks, strikeouts, and hit batsmen. His methodology for arriving at DIPS ERA was long and complicated. He took the raw total of walks and divided it by BFP – HBP – IBB to get a new walk total. He took the strikeouts and divided them by BFP – HBP – BB. The home-run total was divided by BFP – HBP – TBB – SO. McCracken then used park factor and league (American or National) adjustments to arrive at new (DIPS) walk, strikeout, and home-run totals. He used league average rates for singles, doubles, triples, and innings pitched. Again, McCracken assumes that the pitcher had average luck, pitched in an average park, and had an average defense. Using Jim Furtado’s Extrapolated Runs formula shown below, which applies certain values to specific events, a number of expected runs (XR) is calculated from the adjusted values for 1B, 2B, 3B, HR, TBB, HBP, and total hits and from the unchanged values for batters faced:
(1B * .50) + (2B * .72) + (3B * 1.04) + (HR * 1.44) + ((TBB + HBP) * .33) – ((BFP – H – TBB – HBP) * .098)
This XR total is multiplied by 0.9297 (because, in McCracken’s data, 92.97 percent of all runs were earned) to obtain DIPS ER. Like the standard ERA formula, DIPS ER is divided by the DIPS IP and multiplied by 9 to obtain ERA—in this case, DIPS ERA.31
DIPS ERA, Version 2.0. In January 2002, Hardball Times ran McCracken’s article “DIPS Version 2.0.”32 He made some improvements to his original formula, slightly simplifying it and accounting for the small differences he found in pitcher BABIP among specific groups of pitchers: knuckleballers and left-handers. The revised formula required the same elemental stats—batters faced, home runs, walks, intentional walks, strikeouts, and hit batsmen. It also required park factors but not league averages; McCracken simply took the league-average values and replaced them with constants. In addition to adjusting for strikeouts and home runs, he made BABIP adjustments for knuckleball pitchers and left-handers—he discovered that knuckleball pitchers had a lower BABIP by .010 and that the average BABIP of left-handed pitchers was lower than that of right-handers by .002.33 The difference in pitcher handedness was statistically significant, but McCracken was not sure why it was important.34 He used a different formula to arrive at DIPS ER (dER), dropping the XR formula entirely and creating his own new formula:35
dER = (dH – dHR) * .49674 + dHR * 1.294375 + (dBB – dIBB) * .3325 + dIBB * .0864336 + dSO * (– .084691) + dHP * .3077 + (BFP – dHP – dBB – dSO – dH) * (– .082927)
DIPS 2.0 is the main McCracken formula that is still used to compare the effectiveness of DIPS against other pitching metrics that will be discussed later in this article. The formula is still posted on ESPN.com, without the adjustments for parks, knuckleball pitchers, and lefthanded pitchers.36 McCracken also investigated the ratio of groundballs to fly balls, worried that the distinction between a fly ball and a line drive is imprecise and subjective, and expressed the hope that more data on batted-ball types would become readily available.37
DICE (Defense-Independent Component ERA) and FieldingIndependent Pitching (FIP). After DIPS ERA, the first improvement on ERA in the defense-independent direction was DICE, or defense-independent component ERA, introduced by Clay Dreslough at Baseball Mogul in 2000. It was based on Bill James’s ERC (component ERA) but was modified to leave out hits. The formula
3 + (3 * (BB + HBP) + 13 * HR – 2 * K) / IP
was designed for ease of use and at the time was one of the best predictors of next-year performance available.38 For whatever reason, this formula never caught on and would be reintroduced a couple of years later.
Currently, the most widely used metric that involves exclusively defense-independent statistics is FIP, fielding-independent pitching. Popularized by Tom Tango, FIP is similar to DICE but has taken hold in the sabermetric community and is more widely used.39 Formulas for FIP vary slightly. The version
C + (13 * HR + 3 * BB – 2 * K) / IP
is common. (Sometimes HBP are added to walks, and sometimes intentional walks are subtracted from walks.) The constant C, usually in the vicinity of 3.20, is used to adjust FIP to the league average ERA, making the final number more recognizable and accessible at a glance. In some cases, the constant is adjusted differently; for instance, at some websites the constant is higher for AL pitchers than for NL pitchers, since AL pitchers, who face designated hitters, typically have higher ERAs. Some versions of FIP are scaled in context with RA as opposed to ERA.
Batted-Ball Data Required
Batted-ball type has been found to have even more predictive value than FIP. Further research has suggested that, although a pitcher has significant control over walks, hit batsmen, and strikeouts, his control over home runs is more volatile and is highly influenced by his home-park factor.
tRA. Like DIPS ERA, tRA requires not just one single formula but a lengthy step-by-step process. Created by Matthew Carruth and Graham MacAree at StatCorner.com, tRA involves every action a pitcher is responsible for—groundballs, popups, outfield fly balls, line drives, home runs, strikeouts, walks, and hit by pitches. The idea is that, for every one of these events, there is an expected-out value and an expected-run value. Here are expected-run and expected-out values for 2008:41
Table 1
| Event | Out value | Run value | |
|---|---|---|---|
| Strikeout | 1.000 | –0.105 | |
| Walk | 0.000 | 0.329 | |
| Hit by pitch | 0.000 | 0.345 | |
| Line drive | 0.305 | 0.384 | |
| Groundball | 0.812 | 0.053 | |
| Outfield fly ball | 0.830 | 0.046 | |
| Infield fly ball | 0.985 | –0.096 | |
| Home run | 0.000 | 1.394 |
What do the numbers in table 1 mean? The out value is the probability of an out occurring in a given situation. On a walk, hit by pitch, or home run, the out value is zero because an out never occurs. On a strikeout, the out value is 1, because a strikeout always results in an out (except in those rare cases when the runner takes first when strike three is a passed ball). Obviously, the probability of getting out on an infield fly ball is high, and the batted ball that it’s hardest to make an out on is the line drive.
The run value is based on the run expectancy matrix, or 24-states matrix. The run expectancy matrix is a chart, 8-by-3, that shows the expected (average) number of runs that are scored in an inning during a given state (e.g., runners on first and second, one out). The given state is made up of two parts: the number of outs, and which bases are occupied.42
Table 2
| Runners | Run value 0 out | Run value 1 out | Run value 2 outs |
|---|---|---|---|
| None on | 0.555 | 0.297 | 0.117 |
| First base | 0.953 | 0.573 | 0.251 |
| Second base | 1.189 | 0.725 | 0.344 |
| Third base | 1.482 | 0.983 | 0.387 |
| First and second | 1.573 | 0.971 | 0.466 |
| First and third | 1.904 | 1.243 | 0.538 |
| Second and third | 2.052 | 1.467 | 0.634 |
| Bases loaded | 2.417 | 1.650 | 0.815 |
After this matrix is generated, the difference in runs can be applied using this formula:
play_run_value = runs_scored + (run_expectancy_ after – run_expectancy_before)
The run value in the chart would be plugged in for “play_run_value” in the formula. Strikeouts and infield fly balls actually have a negative run value, since they decrease a team’s chances of scoring. Conversely, home runs have an expected run value greater than 1, not only because a home run will drive in any runners on base but also because, even on a solo home run, it is still possible that more runs can score in the inning, as the batter who hit the home run didn’t make an out. After park factors are applied, each of these numbers will be multiplied by the pitcher’s individual frequencies of each statistic in table 1 (strikeouts, walks, hit by pitch, line drives, groundballs, outfield fly balls, infield fly balls, home runs) and by the number of total batters he faced, and the result will be expected runs (in a neutral park with an average defense). From the outs table above, his expected outs can also be determined. These two numbers are then entered into the following formula to get tRA:43
tRA = expected_runs / expected_outs * 27
The tRA stat is by far the most complicated pitching stat to compute. It requires examination of playby-play data for every single player and constant assessment of the 24-states matrix. Its value should not be ignored, however, as an in-season prediction tool, as tRA has proven to help predict ERA in-season. In its classical form, the tRA value is keyed to the runsallowed scale, although it is often converted to the ERA scale.44
LIPS, Luck-Independent Pitching Statistics. David Gassko in 2005 introduced LIPS, or luck-independent pitching statistics, as DIPS 3.0. Year to year, LIPS correlates better with ERA than FIP does. Gassko uses walks, strikeouts, hit batsmen, infield flies, outfield flies, and ground balls, as opposed to McCracken’s walks, strikeouts, hit batsmen, and home runs.45
Since then, Gassko has refined the metric in an effort to make it entirely independent of defense, park, and luck. He replaces a pitcher’s line-drive rate (known to be random) with the league-average linedrive rate and adjusts the pitcher’s other batted-ball rates (known to be consistent for an individual pitcher) accordingly. These transformed batted-ball rates get multiplied by the league-average outcome rates for each possible outcome (single, double, etc.). “If an average NL pitcher allows 0.21 singles per ground ball,” Gassko writes, “we calculate that [a pitcher who is expected to give up 42 groundballs] will allow 0.21*42 = 8.8 ground ball singles.” This process is repeated for each batted-ball type and each pitching outcome to fill a complete line of result-based statistics (single, double, triple, home run, base on error).
All these numbers, along with strikeouts, walks, and hit by pitches, get park-adjusted, and the resulting values get inputted into David Smyth’s BaseRuns formula,46 outputting an expected runs-allowed value. This number is then adjusted back to the original biased park factors in order to have the final number represent the pitcher’s luck-independent ERA at his own park. Finally, Gassko uses groundball rates to estimate unearned runs, subtracting those from total LIPS runs allowed to give a true ERA.47
QERA, QuikERA. QERA, or QuikERA, was developed by Nate Silver, the inventor of the PECOTA preseason projections, at Baseball Prospectus in 2006. The formula
(2.69 – .66 * (GB / BIP) + 3.88 * (BB / PA) – 3.4 * (K / PA)) ^ 2
was designed to account for interdependent relationships between a pitcher’s groundball rate, walk rate, and strikeout rate. QuikERA, according to Silver,
estimates what a pitcher’s ERA should be based solely on his strikeout rate, walk rate, and GB/FB ratio. These three components—K rate, BB rate, GB/FB—stabilize very quickly, and they have the strongest predictive relationship with a pitcher’s ERA going forward. What’s more, they are not very dependent on park effects, allowing us to make reasonable comparisons of pitchers across different teams note that everything ends up expressed in terms of percentages: strikeouts per opponent plate appearance, walks per opponent plate appearance, and groundballs as a percentage of all balls hit into play.48
The intent of this formula was to adjust for the issues prevalent in FIP and xFIP. Another important feature of this formula is that it takes the ratio of walks and strikeouts per plate appearance instead of per inning. Why is this important? Think about it this way. The number of innings a pitcher pitches is equal to the number of outs times three. The innings a pitcher pitches might be longer innings because of poor defense. QERA allows us to see a pitcher’s true rates of strikeouts and walks. McCracken understood this as well, but Silver, with QERA, spells out this concept more clearly than he did.
SIERA, Skill Interactive ERA. In a five-part series at Baseball Prospectus in February 2010, Matt Swartz and Eric Seidman introduced SIERA as an improvement over QERA. The formula for SIERA is
6.145 – 16.986 * (SO / PA) + 11.434 * (BB / PA) – 1.858 * ((GB – FB – PU) / PA) + 7.653 * ((SO / PA) ^ 2) +/– 6.664 * (((GB – FB – PU) / PA) ^ 2) + 10.130 * (SO/PA) * ((GB – FB – PU) / PA) – 5.195 * (BB / PA) * ((GB – FB – PU) / PA), where +/– is a negative sign when (GB – FB – PU) / PA is positive, and where +/– is a positive sign when (GB – FB – PU) / PA is negative.49
Why such a long formula? When they algebraically factored out all of the individual components of Silver’s QERA formula and analyzed the effect of each component, Swartz and Seidman discovered that, while there is an interdependent relationship between strikeout and groundball rates and between walk and groundball rates, there is no real interdependency between walks and strikeouts. They also changed all instances of GB/BIP to (GB – FB – PU) / PA, since GB/BIP was not considered a repeatable pitcher skill. When doing regression analysis to predict the next season’s ERA, they found that SIERA predicted the next season’s park-adjusted ERA better than did QERA, tRA, FIP, xFIP, or ERA. However, SIERA was not as strong as FIP or tRA at predicting in-season ERA changes, but it did better than QERA or xFIP. Also, the adjustments in SIERA proved to be much better estimates for some pitchers with extremely high rates of groundballs to total balls in play, such as Brandon Webb and Joel Pineiro, and for pitchers, such as Johan Santana, who strike out a lot of batters.50
LIMITATIONS
The biggest issue with DIPS statistics is the subjectivity in the batted-ball data. This is also a problem with some of the defensive metrics, such as UZR and Defensive Runs Saved, that rely on batted-ball metrics from either MLBAM or Baseball Info Solutions (BIS). What is the issue?
As Colin Wyers pointed out on Hardball Times and Baseball Prospectus, for the scorers who from their seats in the press box chart batted-ball data, he found “a modest correlation between the height of the press box and the line-drive rate reported.” This leads to some discrepancies, as Baseball Prospectus and Retrosheet use Gameday/MLBAM data, and FanGraphs uses BIS data. As of now, it is difficult to objectively define the difference between a fly ball and line drive or even between either of those and what BIS designates as “fliners.”51 BIS has tried to minimize the bias by randomly assigning their video scouts to different parks. At least two video scouts view the same ball. In 2009, they improved on their accuracy on all balls in play by adding objective batted-ball timer data, which is a measure of the interval between the time the ball leaves the bat and when it lands on the ground or in a fielder’s glove. The time intervals help the analyst make the distinctions between a fly ball, a fliner, and a line drive more objective.52
USES OF DIPS
The most widespread use of DIPS today is in the fantasy-league community, where in articles on sites such as FanGraphs.com pitchers are analyzed in terms of FIP, xFIP, and tRA more often than in terms of the more conventional metrics—ERA, wins, WHIP, and so on. DIPS tend to give fantasy-leaguers an edge over their competitors.
DIPS have caught on with some MLB players, including Zack Greinke and Brian Bannister of the Kansas City Royals. “My favorite [stat],” Greinke says, “besides facing individual batters, is FIP, which is kind of like walks to strikeouts and home runs given up. So I try to get ahead of the count without leaving it run down the middle in a person’s power zone, get ahead in the count. That helps me not walk guys, and then, when I get two strikes, I try to strike guys out. And that’s how I try to pitch, to keep my FIP as low as possible.”53
Bannister knew that his BABIP of .264 in 2007 was unusually low. “It’s tough,” he said,
because I’m a student of it, and all last year [2007] I was well aware I was among the league leaders in it. But what do you do? Just because you’re continuing to get outs, do you say, ‘Oh, this shouldn’t be happening’? I realize very well that I could regress to the mean One thing sabermetrics and statistics have allowed me to do is relax. I know the odds. I know percentages. I know that three out of every 10 batted balls should go for hits, and I deal with it. It’s helped me be a better player.54
ANALYSIS
DIPS are designed to separate out defense and, more important, luck from measures of pitching performance. Beyond the obvious, “luck” includes timing and the order of events in an inning. For example, if a pitcher’s results in one inning occur in this order— walk, strikeout, groundout, home run, strikeout—his runs allowed in the inning are different from an inning where the order is home run, strikeout, walk, strikeout, groundout. Even though the pitcher tallied the same results, the sequence changes his runs allowed from two in the first case to one in the second.55
Some of these metrics are simple and so userfriendly, like FIP and xFIP, which require only a few numbers and no park adjustments. QERA and SIERA are slightly more complicated but easy enough to calculate with a formula on an Excel sheet (and then making a park adjustment at the end for SIERA). Other metrics are more involved.
Some metrics paint a clearer picture of what is truly happening within a season, such as FIP, xFIP, and tRA. These are widely accepted for forecasting future ERA within a season and are frequently used by writers at such sites as Hardball Times and FanGraphs. LIPS and SIERA are more useful for preseason player predictions, for forecasting ERA for the upcoming season.
When McCracken released DIPS 2.0, he was “hoping this is the beginning of a discussion and not the end of it.”56 His most important achievement to the sabermetric community was to get fans and front offices to think differently about how to separate pitching from defense. It was not that he had a PhD in mathematics and could perform complex statistical analysis or that he was smarter than everyone else in the sabermetric community. It was that he calmly sought to answer a question that was important but deemed unanswerable. For what he was trying to do (gain an edge in his fantasy baseball league), he didn’t feel it was worthwhile to come up with another metric to reevaluate pitcher won–lost record. In the process, he surprised even himself by discovering the lack of year-to-year correlation in hits. ”I did everything,” he wrote, “within my power to come to a different conclusion than the one I did.”57
We don’t know what dimension of the game will be significantly elucidated by innovative statistical analysis next. Defense? Baserunning? Relief pitching? Clutch hitting? Who will discover it? Somebody trying to answer an “unanswerable” question, crunching numbers and perusing the likes of Hardball Times, FanGraphs, Baseball Prospectus, and, yes, even The Baseball Research Journal, looking to build on whatever work has already been done.
DAN BASCO is a graduate student and teaching assistant in the statistics department at the University of Akron.
MICHAEL DAVIES is a student at Sidwell Friends School in Washington, D.C.
Notes
- Michael Lewis, Moneyball (New York: Norton, 2003), 237–38.
- Alan Schwarz, The Numbers Game: Baseball’s Lifelong Fascination with Statistics (New York: Thomas Dunne Books, 2004), 201–11; sports.baseball, 18 November 1999, http://groups.google.com/group/rec.sport.baseball.analysis/msg/b450fe58c05a5a82
- Schwarz, The Numbers Game, 14–18, 25–31.
- John Thorn, “Jim Creighton,” Baseball Biography Project, http://bioproj.sabr.org/.
- Gabriel Costa, Michael R. Huber, and John T. Saccoman, Practicing Sabermetrics: Putting the Science of Baseball Statistics to Work (Jefferson, N.C.: McFarland, 2009), 101–2.
- Schwarz, The Numbers Game, 174-76.
- Jonah Keri, , Baseball Between the Numbers: Why Everything You Know About the Game is Wrong (New York: Basic Books, 2006), 88.
- Schwarz, The Numbers Game, 174–76.
- Bill James, Don Zminda, and Neil Munro, Stats All-Time Major League Handbook (Skokie, : STATS Publishing, 2000).
- Baseball Info Solutions and Bill James, Bill James Handbook 2010 (Skokie, Ill.: ACTA Sports, 2009), 498.
- Schwarz, The Numbers Game, 210–11.
- Voros McCracken, “Defense Independent Pitching Stats,” futilityinfielder.com/dips.html.
- Schwarz, The Numbers Game, 211–12.
- Voros McCracken, “Pitching and Defense: How Much Control Do Hurlers Have?” 23 January 2001, baseballprospectus.com/article.php? articleid=878.
- Ibid.
- Rob Neyer, ESPN.com, 31 January 2001, http://a.espncdn.com/mlb/s/2001/0115/1017090.html.
- Schwarz, The Numbers Game, 213.
- McCracken, “Pitching and Defense: How Much Control Do Hurlers Have?”
- Neyer, com, 31 January 2001.
- Quoted by Lewis in Moneyball, 239–40.
- Ibid., 241–43.
- Schwarz, The Numbers Game, 213.
- Tom “Can Pitchers Prevent Hits on Balls in Play?” 21 July 2003, Diamond Mind, http://www.diamond-mind.com/.
- Mitchel Lichtman, “DIPS Revisited,” 29 February 2004, Baseball Think Factory.
- Keri, ed., Baseball Between the Numbers, 57, 91–94.
- Ibid., 92.
- Tom Tango, “Defensive Responsibility Spectrum (DRS): Breaking Up the Fielders from the Pitchers,” http://www.tangotiger.net/drspectrum.html.
- Baseball Info Solutions and Bill James, The Bill James Handbook, 2010, 477–83.
- David Gassko, “Do Players Control Batted Balls? (Part Two),” The Hardball Times Baseball Annual, 2007 (Skokie, : ACTA Sports, 2006), 158–60.
- Dayn Perry, “When Does a Pitcher Earn an Earned Run,” in Baseball Between the Numbers, Jonah Keri (New York: Basic Books, 2007), 90.
- McCracken, “Defense Independent Pitching.”
- Voros McCracken, “DIPS Version 0,” Baseball Think Factory, 25 January 2002.
- Voros McCracken, “Defense Independent Pitching Stats, Version 0 Formula,” 17 January 2002, Baseball Think Factory.
- McCracken, “DIPS Version 0.”
- McCracken, “Defense Independent Pitching Stats, Version 0 Formula.”
- MLB Statistics Glossary, 1 June 2007, ESPN.com.
- McCracken, “Defense Independent Pitching Stats, Version 0 Formula.”
- “DICE: A new pitching Defense Independent Component ERA,” 19 July 2000, http://www.sportsmogul.com/content/dice.htm.
- Tom Tango, “Defensive Responsibility Spectrum (DRS): Breaking Up the Fielders from the Pitchers,” http://www.tangotiger.net/drspectrum.html.
- Dave Studeman, “I’m Batty for Baseball Stats,” 10 May 2005, Hardball Times.
- Graham MacAree, StatCorner—About tRA, 2009, http://www.statcorner.com/tRAabout.html.
- Tom Tango, Mitchel G. Lichtman, and Andrew E. Dolphin, The Book: Playing the Percentages in Baseball (Washington, D.C.: Potomac Books, 2007), 19.
- MacAree, StatCorner—About tRA.”
- Matt Swartz and Eric Seidman, “Introducing SIERA, Part 4,” 11 February 2010, Baseball Prospectus.
- David Gassko, “Batted Balls and DIPS,” 30 August 2005, Hardball Times.
- Brandon Heipp, “A Promising New Run Estimator: Base Runs,” http://gosu02.tripod.com/id8.html.
- David Gassko, “Explaining LIPS,” 16 June 2009, Hardball Times.
- Nate Silver, “Lies, Damned Lies: Playoff Hurlers,” 27 September 2006, Baseball Prospectus.
- Matt Swartz and Eric Seidman, “Introducing SIERA, Part 5,” 12 February 2010, Baseball Prospectus.
- Matt Swartz and Eric Seidman, “Introducing SIERA, Part 1,” 8 February 2010, Baseball Prospectus.
- Colin Wyers, “Manufactured Runs: Thawing Out Frozen Ropes,” 13 April 2010, Baseball Prospectus.
- The Fielding Bible Awards / Plus/Minus / Frequently Asked Questions about Plus/Minus and Runs Saved, fieldingbible.com/.
- Dick Kaegel, “Subtle Tweaks Elevate Greinke’s Game: Improved Changeup, Focus Lead to Cy Young Season,” 18 November 2009, MLB.com.
- Jeff Passan “Royals’ Bannister Unafraid to Do the Math,” 8 March 2010, http://sports.yahoo.com/.
- Colin Wyers, “How Well Can We Predict ERA?” 18 June 2009, Hardball Times.
- McCracken, “DIPS Version 0.”
- McCracken, “Pitching and Defense: How Much Control Do Hurlers Have?”