
Modeling Perfect Games and No-Hitters in Baseball
This article was written by Bruce Bukiet - Uri Carl - Rebecca Sichel
This article was published in Spring 2011 Baseball Research Journal
Through Major League Baseball’s first 134 years, 1876–2009, some of its most interesting and uncommon events have been the 260 no-hitters (18 of which have been perfect games).1 In 2010, pitchers threw six no-hitters, two of which (and almost a third) were perfect. In this paper, we investigate whether simple mathematical models can explain the frequency of perfect games and no-hitters over the years. We also investigate whether the pitchers who actually pitched the perfect games were those who “should have been expected” to do so.
PERFECT GAMES
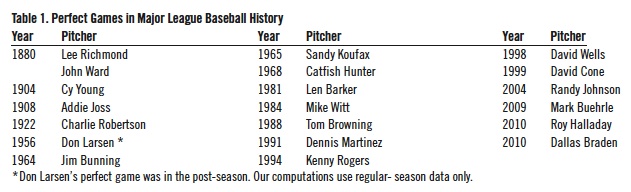
From 1876 through 2009, pitchers threw 18 perfect games. Each was achieved by a different pitcher and only once before 2010 (way back in 1880) did two perfect games occur in the same year (see Table 1). Of these perfect games, 17 came during the regular season. In this paper, we only consider regular-season events.
SIMPLEST MODEL
Possibly the simplest approach to modeling the occurrence of perfect games is to treat all seasons, all pitchers, and all batters alike. Given this seemingly unrealistic assumption, one may ask, how many perfect games should have been pitched?
Over the first 134 years of Major League Baseball history, the overall on-base percentage (OBP) has been approximately 0.3279,2 meaning that in about 1?3 of plate appearances, the batter reached base. Yet, in order to pitch a perfect game, a starting pitcher must retire the 27 consecutive hitters he faces. The probability of pitching an out is (1-OBP), and so the probability of pitching a perfect game is (1-OBP)27.
In general, therefore, the number of perfect games to be expected according to this analysis is:
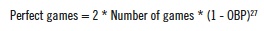
The reason for the “2” is that either team in a game may pitch a perfect game. 195,177 regular season games were played from 1876–2009, so the number of perfect games to be expected from 1876–2009 is 195,177 * 2 * (1-.3279)27 = 8.55, just half of the 17 observed.
One can approach this matter in the opposite way and compute the OBP needed in order to obtain the result of 17 perfect games. Solving equation (1) for OBP, we have
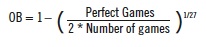
This leads to a 0.3106 OBP. From the perspective of the OBP, a difference of 0.0173 (that is, .3279 – .3106), or about 5% of OBP value, can account for the difference between the observed number of perfect games (17) and the number expected from this simple model (8.55). This demonstrates the sensitivity of the expected number of perfect games to variations in OBP. We present in Graph 1 the relationship between OBP and the expected number of perfect games. As OBP increases, more batters get on base and the likelihood of a perfect game shrinks.
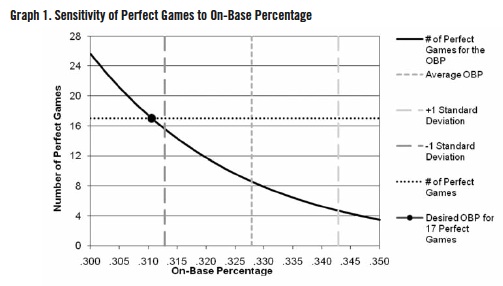
We note that OBP has ranged from a low of 0.267 in 1880 to a high of 0.379 in 1894. If these values persisted through the 134 years studied, the expected number of perfect games would have been 89 and one respectively. The year-by-year game-weighted standard deviation of OBP is 0.0150, so a one standard-deviation range for OBP gives a range of 0.3129 to 0.3429 (that is, .3279 ± 0.0150. This results in the expected number of perfect games to range from 4.6 to 15.5, which comes close to but does not reach the observed number of 17 perfect games. This further demonstrates the sensitivity of expected perfect games to small changes in OBP. It also indicates that while this simple model is not very satisfying, it is not entirely incompatible with the observed number of perfect games.
YEAR-BY-YEAR MODEL
The results of the simple model led us to consider a revised model in which the same approach is used but in which each year is considered separately. Clearly, not all years in baseball have been alike, as indicated above by the range of observed OBP values over the years. If we consider each year separately, with its own OBP, how would the expected number of perfect games change?
Applying equation (1) to each year individually and taking into account the number of regular season games played, we computed the expected number of perfect games for each year. After summing these games, we found that the expected number of perfect games in 1876–2009 was 10.6. The year with the lowest expected number of perfect games was 1894, with 0.004 expected perfect games; the number of games played (799) was small and the OBP (0.379) high.
The greatest number of perfect games (0.451) was expected in 1884, when the OBP was a low .279 and the number of games played a high 1,544, the fourth-highest number of games in a season prior to 1960. That 10.6 perfect games were expected by this model rather than the actual 17 indicates that an improved approach is needed in order to obtain a more realistic result. Even more troubling is that the standard OBP omits reaching base on error (ROE), which actually counts toward an out in the at-bat term, lowering the OBP, and a single player reaching base on an error foils an otherwise perfect game. At least five near-perfect games, broken up by merely a single error, have occurred in baseball history.3
INCORPORATING BATTERS REACHING BASE ON ERRORS
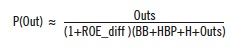
Complete data for batters reaching base on an error is only available for 40 of the years from 1960 to the present.4 The total number of errors each year for all years from 1876 to the present, however, can easily be located. Interestingly, for the 40 years of complete data, the ratio of batters reaching base on an error to the total number of errors is almost constant, averaging 63.4% with a standard deviation of 1.1%. Thus, we can reasonably take 63.4% of the total number of errors throughout baseball history, or year-by-year, for those years for which there is incomplete or no ROE data, as an estimate for the number of batters reaching base on an error. The OBP adjusted to incorporate reaching base on an error thus becomes:

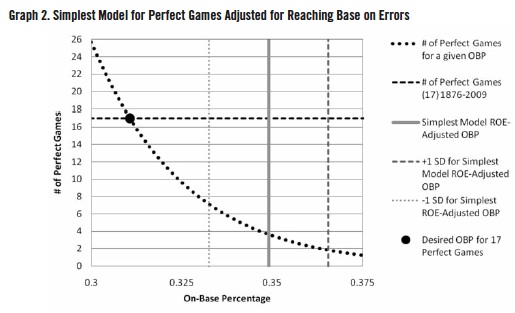
Note that the plate appearances by those batters reaching base on an error have already been included in the denominator (as outs) in AB. Performing the same analysis as done for the Simplest Model (OBPROE = 0.3490 with standard deviation 0.0165) leads to the expected number of perfect games from 1876 through 2009 of 3.6; a one-standard-deviation range yields 1.8 to 7.1 expected perfect games. These results are presented in Graph 2, where it is clear that the one standard deviation range of OBPROE comes nowhere near including the true number of perfect games.
Applying the OBPROE to the year-by-year model leads to the marginally more realistic expectation of 4.3 perfect games from 1876–2009. We see, however, that adjusting OBP to incorporate ROE exacerbates the error and further highlights the need for a more careful look at the occurrence of perfect games.
PITCHER-BY-PITCHER MODEL
For the previous models, all batters and pitchers were presumed to have equal ability throughout baseball history (in the simplest model) or for each year individually (in the year-by-year model). This leads to the expectation of less than one-third of the actual number of perfect games when ROE is taken into account. Because the equal ability assumption is unrealistic, we explored a more sophisticated model. Since the course of a game, and surely of a no-hitter, would seem to depend more on a pitcher’s performance than on that of any single hitter (see, for example, Frohlich’s paper on no-hitters), as a next step, we considered a model in which pitchers have different abilities. Specifically, we considered the performance of each individual pitcher. How often does a particular pitcher generate outs? Will this variation in pitching ability lead to results more in line with those that have occurred in baseball history?
To answer these questions, we compiled the data (the OBPROE) for every pitcher in each year of his career (i.e. if a pitcher pitched ten years, he has ten separate data sets).5 Since ROE data for each pitcher is not available, we assumed that each pitcher was subject to the same probability of a batter reaching base on an error as all other pitchers in each particular year.
That value is the difference between the year-by-year OBP with and without including ROE, which we denote by ROE_diff. For early years of baseball, when on average about ten errors per game were committed, this value is as high as 0.097, meaning that approximately 10% of all batters reached base on an error. For recent years, the value is about 0.01, meaning about 1% of all batters reach base on an error. Naturally, this results in a large handicap for pitchers in baseball’s early years with respect to ease of pitching a perfect game. For a pitcher, the probability of getting a batter out becomes (see Appendix for the derivation):
We then considered how many games each pitcher started each year (since a pitcher cannot pitch a perfect game if he does not start). We further considered only pitchers who pitched at least 54 outs in a season to eliminate cases of very low data (We note that relaxing this condition to the minimum 27 outs needed to pitch a perfect game leads to a difference of less than half a perfect game over the 134 years considered). The probability of the pitcher pitching a perfect game is, as before, the probability of an out raised to the 27th power, P(Out)27.
We then used a computer to simulate whether a given game would be “perfect” by using a random number generator that would mark off a perfect game when the (uniformly distributed on [0,1]) random value was less than P(Out)27. This was done for each game started by each pitcher in each year—more than 39,000 cases in all.6 This simulation method is very similar to that which was used by Arbesman and Strogatz in their study of Joe DiMaggio’s 56-game hitting streak.7 One such computation yields a baseball “universe,” a simulation of baseball history from 1876–2009 using pitcher OBP values from these years’ games. We ran the simulation for 2,000 universes and analyzed the output for the average number of perfect games and their distribution. In addition, we compiled results for which pitchers should have been most likely to pitch perfect games.
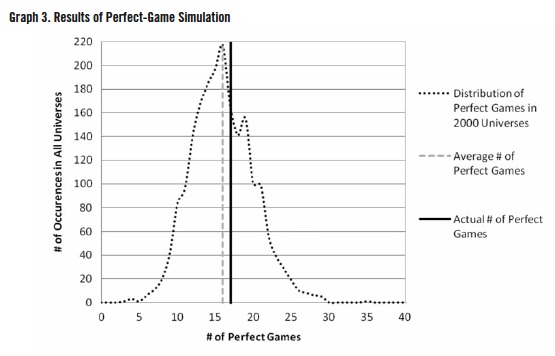
In our universes, the estimated number of perfect games ranged from 3 to 35 over the 134 years, with the average being 15.9 (see Graph 3) with a standard deviation of 4.1, meaning the true value of 17 falls well within one standard deviation of the computed value.
Of course, one can include more aspects of the game of baseball, such as variation in hitting ability among the different teams’ lineups or variation in hitting ability within a single lineup. In his study of no-hitters, Frohlich8 discussed this hitting variation issue and found the effect to be small. We have excluded some other baseball events such as strikeouts, double and triple plays, and reaching base on interference from our paper. These events and others may be difficult to include in the modeling, may be problematic to obtain reliable data for, occur rarely, or are unlikely to have a major influence on the results.
As a check on the reasonability of the computations, we looked at how the pitchers who actually pitched perfect games fared in the simulations as well as at the pitchers who most often pitched perfect games in these simulations. We ranked the pitchers in order of number of perfect games “pitched” by each pitcher in the 2,000 universes and investigated where the actual 17 perfect game pitchers placed. Eight of the 17 were in the top 1% (in the top 84 of the over 8,300 pitchers who have pitched in the Major Leagues) in our ranking, while six others were in the top 5% (85th–420th), one more in the top 10%, and the other two in the top 25%. These results appear in Table 2. The top 10 pitchers with the greatest number of perfect games in the simulations are presented in Table 3. All are well known among baseball fans, although just one of them (Sandy Koufax) actually pitched a perfect game. One of the others (Walter Johnson) pitched a “near-perfect game.”
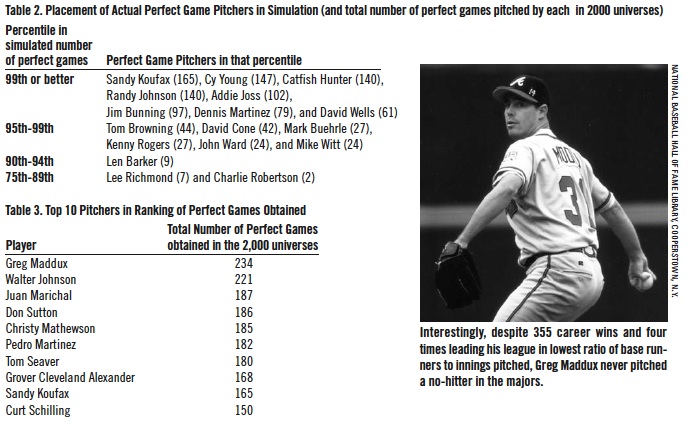
We note that only about 2,700 of the more than 8,300 pitchers in baseball history ever pitched a perfect game in the simulation of 2,000 baseball universes. The others either lacked the needed skill level or never started a game. The standard deviation for the results listed in Table 3 is about 16 games.
NO-HITTERS
All perfect games are no-hitters, but no-hitters are more common than perfect games since they are not broken up by a walk, hit-by-pitch, or error. Still, pitching a no-hitter is quite an achievement. In a perfect game, the only probabilities involved are of getting on base and of an out. In contrast, in modeling no-hitters, one must also deal with the probabilities of a walk, a hit-by-pitch and reaching base on an error. There were 250 single-pitcher no-hitters during the 1876–2009 regular seasons.
Frolich9 approached the more general question of how often any given number of hits should be obtained in a baseball game. He considered hits and outs, while ignoring all other events, and developed a negative binomial formula for the distribution of the number of hits that can be expected in a game given the overall probability of a hit each year he studied. He then built on that model, first varying the average pitchers’ abilities and then varying the average batters’ abilities. He found good agreement with predicting the number of three-hit games through ten-hit games for the five-year period from 1989 to 1993. His results outside of this range of hits, however, were less satisfactory. His model predicted only about two-thirds the actual number of no-hitters for the 1900–93 period.
Our efforts are focused on obtaining improved results in modeling no-hitters. We modeled mathematically the number of no-hitters in 1876–2009 and then compared our result to the true value.
SIMPLEST NO-HITTER MODEL
We revised our computer model to recreate our universes of baseball history by incorporating three types of events that can occur in a baseball game: (1) hits; (2) walks, hit-by-pitches and reaching base on an error; and (3) outs. To investigate the no-hitter issue, we needed to go through lineups one batter at a time through each game (where all batters are assumed to have equal ability). A random number was chosen uniformly distributed on [0,1] to determine whether a batter was out, got a hit, or reached base by a walk, hit-by-pitch or reaching on an error. If a hit was obtained prior to 27 outs being recorded, the game failed to be a no-hitter. On the other hand, if 27 outs were recorded without any hits being obtained, the game was deemed to be a no-hitter. This was repeated to simulate 2,000 universes with 195,177 games in each.
First, as we did for modeling perfect games, we used the probabilities of outs, hits, and BB+HBP +ROE (as described earlier) for the 134 years from 1876 through 2009. The probability of an out was 0.6510; the probability of a hit was 0.2374; and the probability of a BB, HBP, or ROE was 0.1116. This initial simulation projected an unsatisfactory 123 no-hitters in an average universe with a standard deviation of 14.5 no-hitters. (The target number of no-hitters was 250).
YEAR-BY-YEAR NO-HITTER MODEL
We ran the simulation again, but now we computed the probabilities of outs, hits, and BB+HBP+ROE separately for each season. The probabilities were input into the program along with the number of games taking place each year. Once again we simulated 2,000 baseball universes. These results were slightly better but still unsatisfactory. This simulation produced 135.4 no-hitters on average with a standard deviation of 14.8. This indicated, as with our perfect game analysis, that we might be better off repeating our pitcher-by-pitcher approach.
PITCHER-BY-PITCHER NO-HITTER MODEL
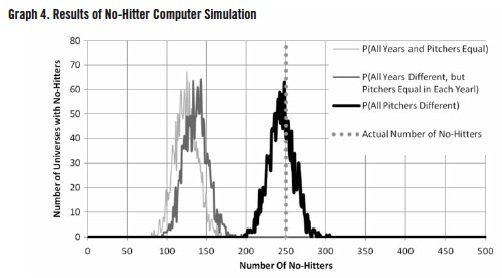
We revised our pitcher-by-pitcher approach for perfect-game modeling to investigate no-hitters in the same manner as we did using the Simplest No-Hitter and Year-by-Year No-Hitter models; that is, we considered the case of getting on base without a hit in addition to the case of hits and the case of outs. We looked at the probabilities of the various occurrences for each pitcher who started a game for each year and proceeded as described in the above “Perfect Game” section. Once again we only considered pitchers who started at least one game and pitched at least 54 outs in that season. The results were striking. In the 2,000 universes we ran, we found an average of 243 no-hitters, off by less than 4% from the 250 single pitcher no-hitters that actually occurred in 1876–2009. The standard deviation was 15.7 no-hitters. Thus, this last model, which uses individual pitcher data, once again provides a vast improvement over the previous models. Results of the simulations of the three methods for investigating no-hitters are presented in Graph 4.
DISCUSSION AND CONCLUSION
Modeling rare events is prone to significant relative error whether one is modeling extreme behavior in financial markets or rare weather events. The same is true in modeling rare occurrences in baseball. Our analysis and simulations demonstrate that using multiyear combined data leads to inaccurate predictions for the occurrence of rare events (such as perfect games and no-hitters). Using year-by-year data improved the results a bit, while including pitcher-by-pitcher data in each year of his career greatly improved the results for both the perfect game and the no-hitter studies. This indicates that those who have pitched no-hitters and perfect games had, in general, far superior pitching ability than the average pitcher in baseball history.
In order to perform the computations, we needed to adjust for the incomplete data available concerning batters reaching base via error. Despite the lack of data in the early years of Major League Baseball, the results obtained are quite realistic. Since we performed the analysis during the 2010 season, we only included complete seasons. With the plethora of perfect games (and one perfect game broken up by a poor call by an umpire) and no-hitters in 2010, it appears that 2010 was a special season of the sort that ought not to come along very often, at least for perfect games and no-hitters. While a pitcher’s ability to throw a perfect game is surely enhanced by the much lower rate of errors in the modern game, we might consider ourselves fortunate to have witnessed such a special season.
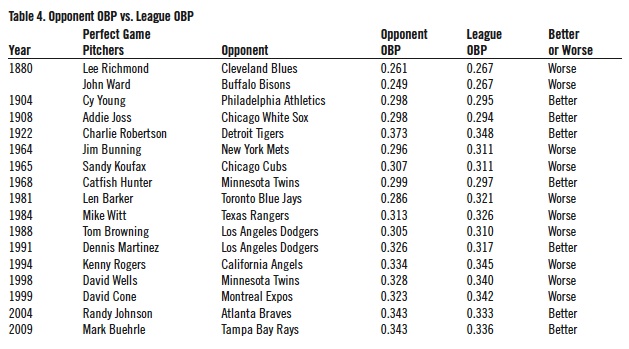
One might ask whether the teams defeated in the perfect games had less offensive ability than the league average and whether this aspect should influence the number of perfect games. It turns out that in the 17 regular-season perfect games, the defeated team had a better standard OBP than the league average seven times and a worse OBP ten times. On average, the standard OBP of the defeated team was 0.0046 less than the league average. Details are presented in Table 4. We conclude from this, just as Frohlich did in the no-hitter case, that the variation in batter ability has a small effect on perfect games.
Table 1 indicates a 42-year gap between the regular-season perfect game pitched by Charlie Robertson in 1922 and the one pitched by Jim Bunning in 1964. This made us wonder whether a similar large gap phenomenon occurs in the simulations. We looked at the longest gap in each of our 2,000 universe perfect game pitcher-by-pitcher simulations. Our longest gap between perfect games averaged 24.1 years with a standard deviation of 12.4 years, with the minimum longest gap being three years and the maximum longest gap being 86 years in our 2,000 universes. We have demonstrated in this paper how one can apply mathematical methods to model even rare aspects of baseball. We hope that this work will lead to further mathematical investigations into questions concerning America’s greatest game.
Appendix
The following abbreviations have been used in this paper.
AB – At-Bats
BB – Bases on Balls
BF – Batters Faced
H – Hits
HBP – Hit by Pitches
OBP – On-Base Percentage
ROE – Reached Base on Error
SF – Sacrifice Fly
Derivation of the Probability of Out, Hit, and Reaching Base without a Hit for Individual Pitchers from Available Data

(Click image to enlarge)
Notes
1 “No-Hitter – BR Bullpen.” Baseball-Reference.com – Major League Baseball Statistics and History. Web. June-July 2010. http://www.baseball-reference.com/bullpen/No_hitter.,“PerfectGame.” Baseball-Reference.com – Major League Baseball Statistics and History. Web. June-July 2010. http://www.baseball-reference.com/bullpen/Perfect_game.
2 The standard definition of OBP is (H + BB + HBP)/(AB + BB + HBP + SF). Reaching base on an error is not used in this definition. For a listing of abbreviations used in this paper, please see the Appendix.
3 We thank an anonymous referee for suggesting incorporating ROE in our analysis.
4 Ruiz, William. “Near-Perfect Games.” SABR Baseball Research Journal 20 (1991): 46-51. Print.
5 Sean Lahman’s Baseball Archive. Web. June-July 2010. http://www.baseball1.com.
6 For example, since Roger Clemens pitched 23 years, 23 of the 39,000+ cases are the years pitched by Clemens.
7 Arbesman, S., and S.H. Strogatz. “A Monte Carlo Approach to Joe DiMaggio and Streaks in Baseball.” arXiv:0807.5082v2. 1 August 2008.
8 Retrosheet ML batting and pitching splits for each year. This is for the 1996 season, http://www.retrosheet.org/boxesetc/1996/YS_1996.htm.
9 Retrosheet ML batting and pitching splits for each year. This is for the 1996 season, http://www.retrosheet.org/boxesetc/1996/YS_1996.htm.