

More Thoughts on DiMaggio’s 56-Game Hitting Streak
This article was written by Jay Mendelsohn - Edward Beltrami
This article was published in Summer 2010 Baseball Research Journal
Each time a player is at bat in a game, there is a certain probability that he will get a hit or not.
Probability theorists usually think about this in terms of a tossing a biased coin (that is, one whose probability of turning up heads is not equal to .5) in succession, with each toss having the same probability of being a head. A perennial question is the probability of having a run of k heads in a row in n tosses. In the parlance of baseball, the question is the likelihood of getting a streak of k games in which he gets at least one hit.
Our focus here is on a different question—namely, whether a long streak is consistent with a random coin-tossing model or if it is an exceptional event that defies the usual odds. This is a controversial topic, especially in the case of Joe DiMaggio’s 56-game hitting streak in 1941. It was an unusual occurrence, but was it only a manifestation of pure chance?1
We want to add our voice to this discussion by being more specific about what it means for the outcome of a game to be due to chance.
 A player’s average performance over many games is obtained from his batting average and his average number of hits per game. From these, one extracts an estimate of his probability of getting at least one hit per game—every time he is at bat, he either gets a hit or not—and the probability of this is some constant value determined by his averages. Moreover, each atbat is independent in outcome from all previous at-bats. This independence assumption is somewhat questionable during periods of exceptional performance (something we discuss further below), but it appears that, in the long run, over many games and many seasons, this hypothesis is not unreasonable and, as we will see, some of our results tend to support it.
We now have the components for what is known as a Poisson process (after the French mathematician S. Poisson). For a Poisson process there is a specific formula p(k) for the probability of obtaining exactly k hits: ?k e-k/k! The details of how this comes about are discussed in most texts on probability and statistics. The only point of immediate concern to us is the parameter ?, the average number of hits per game. In a season of n games in which a player gets a total of m hits, one estimates ? by m/n. In the case of DiMaggio in 1941, he played in n=139 games and got a total of m=193 hits, and so ?=1.39.
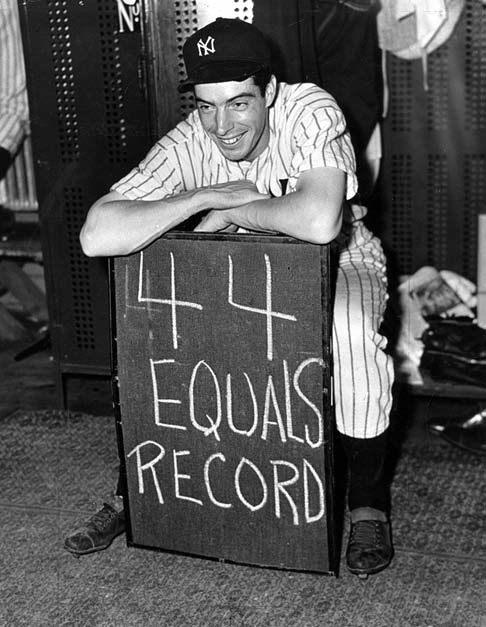
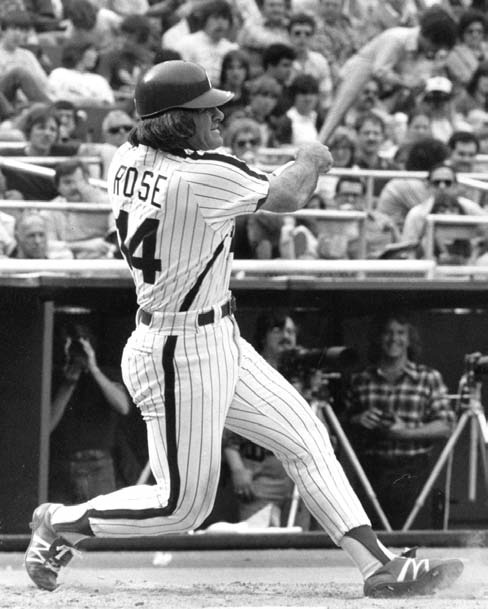
To begin the study of the phenomenon of “streak hitting,” we obtained game-by-game statistics pertaining to the two major streaks in modern baseball— DiMaggio’s 56-game streak in 1941 and Pete Rose’s 44-game streak in 1978. In DiMaggio’s case, the data had to be painstakingly culled from newspaper box scores.2 It is possible to count how many games in the season there were either no hits, or one hit, or two hits, up to four hits (the maximum for any game, as it turned out). Whether these data are consistent with the Poisson formula is easily found by computing p(k) for k=0, 1, 2, 3, 4 and then comparing the result to the actual number of hits. For the Pete Rose streak year, the same type of data was obtained from the Retrosheet, an invaluable source for this study and any future studies requiring daily and seasonal baseball data that are in-depth.
In order to test whether these streaks were exceptional occurrences, we made the comparison between theoretical and actual data for three sets of data in each of the streaks—the full seasons of 1941 and 1978, the streak-only data for those years, and the no-streak data. We also compared a variety of common stats such as batting average, average hits per game (this is the lambda, the one parameter of the Poisson distribution), on-base percentage, and slugging percentage. (The latter two metrics added together form OBPS.) We then were able to compare the action of the model on each of those periods and also compare the hitting statistics of the players during each of the periods, and finally we could examine two streaks for interesting similarities or difference with respect to the model fit and the players’ statistics.
To test the hypothesis that the model predicted data that could be considered a reasonable representation of the actual data, we used the well known Chi Square goodness-of-fit test. If this hypothesis is rejected on the basis of the Chi Square test, then we must say that the model is not doing a good job of representing the data. Looking at the first two scenarios, we see that the Poisson assumption overestimates the number of games in which DiMaggio went hitless and underestimates the single-hit games, whereas, when the streak is removed, in the third scenario, there is actually a very good fit to the actual data (rounding to the closest integer gives a nearly perfect fit).
Table 1. DiMaggio’s 56-Game Streak, 1941
| k, the number of hits | ||||||
|---|---|---|---|---|---|---|
| Poisson Model, Full Season (139 Games) | 0 | 1 | 2 | 3 | 4 | |
| Number of games, actual | 24 | 64 | 31 | 13 | 7 | |
| Number of games, predicted from p(k) | 34.62 | 48.12 | 33.45 | 15.5 | 5.39 | |
| Model is a poor fit to the data | ||||||
| Poisson Model, Streak-Only Data (56 Games) | ||||||
| Number of games, actual | 0 | 34 | 13 | 15 | 4 | |
| Number of games, predicted from p(k) | 11.12 | 17.92 | 14.56 | 7.89 | 3.2 | |
| Model is a poor fit to the data | ||||||
| Poisson Model, No-Streak Data (83 Games) | ||||||
| Number of games, actual | 24 | 30 | 18 | 8 | 3 | |
| Number of games, predicted from p(k) | 24.26 | 29.84 | 18.35 | 7.52 | 2.31 | |
| Model is a poor fit to the data |
Using a X goodness-of-fit test2, we can reject the hypothesis that the actual hit data for all games and for the streak-only games are representative of a Poisson process at the 95 percent confidence level. On the other hand, when the streak is removed, the hypothesis that the difference is entirely due to randomness (consistent, of course, with DiMaggio’s skill in getting a hit, as determined by ?) cannot be rejected at the 95 percent confidence level or, in fact, at the 99 percent level. What this suggests is that the streak data and the rest of the data possibly represent two different levels of play.
Table 2. DiMaggio’s Batting Statistics, 1941
| Full Season | Streak Only | Not Including Streak | Lifetime | |
|---|---|---|---|---|
| At-Bats | 542 | 223 | 319 | 6,821 |
| Hits | 193 | 91 | 102 | 2,214 |
| Games | 139 | 56 | 83 | 1,736 |
| BA | .356 | .408 | .320 | .325 |
| Lambda | 1.39 | 1.63 | 1.23 | 1.28 |
| OBP | .440 | .467 | .425 | .398 |
| Slugging | .643 | .717 | .591 | .579 |
This is not to say that an unusual streak cannot occur by chance alone but that the odds of this happening are minuscule (about once in 10,000 seasons)3 and the alternate hypothesis that the streak is a sort of freak is more in keeping with the Poisson model of random behavior.
In table 2, we look at DiMaggio’s batting statistics in the three periods of interest.
Comparing the in-streak data to both the full-season (obviously the streak had an effect on this) and the no-streak data, we see that, during the streak, DiMaggio’s performance was far better than his lifetime averages and certainly far better than no-streak averages. Further, we see that the values for the no-streak behavior conforms very well to the lifetime values. This adds to the suspicion that streak performance is radically different from “normal” performance, and that may be why the same model is not suitable for both levels, as we observed from table 1.
We now look at Pete Rose’s 44-game hitting streak of 1978 and perform the same analysis as for the DiMaggio streak. The results are presented in tables 3 and 4.
Table 3. Rose’s 44-Game Streak, 1978
| k, the number of hits | |||||||
|---|---|---|---|---|---|---|---|
| Poisson Model, Full Season (159 Games) | 0 | 1 | 2 | 3 | 4 | 5 | |
| Number of games, actual | 35 | 70 | 39 | 11 | 3 | 1 | |
| Number of games, predicted from p(k) | 46 | 57 | 36 | 15 | 5 | 1 | |
| Model is a poor fit to the data | |||||||
| Poisson Model, Streak-Only Data (44 Games) | |||||||
| Number of games, actual | 0 | 26 | 11 | 6 | 1 | 0 | |
| Number of games, predicted from p(k) | 9 | 14 | 11 | 6 | 2 | 0 | |
| Model is a poor fit to the data | |||||||
| Poisson Model, No-Streak Data (115 Games) | |||||||
| Number of games, actual | 35 | 44 | 28 | 5 | 2 | 1 | |
| Number of games, predicted from p(k) | 37 | 42 | 23 | 8 | 2 | 0 | |
| Model is a poor fit to the data |
Examining the Rose-model fits in table 3, we find that qualitatively they are much the same as DiMaggio’s. That is, we have a good model fit when the streak data is eliminated, poor model fit during the streak, and, though the fit to the full season is slightly better than in the DiMaggio case, it still cannot be considered a really good fit. The same conclusions can be drawn from table 4. During the streak, Rose’s performance was better than his no-streak averages and better even than his lifetime averages. Both players were exceptional in their streaks.
Table 4. Rose’s Batting Statistics, 1978
| Full Season | Streak Only | Not Including Streak | Lifetime | |
|---|---|---|---|---|
| At-Bats | 655 | 182 | 473 | 14,053 |
| Hits | 198 | 70 | 128 | 4,256 |
| Games | 159 | 44 | 115 | 3,561 |
| BA | .302 | .385 | .271 | .303 |
| Lambda | 1.25 | 1.59 | 1.11 | 1.19 |
| OBP | .362 | .419 | .339 | .375 |
| Slugging | .421 | .462 | .406 | .429 |
 Finally, using Retrosheet, we looked at model fits to two more of DiMaggio’s seasons, 1938 and 1940. In 1938, DiMaggio hit .328, very close to his lifetime average of .325 and to his non-streak average of .320 in 1941. The model provided a very good fit to that season’s data. In 1940, DiMaggio hit .352, very close to his .356 for the full 1941 season, and the model data was a poor fit to that season, 1940, just as it was to the full 1941 season. This once again points to boundary levels at which this model is no longer valid. This will be examined more fully in a future paper.
There appear to be two points of view about the nature of the DiMaggio streak. The first is that it was a binomial event of extremely low probability but one that actually happened in 1941—something like actually witnessing the occurrence of 100 straight heads in coin tossing. The second is that it is an example of a superior hitter exceeding even his own normal capabilities. The authors tend to believe the latter, and the results of this article—that is, the failure of the model to actually represent the streak data and the success of the model at representing the non-streak data— begin to support that point of view. We plan to do a much larger study involving many more batting metrics, shorter streaks (say, of thirty or more games), and comparable “hot periods” not necessarily involving consecutive-game hit streaks. Our aim is to build on and further explain the nature of streaks in baseball and perhaps to describe more completely what a “hot hitter” really is.
A final note: The goodness of fit between actual and Poisson-predicted data when the streak is ignored lends support to the idea that independence is a valid assumption for most players except during periods of exceptional performance, when the independence conjecture may indeed be questionable.
EDWARD BELTRAMI is professor emeritus at Stony Brook University.
JAY MENDELSOHN is a retired associate professor of computer science at Hofstra University.
Acknowledgments
We would like to express our thanks to Retrosheet for making available some of the data we used in this study.
Notes
1 See, for example, “Hitting Streaks Don’t Obey Your Rules,” by Trent McCotter, The Baseball Research Journal 37 (2008): 62–70; and “A Journey to Baseball’s Alternate Universe,” by Samuel Arbesman and Steven Strogatz, New York Times, 30 March 2008.
2 For ten games, Trent McCotter kindly supplied us with box scores that otherwise would not have been available.
3 See, for example, Michael Freiman, “56-Game Hitting Streaks Revisited,” The Baseball Research Journal 31 (2002): 11–15.