

World Series Game Situation Winning Probabilities: How Often Do Teams Come Back From Behind?
This article was written by Douglas Jordan
This article was published in Fall 2014 Baseball Research Journal
You’re ecstatic that your favorite team won the League Championship Series to get into the World Series, but your pitching ace performs poorly and the team loses Game One. How worried should you be?
There is a general perception among many baseball fans that losing the first game of a seven-game series is not a big setback, but is this fact or an unsubstantiated belief? Let’s say after the initial loss, they win the next two games to take a 2–1 lead in the series. Now how confident are you? Should you buy expensive champagne in anticipation of a World Series victory since you just won two in a row? Let’s hope you didn’t spend too much on the bubbly if you lived in St. Louis in October 2013, as that is exactly what happened to the Cardinals before the Red Sox won three in a row to take the World Series.
The purpose of this article is to examine the probabilities of winning the World Series for all possible game combinations. For example, what is the actual probability of winning if you fall behind 0–1 as St. Louis did, or 1–2 as Boston did? What if you’re ahead or behind two games to none?
The probability of winning in these and other possible game situations will be answered by examining what’s happened historically in the World Series. The historical data used to generate the probabilities is based on seven-game World Series only, starting with the 1905 World Series. The best-of-nine Series played in 1903 and 1919–21 are not included in the analysis. This leaves a total of 105 seven-game Series in the data set since there was no World Series in 1904 or 1994.
POSSIBLE GAME SITUATIONS
How often have all the possible configurations of progressive won-loss combinations (“game situations”) occurred during the 105 seven-game World Series that have been played to date? The results are shown in Table 1.
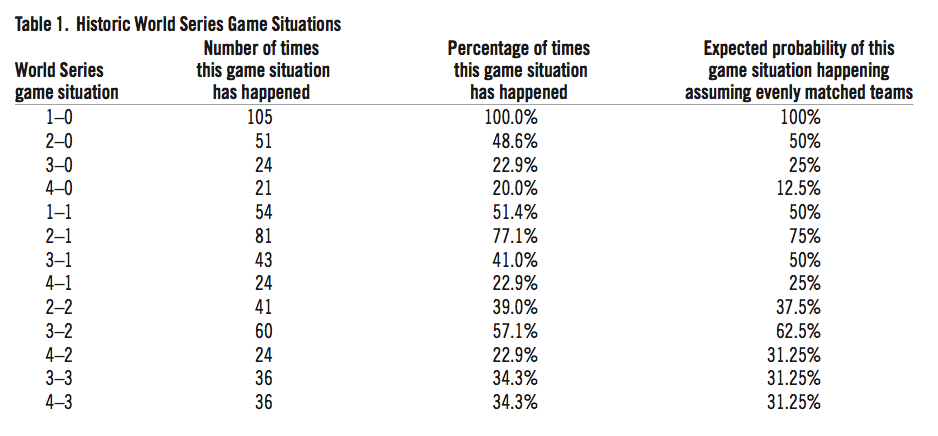
Table 1: Historic World Series Game Situations
(click image to enlarge)
Table 1 shows that just over half the Series have stood at 1–1 while just under half have stood at 2–0. Slightly over three-quarters of the Series have stood at 2–1 while just under one-quarter of the Series started 3–0. Moving on to the fourth game of the Series, it seems mildly surprising that more Series (43 total or 41 percent) have been at 3–1 than have been at 2–2 (41 total or 39 percent) but the result is consistent with the expected probabilities for evenly matched teams. One-fifth of the Series have been sweeps. About 23 percent of the Series finished at 4–1 while 57 percent stood at 3–2. Twenty-three percent of the Series finished at 4–2 and just over one-third of the Series stood 3–3 before the decisive Game Seven.
The information in the last column of Table 1 is not directly related to the main point of this article but is included for informational purposes. Relatively straight-forward statistical analysis (see http://mste.illinois.edu/hill/ev/seriessol.html for details) gives the expected probabilities of possible game situations assuming each team has a 50 percent chance of winning each game. A couple of interesting points can be made by comparing the expected probabilities in column four to the actual percentages in column three. First, with three exceptions, the actual and expected probabilities are pretty close given the relatively small sample size.
This suggests that the teams that compete in the World Series are usually evenly matched. But there have been more sweeps (12.5 percent of 105 is about 13, so we would have expected to see 13 World Series end in sweeps rather than the 21 sweeps that have actually occurred), fewer 3–1 Series, and fewer six-game Series than theoretically should have occurred between evenly matched teams. These anomalous results are all related. The increased number of sweeps has resulted in fewer six-game Series. Why are there so many sweeps if the teams are evenly matched? The most likely explanation is psychological. Teams that fall behind 3–0 know their chances of winning are small and play the fourth game accordingly. This also accounts for the shortage of 3–1 Series.
PROBABILITIES OF WINNING FOR DIFFERENT GAME SITUATIONS
So what does history suggest a team’s probability of winning the World Series is for different game situations? The answer to this question is shown in Table 2. For the game situations shown in Table 2, one team is ahead and one team is behind so there are two rows for each game situation. It is assumed that each team has an equal chance of winning when the Series is tied at one, two, or three games each, so those situations are not shown in Table 2.
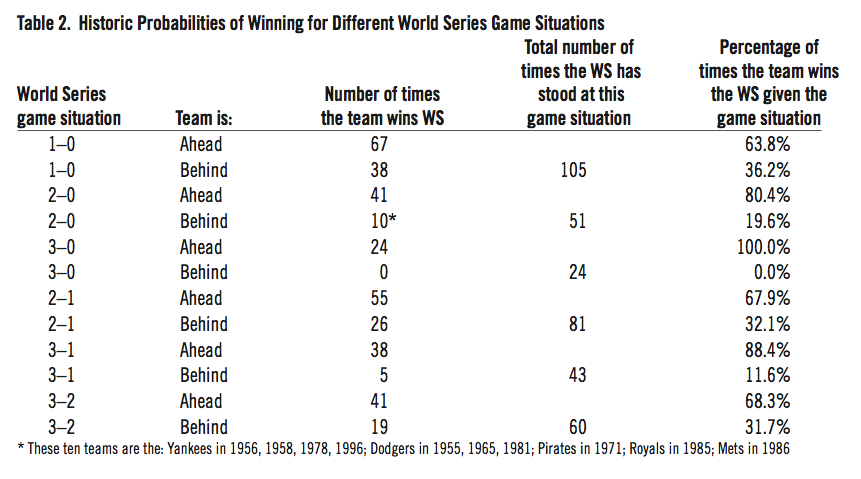
Table 2: Historic Probabilities of Winning for Different World Series Game Situations
(Click image to enlarge)
The first row of Table 2 shows that 67 teams have won the first game of the World Series and gone on to win the World Series. The final column in the first row shows that the team that wins the first game wins the Series about 64 percent of the time. In 38 of the World Series, the team that lost the first game came back to win. This means that teams that lose the first game have a roughly 36 percent chance of winning.
Table 2 also shows that 41 of the 51 teams (80 percent) that lead 2–0 went on to win the Series while only 10 of the 51 teams (20 percent) that fell behind 0–2 came back to win. Teams that lead 2–1 win about two-thirds of the time, while teams that are behind 1–2 come back about one-third of the time. No team that’s fallen behind 0–3 has ever come back to win (and just three teams out of 24 that fell behind 0–3 have even forced a fifth game: the Cubs in 1910, the N.Y. Giants in 1937, and the Reds in 1970).
History suggests that teams down 1–3 also face long odds of winning. Only about one-in-nine teams facing that situation have come back to win. The five teams that did manage to come back from 1–3 are the Pirates (twice) in 1925 and 1979, the Yankees in 1958, the Tigers in 1968, and the Royals in 1985. Interestingly, the chances of winning when ahead or behind 3–2 are almost the same as the chances of winning when ahead or behind 2–1. Teams with a 3–2 lead win about two-thirds of the time and teams down 2–3 win about one-third of the time.
ARE ODD-NUMBERED GAMES MORE CRITICAL?
The argument is often made that the odd-numbered games in a seven-game series are the most important games. This is obviously correct if the series is tied at three games apiece but the truth of the argument is not self-evident in other game situations. For example, it is not obvious that Game One is more important than Game Two when the team that trails 0–1 will be down 0–2 if it loses the second game. Similarly, it can be argued that Game Four is critically important to the team that trails 1–2 in order to avoid falling behind 1–3.
The debate is difficult to resolve because of the subjective nature of the importance of each game in the Series. However, the data in Table 2 give us a way to quantify the change in the chances of a team winning the World Series depending on whether the team wins or loses the next game and the game situation. The results shown in Table 3 can shed some light on the importance of each game of the Series.
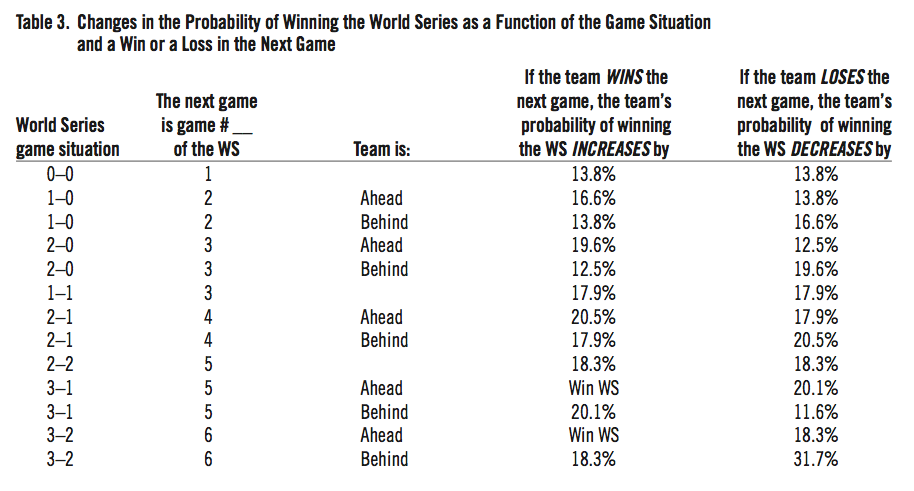
Table 3: Changes in the Probability of Winning the World Series as a Function of the Game Situation and a Win or a Loss in the Next Game
(Click image to enlarge)
Table 3 needs some explanation. First, each team is assumed to have a 50 percent chance of winning a tied Series. Second, all of the data in Table 2 are derived from the 50 percent assumption and the data shown in Table 2. Finally, the numbers shown in columns four and five are changes in probabilities rather than usual probabilities. For example, the first line of Table 3 shows that the team that wins Game One increases its probability of winning the World Series by 13.8 percent.
How is this number calculated? Table 2 shows that a team that is leading 1-0 has a 63.8 percent chance of winning. Before Game One was played, each team had a 50 percent chance to win. The difference between 63.8 percent and 50 percent is the 13.8 percent shown in Table 3.
What if a team is behind 0–1? Table 2 shows that it has a 36.2 percent chance of winning the Series. However, if the team loses the second game to fall behind 0–2, Table 2 shows that its probability of winning the Series declines to 19.6 percent. The difference of 16.6 percent between 36.2 percent and 19.6 percent is shown on the third row and fifth column of Table 3.
This means that the team’s chances of winning the World Series have declined by 16.6 percent. All of the numbers shown in Table 3 were calculated similarly. Therefore, Table 3 quantifies the importance of each of the games in the Series based on the game situation and on how winning or losing a particular game affects the team’s overall chances of winning the World Series.
What does Table 3 say about how important each game is? The first thing to note is that the importance of a given game is a function of both the game situation and whether a team is ahead or behind in the Series so it’s difficult to make a blanket statement concerning evenor odd-numbered games. The data for Game Two, for example, show that the team that is ahead 1–0 increases its chances of winning by 16.6 percent with a victory, while the team that is behind 0–1 decreases its probability of winning by 16.6 percent with a loss. This 16.6 percent change in the probability of winning is greater than the 13.8 percent change from a win or loss in Game One which means that Game Two is more important than Game One.
Given the symmetry of the numbers in Table 3 we can concentrate on the changes in probability for the team that is behind in order to estimate the importance of each game. Losing Game One decreases the probability of winning by 13.8%. Losing Game Two when behind 1–0 decreases the winning probability by 16.6%. Losing Game Three when tied at 1–1 reduces the chances by 17.9% while losing Game Three when behind 2–0 reduces the chances by 19.6%. A loss in Game Four while behind 2–1 lessens the chances of winning by 20.5% and a loss in Game Five when tied at 2–2 lowers the probability of winning by 18.3%.
These numbers suggest that Game Four is most important (a loss in that game decreases your chance of winning the most) followed closely in importance by Games Three and Five. The changes for the team that is behind 1–3 and 2–3 are included in Table 3 but are not germane to the argument because the team must win in order for the Series to continue.
In summary, the data in Table 3 suggest that the simple assertion that odd-numbered games are most important is too simplistic. Table 3 says that Game Four is the most important game of the Series, followed in importance by Games Three and Five. Also, Game Two is more important than Game One.
CONCLUSIONS
What general conclusions can we draw from this analysis? Broadly speaking, a team that is ahead by one game in the World Series (1–0, 2–1, 3–2) wins about two-thirds of the time while a team that is behind by a game comes back to win about one-third of the time. A team that leads by two games in the World Series (2–0, 3–1) wins at least 80 percent of the time, while a team that falls behind by two games comes back to win in one-of-five opportunities at best.
This article also examines the question of whether the odd-numbered games in the Series are more important than the even-numbered games. This broadly held notion is found to be too simplistic. As with many things when examined in detail, the answer depends on the situation. This analysis finds that Game Four is the most important game of the Series, followed in importance by Games Three and Five. In addition, Game Two is more important than Game One.
So don’t spend too much on the champagne if your team is ahead 2–1 in the World Series since you only have a two-thirds chance of winning. But if you win the very important Game Four, you can put the bubbly on ice. It’s a good bet you’ll get to open it.
DOUGLAS JORDAN is a business professor at Sonoma State University in Northern California. He is a relatively new but enthusiastic SABR member who looks forward to continuing to contribute to the literature on the best game in the world. A lifelong Mets fan who spent a decade in Texas, he finally learned to empathize with the suffering of Boston Red Sox fans in 1986 while agonizing over the 2011 World Series Games Six and Seven travails of the Texas Rangers.
- Related link: Click here for an update to this research that includes the 2014-2018 World Series game situations (Spring 2019 Baseball Research Journal)
Acknowledgements
I sincerely thank two anonymous peer reviewers for their comments and suggestions. Their input resulted in a much stronger paper.
Photo credit: The Topps Company