
Beyond Player Win Average: Compiling Player Won-Lost Records
This article was written by Tom Thress
This article was published in Fall 2012 Baseball Research Journal
The job of a major league baseball player is to help his team win games, for the ultimate purpose of making the playoffs and winning the World Series. Since the early history of major league baseball, pitchers have been credited with wins and losses as official measures of the effectiveness of their pitching. Of course, pitcher wins are a fairly crude measure of how well a pitcher did his job, as wins are the product of the performance of the entire team—batters, baserunners, and fielders—as well as the pitcher.
While the implementation of pitcher wins as a measure of pitcher effectiveness is less than ideal, nevertheless the concept is perfectly sound. The ultimate measure of a player’s contribution—be he a pitcher, a hitter, a baserunner, or a fielder—is in how much he contributes to his team’s wins. Using play-by-play data compiled from Retrosheet, I have constructed a set of player won-lost records that attempt to quantify the precise extent to which individual players contribute directly to wins and losses on the baseball field.
Basic Calculations
The starting point for my construction of player wins and losses is context-dependent player wins and losses and the starting point for constructing context-dependent wins and losses is Win Probabilities. The concept of Win Probability was first developed by Eldon and Harlan Mills in 1969 and published in their book, Player Win Averages.1
The basic concept underlying win probability systems is elegantly simple. At any point in time, the situation in a baseball game can be uniquely described by considering the inning, the number and location of any baserunners, the number of outs, and the difference in score between the two teams. Given these four things, one can calculate a probability of each team winning the game. Hence, at the start of a batter’s plate appearance, one can calculate the probability of the batting team winning the game. After the completion of the batter’s plate appearance, one can once again calculate the probability of the batting team winning the game. The difference between these two probabilities, typically called the Win Probability Advancement or something similar, is the value added by the offensive team during that particular plate appearance (where such value could, of course, be negative).
If we assume that the two teams are evenly matched, then the initial probability of winning is 50% for each team. At the end of the game, the probability of one team winning will be 100%, while the probability of the other team winning will be 0%. The sum of the Win Probability advancements for a particular team will add up to exactly 50% for a winning team (100% minus 50%) and exactly -50% for a losing team (0% minus 50%). Hence, Win Probability Advancement is a perfect accounting structure for allocating credit for team wins and losses to individual players.
For my work, changes in win probabilities are credited to the individual players responsible for those changes. Positive changes in win probabilities are credited as Positive Player Game Points, while negative changes in win probabilities are credited as Negative Player Game Points.
Player Game Points are assigned to both offensive and defensive players on each individual play. Anything which increases the probability of the offensive team winning is credited as Positive Points to the offensive player(s) involved and as Negative Points to the defensive player(s) involved. Anything which increases the probability of the defensive team winning is credited as Positive Points to the defensive player(s) involved and as Negative Points to the offensive player(s) involved. Within any individual game, the number of Positive Player Game Points by offensive players on one team will be exactly equal to the number of Negative Player Game Points by defensive players on the other team and vice versa. Similarly, the number of Positive Player Game Points collected by members of the winning team will exactly equal the number of Negative Player Game Points accumulated by the losing team (and, again, vice versa).
Player Game Points assigned in this way provide a perfect accounting structure for assigning 100% of the credit for all changes in Win Probability to players on both teams involved in a game.
I then convert these Player Game Points into Context-Dependent Player Wins and Losses, which I call pWins and pLosses. I simultaneously construct Context-Neutral Player Wins and Losses, called eWins and eLosses, which can be compared to Context-Dependent Player Wins and Losses to identify the contextual factors affecting players’ performances and how those contextual factors affect the translation of player wins and losses into team wins and losses.
For both Context-Dependent and Context-Neutral Player Games, two adjustments are made to these results to move from initial Player Game Points to player won-lost records, as follows:
Normalizing Component Won-Lost Records to .500
A key implicit assumption underlying my player won-lost records is that major league players will have a combined winning percentage of .500. While this is trivially true at the aggregate level, almost regardless of what you do, it should also be true at finer levels of detail.
For example, if player won-lost records are calculated correctly, the total number of wins accumulated by baserunners on third base for advancing on wild pitches and passed balls should be exactly equal to the total number of losses accumulated by baserunners on third base for failing to advance on wild pitches or passed balls. Likewise, the total number of wins accumulated by second basemen for turning double plays on groundballs in double-play situations should be exactly equal to the total number of losses accumulated by second basemen for failing to turn double plays on groundballs in double-play situations.
To ensure this symmetry, I normalize Player Game Points to ensure that the total number of Positive Player Game Points is exactly equal to the number of Negative Player Game Points for every component of Player Game Points, as well as by sub-component, at the finest level of detail which makes logical sense in each case.
Normalizing Player Game Points by Game
The total number of Player Game Points accumulated in an average big league game is around 3.3 per team. This number varies tremendously game-to-game, however, with some teams earning two wins in some victories while other teams may earn six wins in team losses. At the end of the day (or season), however, all wins are equal. Hence, in my work, I have chosen to assign each team one player win and one player loss for each team game. In addition, the winning team earns a second full player win, while the losing team earns a second full player loss.2 Context-neutral player decisions (eWins/eLosses) are also normalized to average three player decisions per game. For eWins and eLosses, this normalization is done at the season level, rather than the game level, however, so that different numbers of context-neutral player decisions will be earned in different games.
Why Three Player Decisions per Game?
The choice of three player decisions per game here is largely arbitrary. I chose three because the resulting player won-lost records end up being on a similar scale to traditional pitcher won-lost records, with which most baseball fans are quite familiar.
For example, expressed in this way, Jayson Werth led the major leagues in 2010 with 23.4 (Context-Dependent) player Wins, while Ichiro Suzuki led the majors with 21.6 losses. In comparison, C.C. Sabathia and Roy Halladay led all major league pitchers in 2010 with 21 wins (Sabathia amassed 16.3 pWins, while Halladay had 17.2.) while Joe Saunders (14.5 pLosses) led the major leagues with 17 losses. Over the entire Retrosheet Era (1948–2011), the most pWins accumulated by a single player in a season was 29.1 by Willie Mays in 1962 (against 18.4 pLosses). The most single-season pLosses were accumulated by Vladimir Guerrero in 2001 with 23.1 pLosses (and 25.4 pWins).
Why Do Players Get Wins in Games Their Team Loses?
If one is interested in assigning credit to players for team wins or blame to players for team losses, one might think that it would make sense to only credit a player with player wins in games which his team won and only credit player losses in games which his team lost. I have chosen instead to give players some wins even in team losses and some losses even in team wins. I do this for a couple of reasons.
Most simply put, baseball players do tons of positive things in team losses and baseball players do tons of negative things in team wins. Throwing away all of those things based solely on the final score of the game leads, in my opinion, to too much valuable data simply being lost. It makes the results too dependent on context.
As I noted previously, in the average major league game of the Retrosheet Era (1948–2011), the average team amasses 3.3 Player Game Points. The win probability for the winning team goes from 50% at the start of the game to 100% at the end, so that the winning team will amass exactly 0.5 more positive Player Game Points than negative Player Game Points by construction. This means that the players on an average winning team will amass a combined record of something like 1.9–1.4 in an average game. That works out to a .576 winning percentage, or about 93 wins in a 162-game schedule (93–69). Put another way, more than 40% of all Player Game Points (1–.576) would be zeroed out in a system that credited no player wins in team losses (or player losses in team wins). That’s simply too much for me to be comfortable making such an adjustment.
There are two reasons why such a large percentage of plays do not contribute to victory. First, it is indicative, I think, of the fairly high level of competitive balance within major league baseball. Even very bad MLB teams are not that much worse than very good ones.
But the other reason why such a large percentage of plays do not contribute to victory, and why I assign player wins even in team losses and vice-versa, is because of the rules of baseball. Because there is no clock in baseball, the only way for a game to end is for even the winning team to do some things that reduce its chances of winning: it has to make three outs per inning for at least four innings. Likewise, a losing team is guaranteed to do some things that increase its chance of winning: it must get the other team out three times per inning.
My system still rewards players who do positive things that contribute to wins more favorably than players who do positive things that lead to losses. As I noted previously, an average team will amass a player winning percentage of approximately .576 in team wins (and .424 in team losses). By assigning two wins and only one loss in team wins, however, players will amass a .667 player winning percentage in team wins (and .333 in team losses). So, player wins that lead to team wins will still be more valuable than player wins that happen in team losses. The latter are simply not worthless.
Relationship of Player Decisions to Team Decisions
Under my system, to move from players’ team-dependent won-lost records (pWins and pLosses) to a team won-lost record, one subtracts out what I call “background wins” and “background losses”. One-third of a player decisions are background wins and one-third of a player decisions are background losses. Mathematically, then, if the sum of the team-dependent won-lost records of the players on a team is W (wins) and L (losses), then the team won-lost record will be as follows:
Team Wins = W–((W + L) / 3); Team Losses = L–((W + L) / 3)
As some practical examples, a team of .500 players will be a .500 team (of course), but, for example, a team of 0.510 players (e.g., 248–238) will be a .530 team (86–76 in a 162-game season), and a team of .550 players (e.g., 267–219) will be a .650 team (105-57). At the other extreme, a team of .400 players (e.g., 194–292) will be a .200 team (32–130).
Basic Results: pWins and pLosses, eWins and eLosses
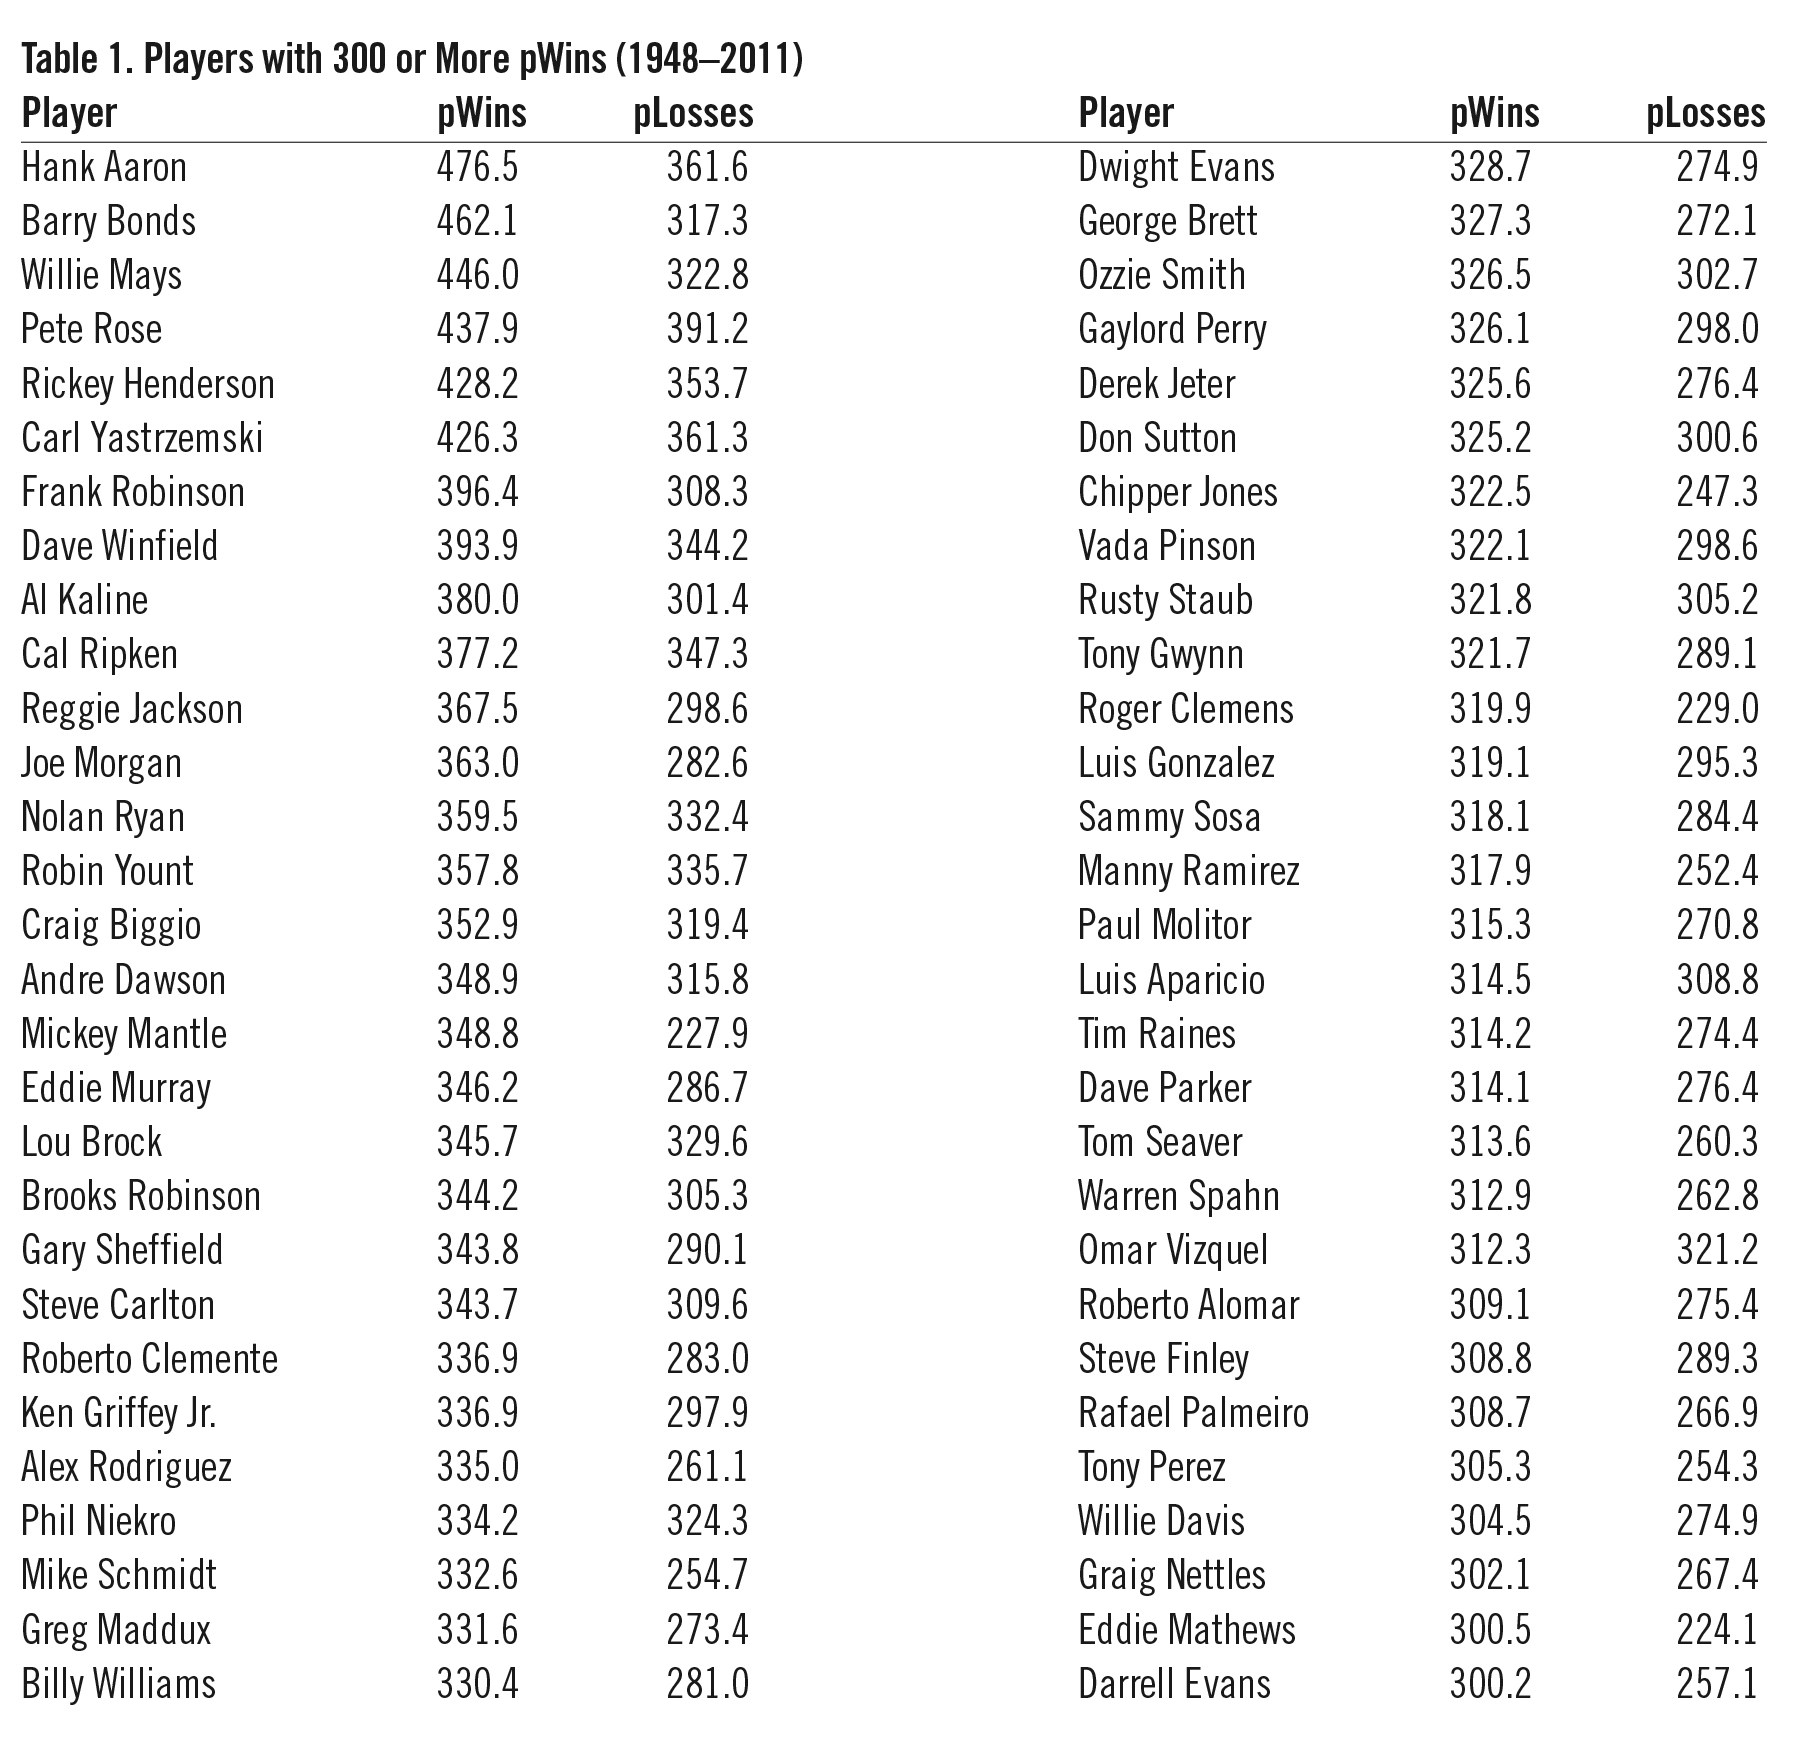
As mentioned, player wins (pWins) end up being on a similar scale to traditional pitcher wins: 20 wins is a very good season total, 300 wins is an excellent career total.
There are a total of 58 major-league players who have accumulated 300 or more pWins over games for which Retrosheet has released play-by-play data (1948–2011). They are shown in Table 1.
Table 1: Players with 300 or more pWins (1948-2011)
(Click image to enlarge)
Accumulating 300 pWins is certainly a noteworthy accomplishment. But it’s fairly clear looking at Table 1 that the list of the top players in pWins is not necessarily a list of the best players, period. For example, while Omar Vizquel and Rusty Staub both had fine, noteworthy major-league careers, did they really have better careers than, say, five-time Cy Young winner Randy Johnson, who “only” amassed 282.8 pWins in his illustrious career?
Comparing Players across Positions
Player won-lost records are an excellent overall measure of player value. When context and the effects of teammates are controlled for, player won-lost records can also, in my opinion, serve as an excellent starting point for measuring player talent. As a means of comparing players who play different positions, however, raw player won-lost records are not necessarily an ideal comparative tool.
In constructing player won-lost records, all events are measured against expected, or average, results across the event. Because of this, fielding player won-lost records are constructed such that aggregate winning percentages are .500 for all fielding positions. Hence, one can say that a shortstop with a defensive winning percentage of .475 was a below-average defensive shortstop and a first baseman with a defensive winning percentage of .510 was an above-average defensive first baseman, but there is no basis for determining which of these two players was a better fielder—the below- average fielder at the more difficult position or the above-average fielder at the easier position.
From an offensive perspective, batting player won-lost records are constructed by comparing across all batters, not simply batters who share the same fielding position. In the National League, this means that offensive comparisons include pitcher hitting, so that, on average, non-pitcher hitters will be slightly above average in the National League, while, of course, because of the DH rule, the average non-pitcher hitter will define the average in the American League.
These are, in fact, two sides of the same coin. There is a nearly perfect negative correlation between the average offensive production at a defensive position and the importance and/or difficulty associated with playing that position. That is, players at the toughest defensive positions tend to be weaker hitters than players at easier defensive positions.
When comparing, for example, a left fielder to a shortstop, one has to somehow balance the fact that left fielders are expected to hit better than shortstops against the fact that shortstops are, on average, better defensive players than left fielders.
There are three ways to do this:
(1) One can adjust offensive player won-lost records based on the defensive position of the player,
(2) One can adjust defensive player won-lost records based on the defensive position of the player, or
(3) One can adjust the baseline against which players are measured.
I believe that the best choice is the third one, measuring players against different baselines based on the position(s) which they played.
Unique positional averages by position are calculated by season. A positional average winning per- centage is then constructed for each individual player based on the positions at which the player accumulated his wins and losses.
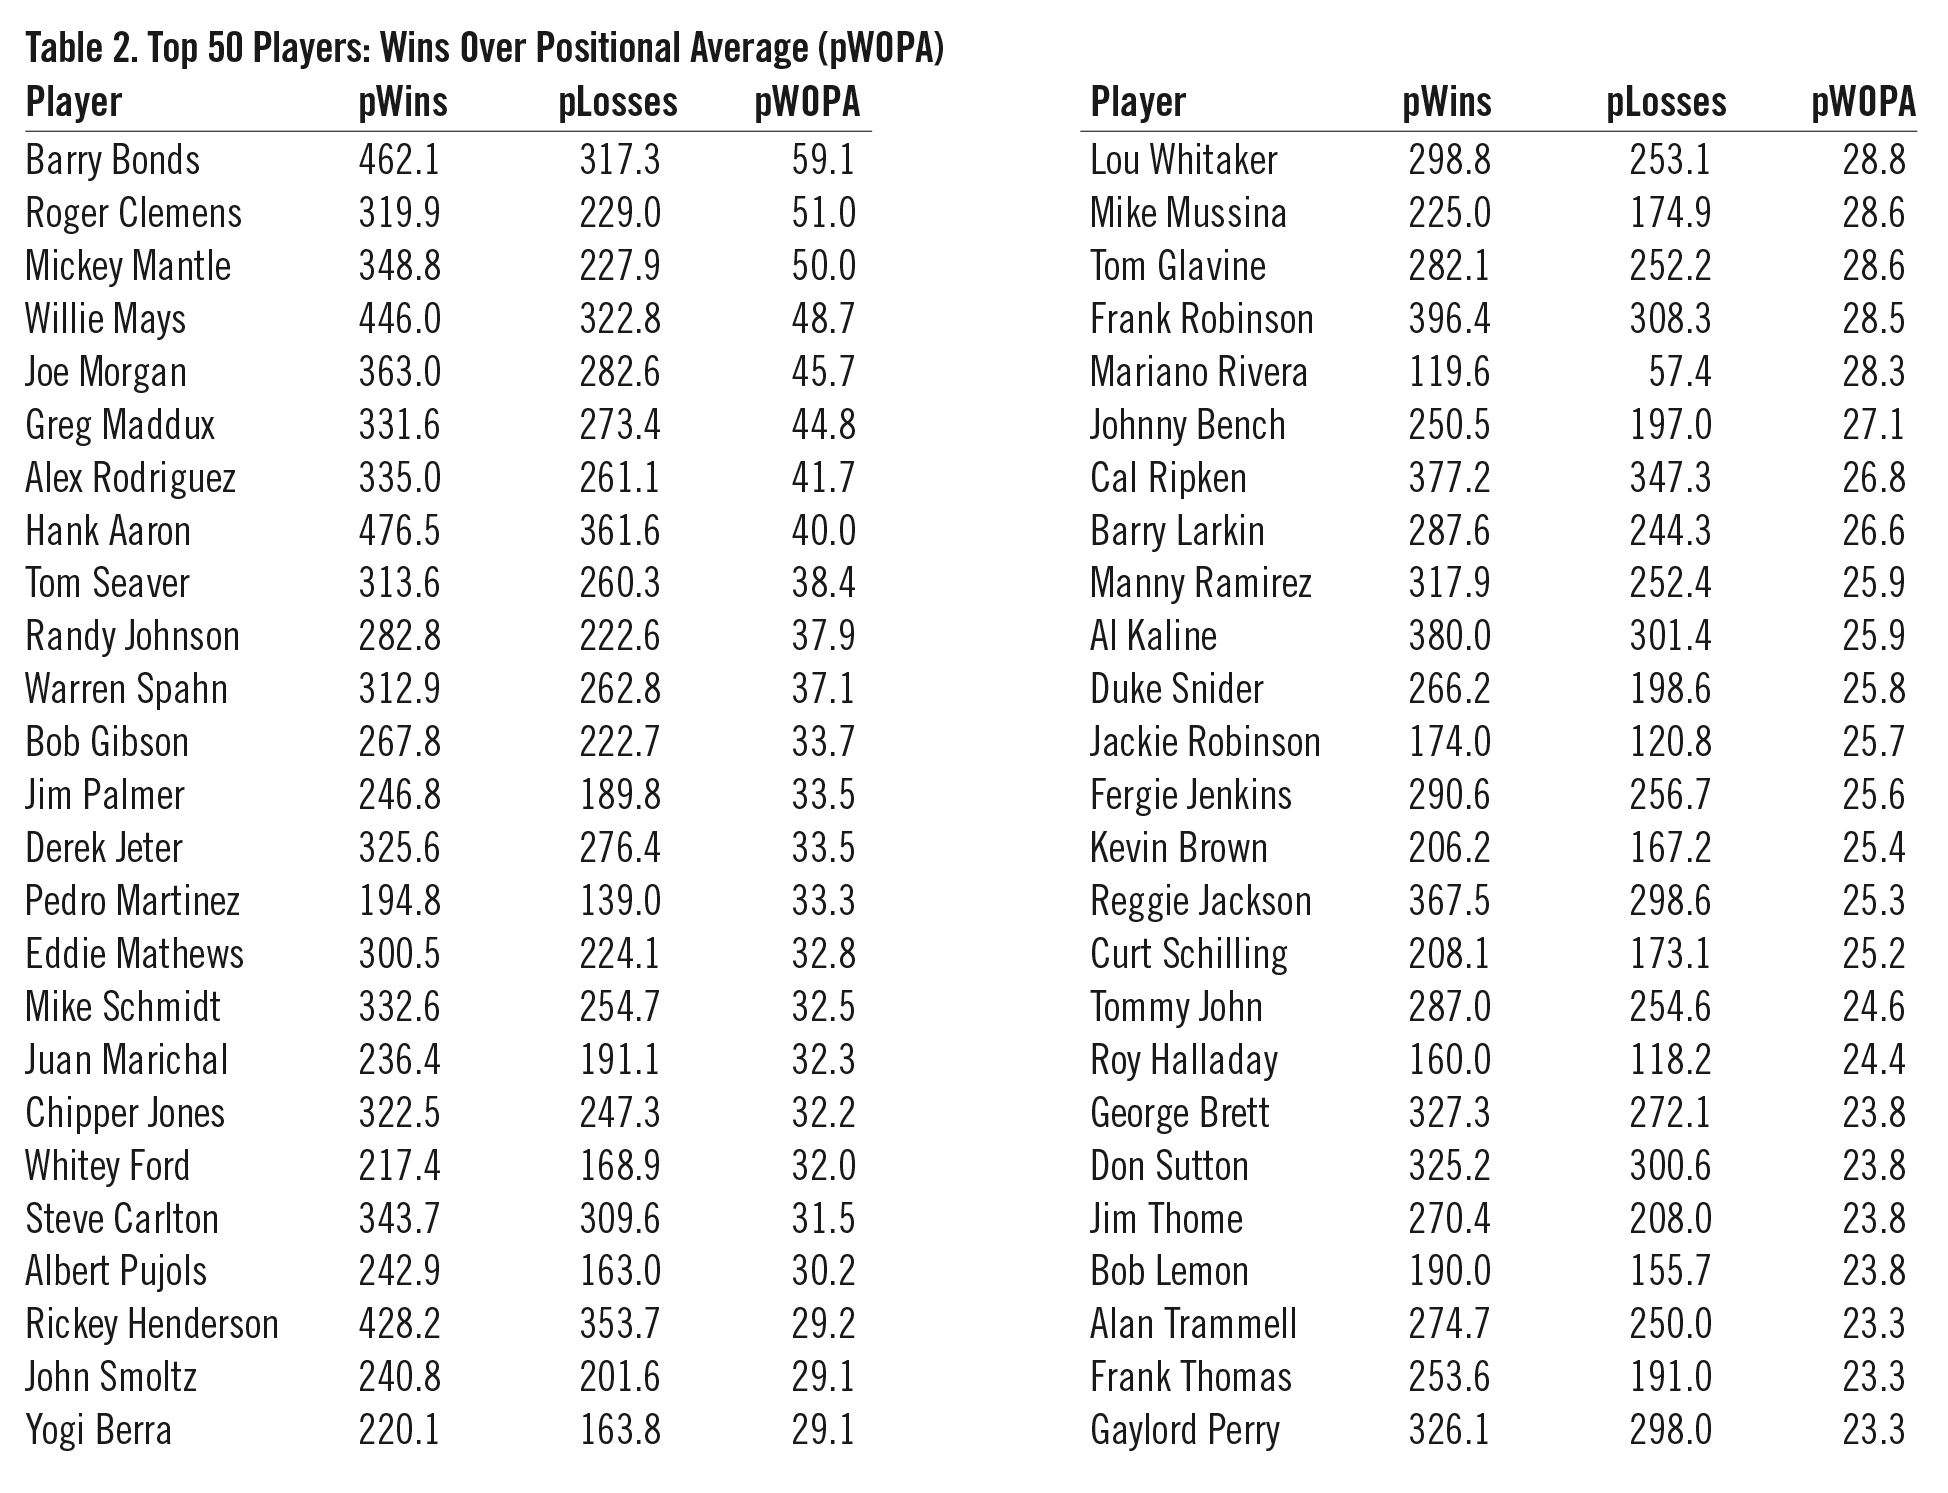
The top 50 players in career pWins over positional average (pWOPA) over the Retrosheet Era (1948–2011) are shown in Table 2.
Table 2: Top 50 Players: Wins Over Positional Average (pWOPA)
(Click image to enlarge)
Focusing on players’ wins above average helps to highlight players who had relatively short but brilliant careers, players like Pedro Martinez, whose 194.8 career pWins rank a fairly low 325th in the Retrosheet Era, while his 33.3 pWOPA ranks a much more impressive 15th, or Mariano Rivera, whose 119.6 pWins rank even lower than Pedro’s (914th) but who ranks 30th in career pWOPA with 28.3.
Wins over Replacement Level
Replacement level is the level of performance a team should be able to get from a player it can find easily on short notice—such as a minor-league call-up or a veteran waiver-wire pickup. Big league players only have value to a team above what the team could get from pulling players off the street. There is no real marginal value to having a third baseman make routine plays, since if a major league team were to lose its starting third baseman, it could and would fill the position with somebody who would, in fact, at least make those routine plays at third base. This is similar to the economic concept of opportunity cost.3
For my work, I define replacement level as equal to a winning percentage one weighted standard deviation below positional average, with separate standard deviations calculated for pitchers and non-pitchers. Unique standard deviations are calculated in this way for each year. These standard deviations are then applied to the unique positional averages of each individual player. Overall, this works out to an average replacement level of about .448 (.454 for non-pitchers, and .437 for pitchers). A team of .448 players would have an expected winning percentage of .343 (56–106 over a 162-game season).
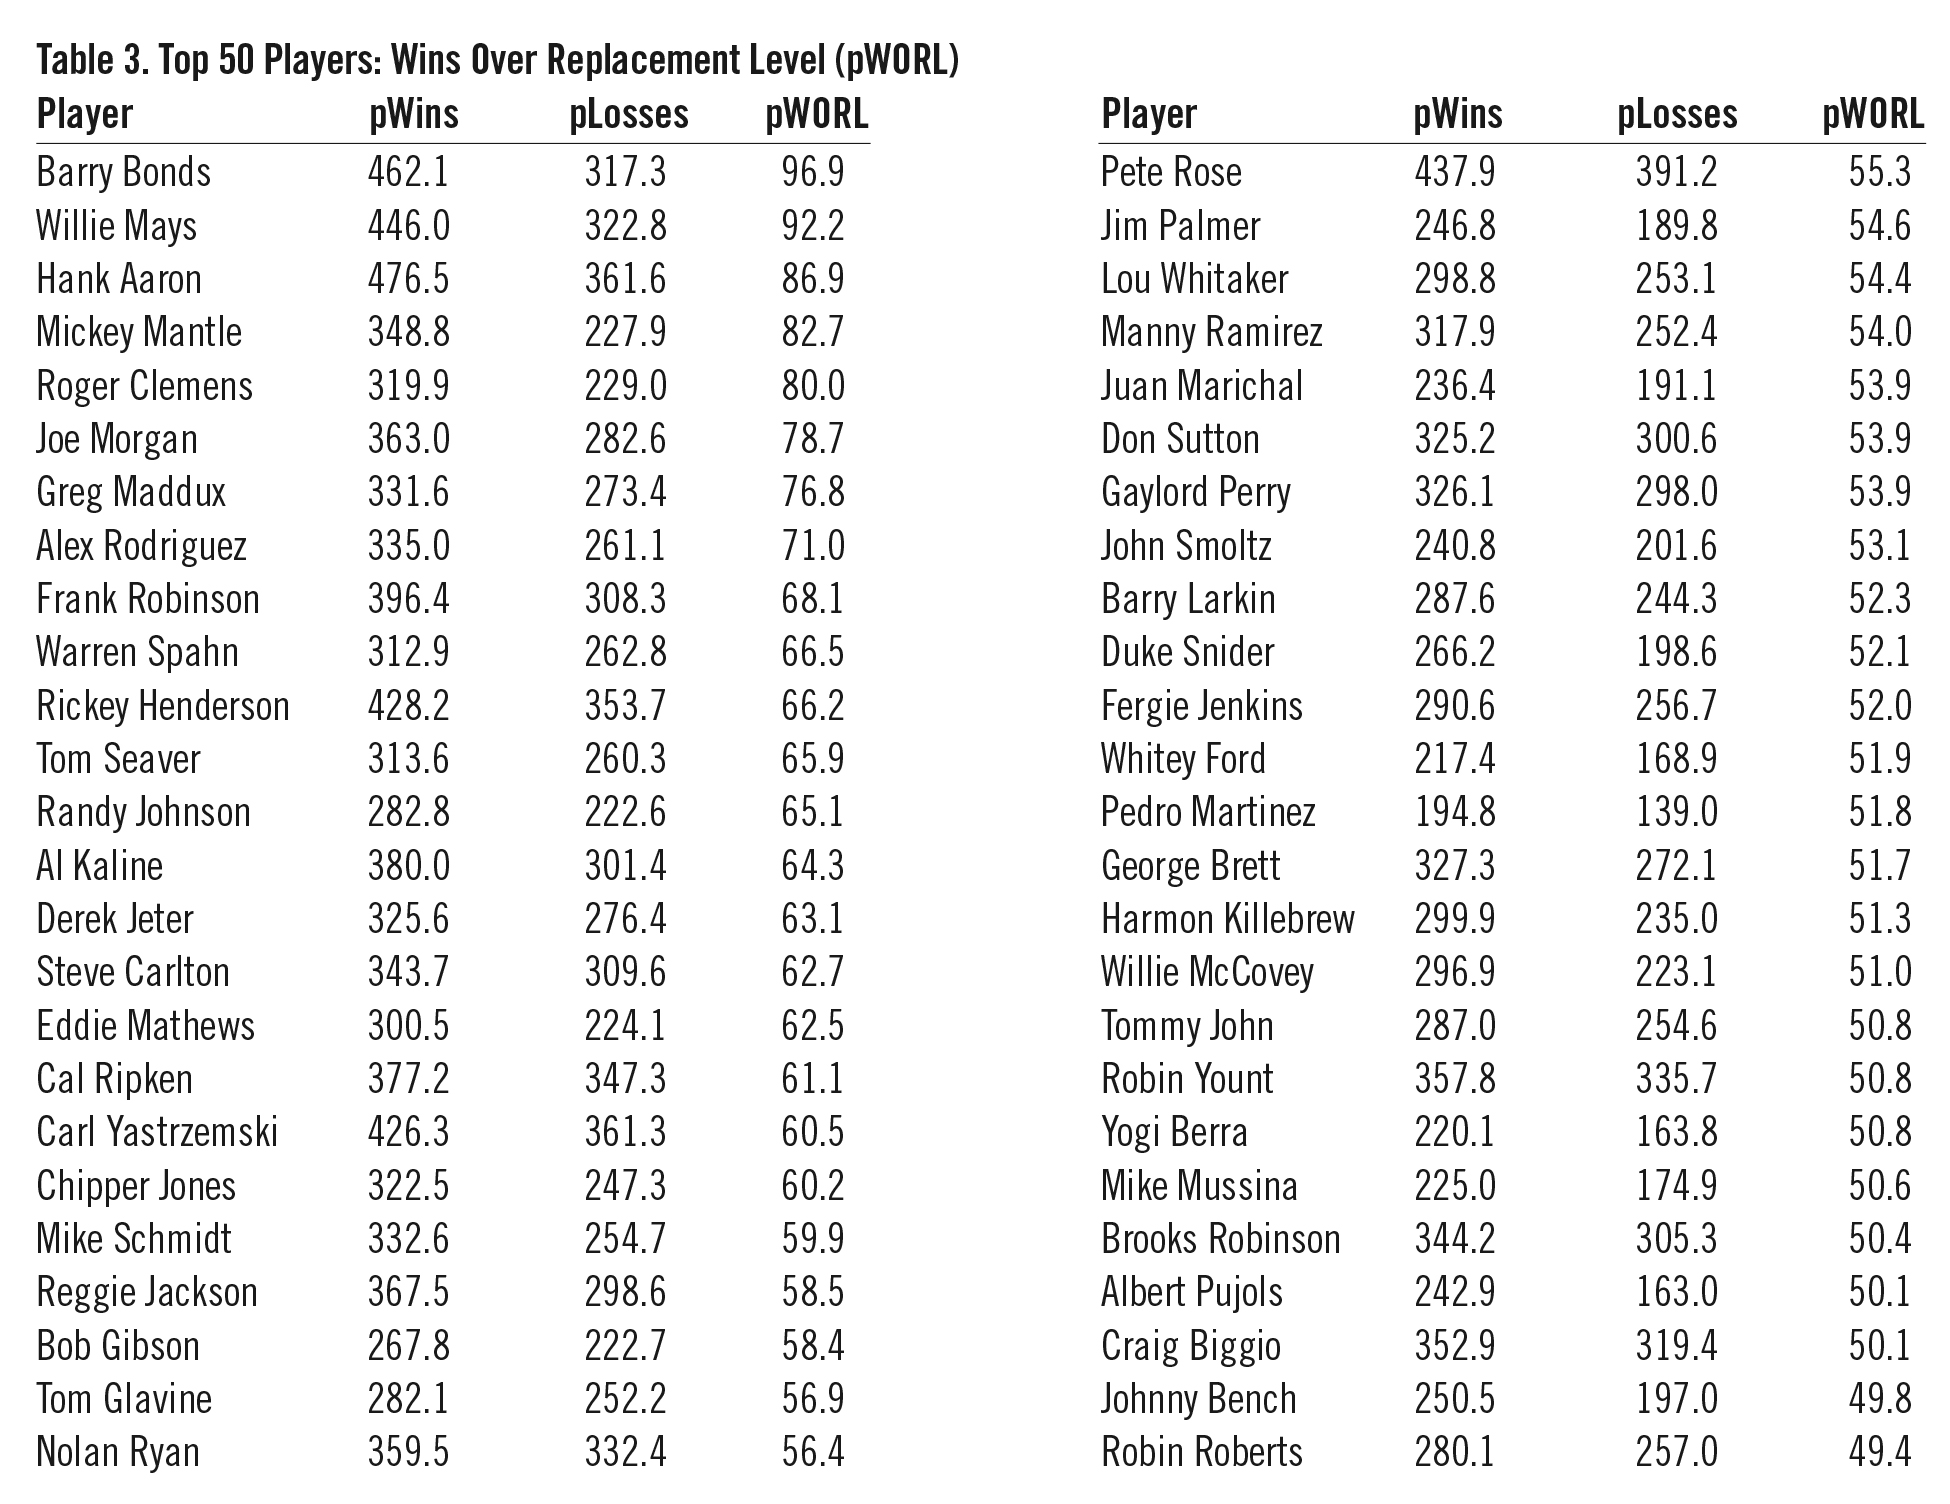
The top 50 players in career pWins over replacement level (pWORL) over the Retrosheet Era (1948– 2011) are shown in Table 3.
Table 3: Top 50 Players: Wins Over Replacement Level (pWORL)
(Click image to enlarge)
Measuring against replacement level instead of a verage helps to weed out pure compilers (such as Rusty Staub) while showing a mix of short, excellent careers (e.g., Pedro Martinez) together with long, more modestly above-average careers, such as Brooks Robinson.
Player Won-Lost Records as an Analytical Tool
Player wins and losses are calculated using a nine-step process, each step of which assumes average performance in all subsequent steps. There are four basic positions from which a player can contribute toward his baseball team’s probability of winning: batter, baserunner, pitcher, and fielder. Player decisions are allocated to each of these four positions, as appropriate, within each of nine components.
Component 1: Basestealing
Player decisions are assessed to baserunners, pitchers, and catchers for stolen bases, caught stealing, pickoffs, and balks.
Component 2: Wild Pitches and Passed Balls
Player decisions are assessed to baserunners, pitchers, and catchers for wild pitches and passed balls.
Component 3: Balls not in Play
Player decisions are assessed to batters and pitchers for plate appearances that do not involve the batter putting the ball in play: i.e., strikeouts, walks, and hit-by-pitches.
Component 4: Balls in Play
Player decisions are assessed to batters and pitchers on balls that are put in play, including home runs, based on how and where the ball is hit.
Component 5: Hits versus Outs on Balls in Play
Player decisions are assessed to batters, pitchers, and fielders on balls in play, based on whether they are converted into outs or not.
Component 6: Singles versus Doubles versus Triples
Player decisions are assessed to batters, pitchers, and fielders on hits in play, on the basis of whether the hit becomes a single, a double, or a triple.
Component 7: Double Plays
Player decisions are assessed to batters, baserunners, pitchers, and fielders on ground-ball outs in double-play situations, based on whether or not the batter grounds into a double play.
Component 8: Baserunner Outs
Player decisions are assessed to batters, baserunners, and fielders on the basis of baserunner outs.
Component 9: Baserunner Advancements
Player decisions are assessed to batters, baserunners, and fielders on the basis of how many bases, if any, baserunners advance on balls in play.
As a result of this component-based calculation process, player won-lost records, as I calculate them, express the contributions of individual players (batters, pitchers, third basemen, etc.) and the impact of individual plays (stolen bases, ground outs, triples, etc.) in a common unit: wins (and losses).
In my work, I calculate two sets of player won-lost records: one tied to the context in which events happened and one which attempts to control for the context of a player’s performance (including the quality of his teammates). Comparisons between these two sets of records enable one to isolate the specific contextual factors that can affect player (and, hence, team) won-lost records. These factors are again expressed in the same common unit as individual player contributions: wins (and losses).
All of the various factors that contribute to winning major league baseball games—individual player performance, specific types of performance, the timing and context of a performance, the inter-relationships between teammates (or opponents)—can hence be decomposed and expressed in the same common unit. And that unit is the ultimate goal of all big-league players in all games: team wins and team losses.
Because of this, in my opinion, player won-lost records, as I calculate them, provide a wonderful analytical tool for analyzing and understanding many (if not most) aspects of player performance.
TOM THRESS is an economist who lives in Chicago with his wife and two sons. He has had baseball research published in the SABR Statistical Analysis Committee’s publication “By the Numbers”.
Author’s Note
The individual components of player won-lost records and more analyses, including contextual factors associated with player won-lost records and the complete player won-lost records for all the players and teams for whom Retrosheet has play-by-play data, are on the project website at http://baseball.tomthress.com. Because this analysis requires play-by-play data to be accurate, at this time my system can’t be applied to historical greats like Cobb, Wagner, or Ruth. I’m an optimist, though, so I’m hopeful that eventually Retrosheet will have play-by-play data going back far enough to someday include those players in my analysis.
Notes
1. Eldon G. Mills and Harlon Mills, Player Win Averages, originally published by A. S. Barnes (1970). This book is available for free download (as a PDF) at http://trace.tennessee.edu/utk_harlan/6/.
2. Ties are allocated as 1.5 Player Wins and 1.5 Player Losses for both teams.
3. Wikipedia defines “opportunity cost” as “the cost of any activity measured in terms of the value of the next best alternative forgone (that is not chosen).” See http://en.wikipedia.org/wiki/Opportunity_cost.