

The Effect of the Designated Hitter Rule on Hit Batsmen
This article was written by Lee A. Freeman
This article was published in 2004 Baseball Research Journal
When the Designated Hitter (DH) rule went into effect at the start of the 1973 season, Major League Baseball (MLB) changed in more ways than one. Among the many changes across offense and defense was the effect that the DH had, and continues to have, on pitchers and hit batsmen. Previous writings and the raw data have contended that the DH rule has caused more American League (AL) hitters to be hit by pitches than their National League (NL) counterparts due to the AL pitchers not facing possible retribution for their actions. While more AL batters are hit by pitches, this paper rejects the notion that the increase in hit batsmen is a result of this retribution theory. A much simpler explanation will be presented and supported through analysis of the data.
INTRODUCTION
In 1973, Major League Baseball (MLB) introduced the Designated Hitter (DH) rule, and the American League (AL) adopted it. Rule 6.10 of Major League Baseball reads in part:
A hitter may be designated to bat for the starting pitcher and all subsequent pitchers in any game without otherwise affecting the status of the pitcher(s) in the game. A Designated Hitter for the pitcher must be selected prior to the game and must be included in the lineup cards presented to the Umpire in Chief.
The rule goes on to state, among other things, that the DH is not a mandatory rule, meaning that a team could have its pitcher(s) bat if it so desires.
Over the last 30+ years, numerous individuals have written about the DH and its effect on the game of baseball, both positively and negatively. Many feel it has ruined the essence of the game, while others feel it has enhanced the offensive production and thereby made the game more fun to watch. A sampling of these arguments can be found by searching on “designated hitter” on any Internet search engine.
HBP (Hit by Pitch)
Whatever one believes about the DH, examining the actual pitching and batting statistics should reveal how the DH rule has changed the game of baseball, if at all. In particular, these statistics show how the DH rule has changed the way pitchers in the two leagues pitch to batters. Goff et al. (1997) looked at these statistics from the perspective of moral hazard theory. They found that American League pitchers hit statistically more batters than their National League (NL) counterparts following the introduction of the DH rule in 1973. The authors concluded that there was a moral hazard in the AL as a result of the pitchers not batting and therefore not facing possible retribution for their actions. From an economic perspective, NL pitchers bear more of the costs of their actions.
Goff et al. analyzed Hit by Pitch (HBP) data through 1990, thereby using only 18 years of data with the DH rule in effect in the American League (1973-1990, inclusive). The authors stated that after controlling for at-bats, “American League batters have been hit by pitches at rates 10% to 15% higher than their National League counterparts in the typical post-DH season,” (Goff et al., 1997, p. 555). This statement is based on “ballpark” (no pun intended) numbers of batters hit by pitches prior to the implementation of the DH, and the 10% to 15% increase is only a rough translation of the differences in the post-DH era.
A year later, two papers published in Economic Inquiry reported additional statistical analyses of the HBP data, mostly in response to Goff et al.’s (1997) paper. Trandel et al. (1998) offered a cost-benefit explanation for the differences in the two leagues’ hit by pitch numbers. They argued that more batters are hit in the American League because there are more benefits to hitting a DH than hitting a pitcher, as the DH will likely do more damage offensively. Levitt (1998) agreed with this assessment, but only used data from 1993-1996. Goff et al. (1998) responded to these two papers stating that their analysis and interpretation was correct for the period of 1973- 1990, and it still holds, for the most part, following 1990. In a follow-up article several years later, Trandel (2004) showed no significant retaliation effect in the HBP data, implying that neither Moral Hazard theory or Cost-Benefit theory holds.
Given the complexities of baseball, it seems unlikely that the increase in hit batsmen in the American League in the post-DH era can solely be attributed to Goff et al.’s and Trandel et al.’s discussions of costs and retribution. Another causal factor for the increase in hit batsmen could be related to the number of “true hitters” faced by the pitchers in each league. While pitchers in the National League hit the occasional home run and provide support in other ways to help their team offensively, most NL teams operate under the assumption that when facing a batting pitcher, the pitcher will strike out, sacrifice bunt, or get out in some other manner (ground ball to the infield, outfield fly, fielder’s choice, etc.).
These batting pitchers are not viewed in the same way by the opposition as a “true” ninth hitter in the lineup. However, in the AL, with the DH in effect, all nine batters in the lineup are “true hitters,” and in many cases, the DH is one of the top hitters in many statistical categories (e.g., home runs and RBIs) for his team and surely has a higher batting average than most, if not all, NL pitchers.
Perhaps the HBP statistics can be looked at a bit differently for proper comparison. Taking the moral hazard discussion one step further, not only would National League pitchers be less likely to hit a batter due to the potential retribution when his team and/or he is at the plate, NL pitchers would be even less likely to hit the opposing pitcher, as retribution would be practically guaranteed.
Therefore, because American League pitchers face nine “true hitters” and National League pitchers face only eight “true hitters” (and would not want to hit the opposing pitcher anyway), perhaps the increase in AL hit batsmen is simply a result of more “true hitters” coming to bat. American League pitchers are not given the opportunity during the course of a game to “ease up” their delivery to the opposing pitcher.
As a result, AL pitchers are likely to “want” or “need” to pitch inside to more batters during the course of a game, thereby increasing the chances of these batters being hit by a pitch. Dave Smith of Retrosheet confirmed this assertion that NL pitchers are indeed hit by pitches much less often than their teammates, an argument made by Trandel (2004).
ANALYSES
All of the above necessitates a re-examination of the HBP data. Data were obtained from The Baseball Archive’s Lahman Baseball Database. All database manipulations, sorting, analyses, and statistical tests were completed by the author. Data from the American and National Leagues from 1901-2002 were pulled from the database. The data included (for each year and each league): the number of batters hit by pitches, the number of teams playing, the number of hit by pitches for batting pitchers, and the total number of at bats.
FULL DATA
Figure 1 shows the number of HBPs in each year for each league.
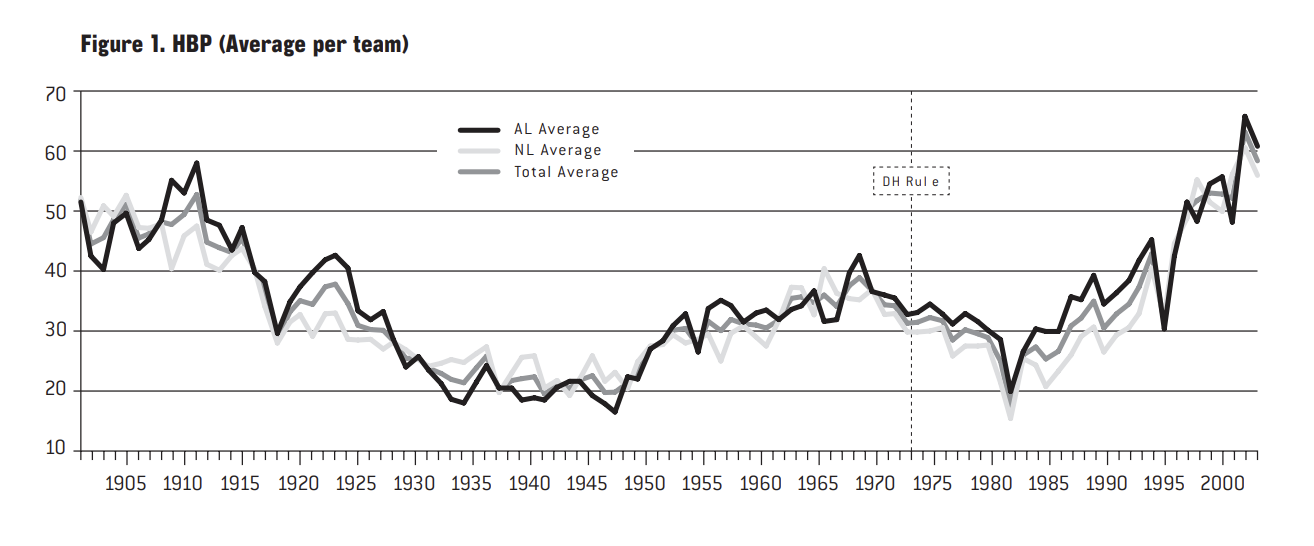
These numbers are the averages per team by controlling for the number of teams in the two leagues in any given year. At first glance, it seems that the two leagues are relatively the same—they have the same upward and downward trends over time; they have the same “spiked” years in 1911, 1981 (strike-shortened season), 1994 (strike-shortened season), and 2001; and they are both relatively close to the overall average. Following a general and slow downward trend from 1911-1947, there was a slight upward trend for the next 20 years, followed by a downward trend through the mid-1980s, culminating in a sharp upward trend over the last 17 seasons.
Looking at this same data from a different perspective yields more interesting results. If the National League average is subtracted from the American League average (AL AvgHBP– NL AvgHBP), the data result in the graph shown in Figure 2.
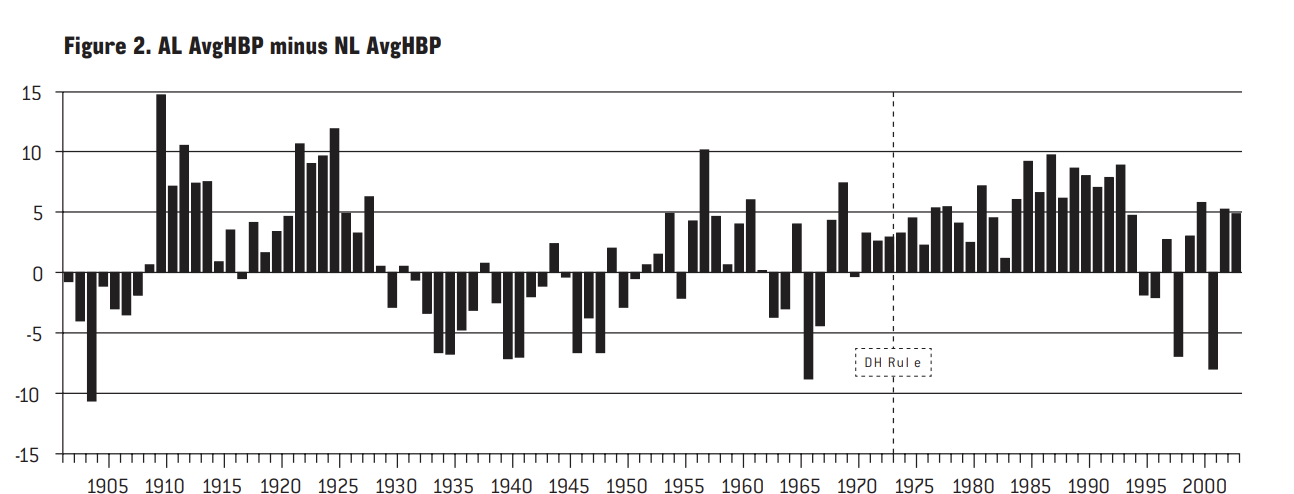
There is a period in the early 1900s (1908-1928) where the AL AvgHBP is consistently higher than the NL AvgHBP. This is followed by a period (1929-1950) where the NL AvgHBP is consistently higher than the AL AvgHBP. From 1950 through 2002, except for a short period in the mid-1960s and again in the mid-1990s, the AL AvgHBP is once again consistently higher than the NL AvgHBP. From Figure 2, it appears that American League pitchers have been consistently hitting batters more often than their National League counterparts long before the implementation of the DH rule in 1973.
Table 1
|
|
All Years |
72 Years |
30 Years |
Post-DH |
|
AL HBP |
355.28 |
282.28 |
280.53 |
530.50 |
|
NL HBP |
328.96 |
272.99 |
271.57 |
463.30 |
|
Total HBP |
684.25 |
555.26 |
552.10 |
993.80 |
|
AL AVG |
34.85 |
33.33 |
30.37 |
38.52 |
|
NL AVG |
32.91 |
32.32 |
29.62 |
36.55 |
|
Total AVG |
33.92 |
32.82 |
29.99 |
36.55 |
|
DIFFERENCE |
1.94 |
1.01 |
0.75 |
4.19 |
Table 1 provides the averages for the variables used in Figures 1 and 2 across four different time periods—the entire 102-year range, the 72 years prior to the DH (1901-1972), the 30 years prior to the DH (1943-1972), and the 30 years after the DH (1973-2002). The post-DH averages clearly show, especially when compared to the two different Pre DH time periods, a marked difference between the two leagues, both in pure numbers and in averages by team.
These data are further analyzed through a number of t-tests to determine the statistical significance (if any) of the differences between the two leagues over this 102-year period. The most common technique for analyzing differences between groups, t-tests create a statistic called the p-value that enables a comparison of the means between the groups.
Specifically, the p-value shows “the probability of error associated with rejecting the hypothesis of no difference between the two categories of observations (corresponding to the groups) in the population when, in fact, the hypothesis is true” (StatSoft). In other words, as the p-value nears zero, we are able to be more certain of there being a difference between the groups. Generally, a p-value of 0.05 or less is considered to be statistically significant.
The t-tests in the first set (first row of Table 2) compare the years prior to the DH (1901-1972) to the years following the DH (1973-2002) by looking at individual variables one-at-a-time. The t-tests in the second set (second row of Table 2) compare the 30 years prior to the DH (1943-1972) to the years following the DH (1973-2002), also by looking at individual variables one-at-a-time. Table 2 shows the p-values from these t-tests.
Table 2
|
|
72 Years |
30 Years |
|
AL HBP |
< 0.001 |
< 0.001 |
|
NL HBP |
< 0.001 |
< 0.001 |
|
Total HBP |
< 0.001 |
< 0.001 |
|
AL AVG |
0.030 |
< 0.001 |
|
NL AVG |
0.442 |
0.063 |
|
Total AVG |
0.118 |
0.007 |
|
DIFFERENCE |
0.002 |
0.003 |
These p-values indicate that following the introduction of the DH, there were significant differences in the total number of HBPs in the AL, the NL, and overall for both sets of comparisons. The left half of Table 1 shows these differences to be due to an increase in HBP in both leagues following the introduction of the DH.
When examining averages across teams, thereby controlling for the number of teams in each year, the American League saw significant changes in both comparison sets, and the change was due to an increase as would be expected. The National League saw no statistically significant change across either comparison set at the 0.05 level, indicating that the DH did not affect the NL AvgHBP numbers, even though the numbers saw an increase as well.
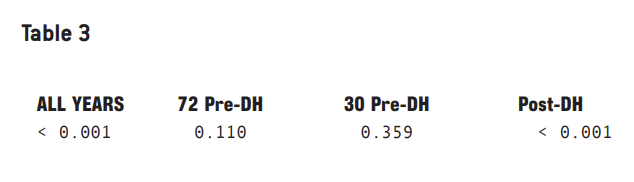
The t-tests in the third set compare the AL AvgHBP with the NL AvgHBP across each of the four time periods. These t-tests are calculated as Paired Two Sample, i.e. looking at the two leagues’ averages by comparing them on a year-by-year basis.
Table 3 shows the p-values from these tests. These values indicate that prior to the DH rule, the HBP numbers for AL and NL batters were not significantly different. After the DH rule, the numbers are significantly different, with the AL having higher numbers than the NL, as would be expected and previously discussed. At this point, the analyses reveal nothing new with regard to previous writings and conclusions.
“TRUE HITTERS” DATA
All of the above data are inclusive of every at bat in both leagues over 102 years. As mentioned before, with the DH in effect, American League teams send a lineup of nine “true hitters” to the plate, while National League teams send only eight “true hitters” to the plate. This is a 12.5% increase in the number of hitters from the National League to the American League.
With more “true hitters” at the plate in the AL, more of them are likely to be hit by a pitch due to NL pitchers not wanting or needing to pitch inside to batting NL pitchers (i.e., wanting to pitch more aggressively to the best hitters). Therefore, the same analyses were re-run after the following adjustments were made to the AL AvgHBP and NL AvgHBP numbers from the previous section: for all 102 years of data, the NL AvgHBP is divided by 8—the number of “true hitters” batting in a game; for all years prior to the DH, the AL AvgHBP is divided by 8—the number of “true hitters” batting in a game; for the 30 years with the DH, the AL AvgHBP is divided by 9—the number of “true hitters” batting in a game as a result of the DH. In addition, all incidents of pitchers being hit by a pitch from both leagues were removed from the dataset in order to only look at data for non-pitchers.
These adjusted new numbers show the averages per year per team in each league based on the number of “true hitters” appropriate to that particular league and year. Figure 3 is the same as Figure 2, but with the adjusted numbers.
Through 1972, the two figures show identical information (with different vertical axes) as both leagues batted 8 “true hitters” in each game. However, after 1973, 13 of the 30 years see more NL AvgHBPs than AL. In addition, for the last 10 years (1993-2002), the National League has more AvgHBPs in each year. During the same 30-year period in Figure 2, the National League had more AvgHBPs in only 4 of the 30 years. These numbers begin to tell a different story about HBP—namely, that the American League numbers may be higher simply because more “true hitters” come to the plate.
Tables 4-6 provide the same data and comparisons, with the adjusted data, as Tables 1-3 did with the original data. Table 4 provides the averages for the variables used in Figure 3 across the same four different time periods. As with Table 1 earlier, these numbers show marked increases in the number of HBPs in both leagues following the DH in 1973. However, unlike in Table 1, there is relatively no difference between the two leagues’ averages in the post-DH era (bottom row). In fact, the NL AvgHBP is higher than the AL AvgHBP by 0.01.
Table 4
|
|
AL HBP |
NL HBP |
Total HBP |
Adj. AL AVG |
Adj. NL AVG |
Diff. |
|
All Years |
355.28 |
328.96 |
684.25 |
4.20 |
4.11 |
.085 |
|
72 Pre DH |
282.28 |
272.99 |
555.26 |
4.17 |
4.04 |
.126 |
|
30 Pre DH |
280.53 |
271.57 |
552.10 |
3.80 |
3.70 |
.094 |
|
Post DH |
530.50 |
463.30 |
993.80 |
4.28 |
4.29 |
-.012 |
Table 5 shows the same statistical tests as Table 2, but now with the “true hitters” data. The left half of Table 5 is identical to the left half of Table 2, merely indicating that, in each league, there was a significant increase in the number of HBPs. However, when looking at the averages per team, and when these numbers are adjusted for “true hitters,” there are no significant differences in either league or in the difference between the leagues. While the raw numbers increased following the DH, the differences from that era to the time prior to the DH are not significantly different.
| AL HBP | NL HBP | Total HBP | Adj. AL Avg | Adj. NL Avg | Diff. | |
| 72 Pre-DH Yrs vs. Post-DH | <.001 | <.001 | <.001 | .672 | .422 | .300 |
| 30 Pre-DH Yrs vs. Post-DH | <.001 | <.001 | <.001 | .076 | .063 | .474 |
The t-tests in the third set compare the AL AvgHBP with the NL AvgHBP across each of the four time periods, as done previously with the original data. Table 6 shows the p-values from these tests. Here, too, there are no significant differences between the leagues during any of the four time periods.
Table 6
|
All Years |
72 Years |
30 Year |
Post DH |
|
.179 |
.110 |
.359 |
.912 |
Based on Figure 3 and Tables 4-6, the DH had no significant effect on the number of HBPs within or across leagues once the number of “true hitters” is accounted for. The analysis of “true hitters” provides a much simpler and cleaner explanation for the differences in HBP numbers across the leagues. It does not rely on any economic theories, but rests entirely in the mathematics of baseball and the number of batters faced in each game.
I should note limitations of these most recent analyses. First, by eliminating one of the batters from the line-up, the actual results of the games are skewed. Second, this type of analysis does not account for pinch hitters that likely enter the game in the late innings to bat for the pitcher (thereby increasing the actual number of “true hitters”), nor does it account for pitchers who have had above-average offensive ability (e.g., Mike Hampton and Rick Rhoden). However, pinch hitters consistently have lower batting averages than everyday hitters, so while they are more of an offensive force than a typical pitcher, they are less of one than an everyday player. Also, there have been too few pitchers with above-average offensive ability to warrant a change to any of the above analyses.
CONCLUSION
The data clearly show that AL batters are hit by pitches more often than their NL counterparts, when averaged across teams (Figures 1-2; Tables 1-3). Prior to the implementation of the DH rule in 1973, there was no significant difference in the number of HBPs between the two leagues. After 1973, there was a significant difference, as expected. In the Post DH era, the AL had an average of 12.2% more HBPs than the NL. This number is in line with Goff et al.’s (1997) “10% to 15% increase” discussed earlier.
Sources
The Baseball Archive <www.baseball1.com>
Goff, B.L., Shughart, W.F. II, & Tollison, R.D. “Batter Up! Moral Hazard and the Effects of the Designated Hitter Rule on Hit Batsmen,” Economic Inquiry 35:3, 1997, pp. 555-561.
Major League Baseball,<www.mlb.com>
The Stonegauge <abolishthedh.stonegauge.com>