

Wait Till Next Year? Some Analyses of Win-Loss Records, 1960-1998
This article was written by Robert Saltzman
This article was published in 2000 Baseball Research Journal
Having taught an introductory course on statistics for several years, I’d wondered if some basic statistical measurements could shed any light on the following questions.
1. Is the exhibition season a meaningful predictor of how well a team does in the regular season? Should newspapers even bother to report on preseason games?
2. How strong is the correlation between a team’s record at the All-Star break and its record at the end of the regular season? If it is strong, shouldn’t teams be more concerned about first half losses than they usually are?
3. If a team does well this year, is it likely to do well next year? Conversely, how hopeless is it for next year if a team fares poorly this year?
To address these issues, I looked at win-loss records from 1960 to the present, because several important structural changes have taken place in major league baseball during this time. First, the major leagues have expanded significantly since 1960. After maintaining sixteen teams during the preceding sixty years, the majors nearly doubled in size to thirty teams by 1998. Second, the amateur draft was instituted in 1965, giving all teams a chance to select from the same pool of talent. Then, in 1975, the landmark free agency ruling occurred, allowing a player to establish his right of free agency by playing out his option year without a signed contract. Ever since, key players have been able to move quickly from one team to another in search of the most favorable contract. These events raise a few additional questions:
- Has expansion diluted team strength so that team success is less predictable?
- Did the amateur draft really help to equalize the teams?
- Can we see the impact of free agency on the stability of team success?
In the analyses that follow, I measure a team’s “success” by its winning percentage (WP), rather than by its rank in the standings or number of games won, for several reasons. In general, WP is more informative than rank—given the WP of all teams we can determine their ranks, but not vice versa. Also, a team can have a very successful year yet not finish first. The 1993 Giants, for example, won 103 games (a .636 WP) but finished second to the Braves’ 104 wins (.642). Further, WP is a more consistent measure over the years than rank because the number of teams per league and per division has changed so many times. Finally, while WP and rank correlate quite well, WP is easier to work with statistically.
To answer the first question, I looked at the correlation between regular season WP and exhibition season WP (see Figure 1).

It’s easy to spot the Yankees, for example, who had both a good preseason (.556) and an extraordinary regular season (.704). Overall, the 1998 correlation coefficient (r) between regular season WP and exhibition season WP was only +0.39, although this was still considerably higher than usual. Figure 2 plots the correlation for each year from 1960 to 1998.
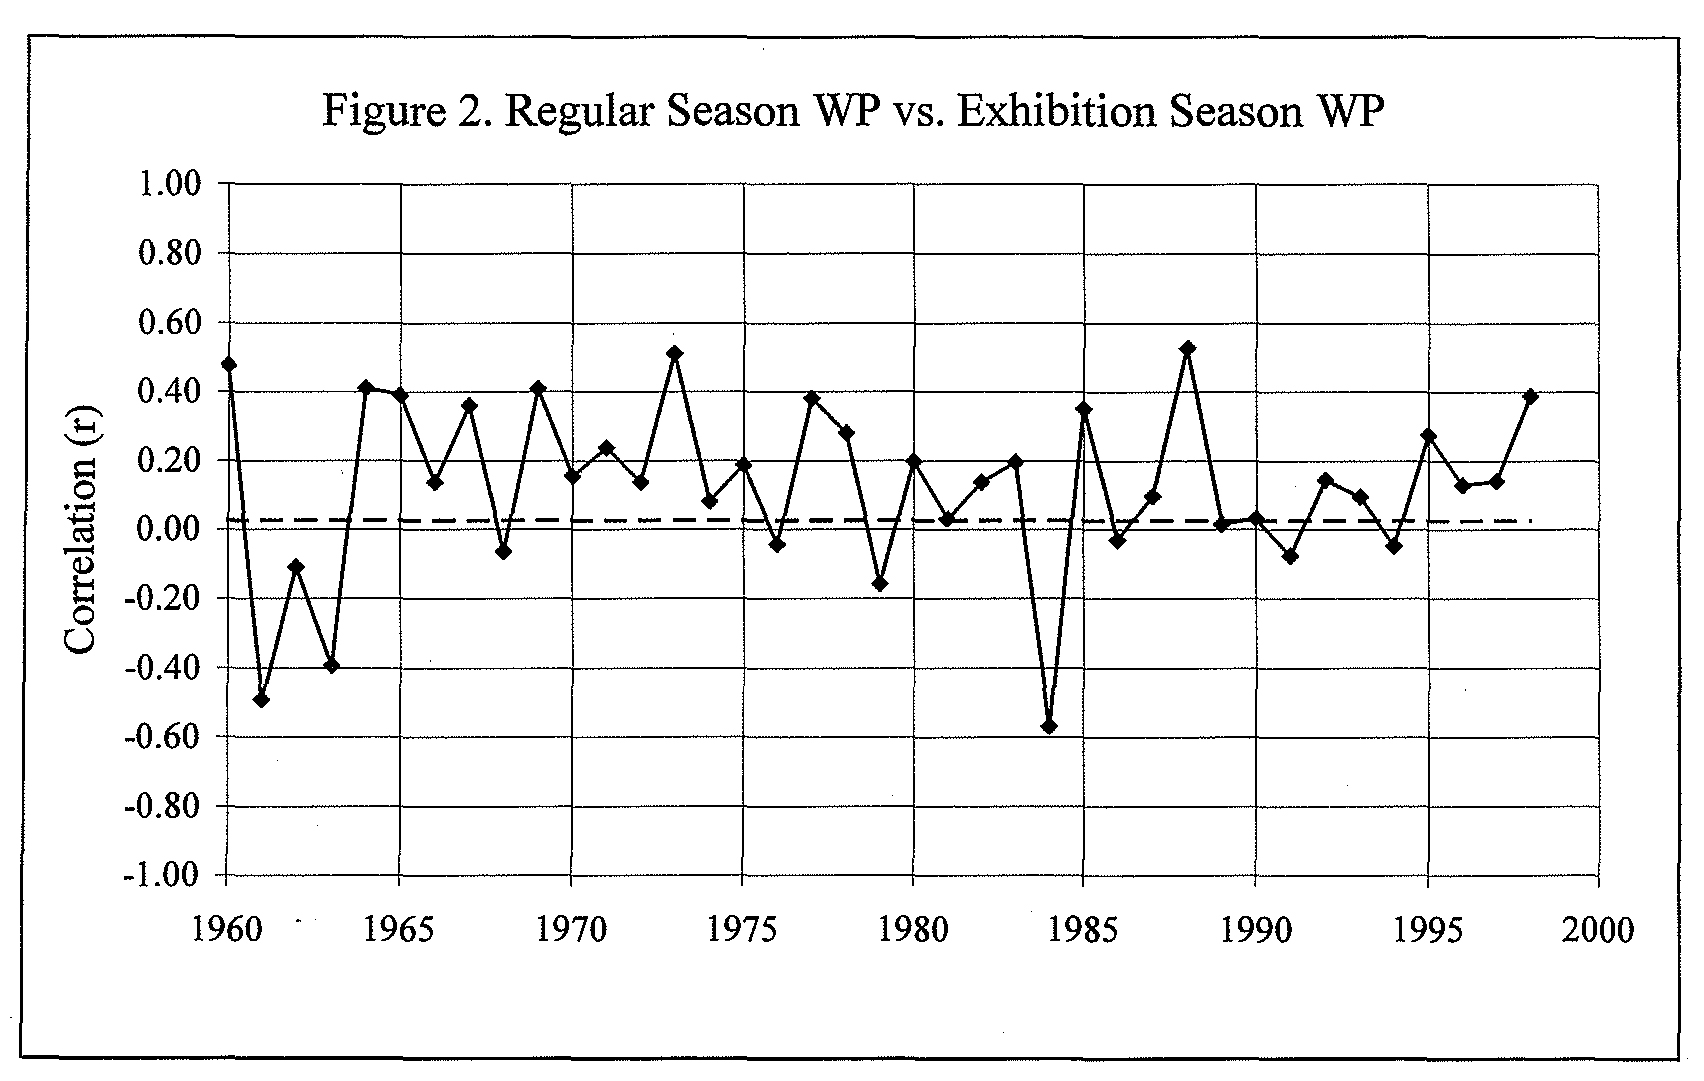
The median r value is +0.139. In other words, only about r2 = 2 percent of the variation in WP at the end of a typical season can be explained by the variation in preseason WP. In fact, the correlation was negative in ten of the thirty-nine years, implying that doing well in the preseason was actually associated with doing poorly in the regular season. One such year was 1961 (r = -0.49), in which the Yankees had the worst exhibition season WP in the American League but the best regular season WP, while the Senators had the best exhibition season WP but the worst regular season WP.
In terms of predicting regular season team success, the exhibition season is of no value: it’s statistically meaningless. There are probably a number of reasons for this, including the fact that players are still getting into shape during spring training and some of them don’t even make the regular season team. It’s also likely that players and managers don’t put maximum effort into winning games that don’t really count. Since regular season performance is essentially unrelated to what occurs in the exhibition season, my advice to newspapers would be: don’t bother sending reporters down to spring training games or even printing the exhibition season standings! Of course, I really wouldn’t want to forego all the spring training hoopla that relieves so many people from the long winter offseason.
For the second question, I looked at the correlation between regular season WP and WP at the All-Star break. Figure 3 shows a plot of all thirty teams that played in 1998.
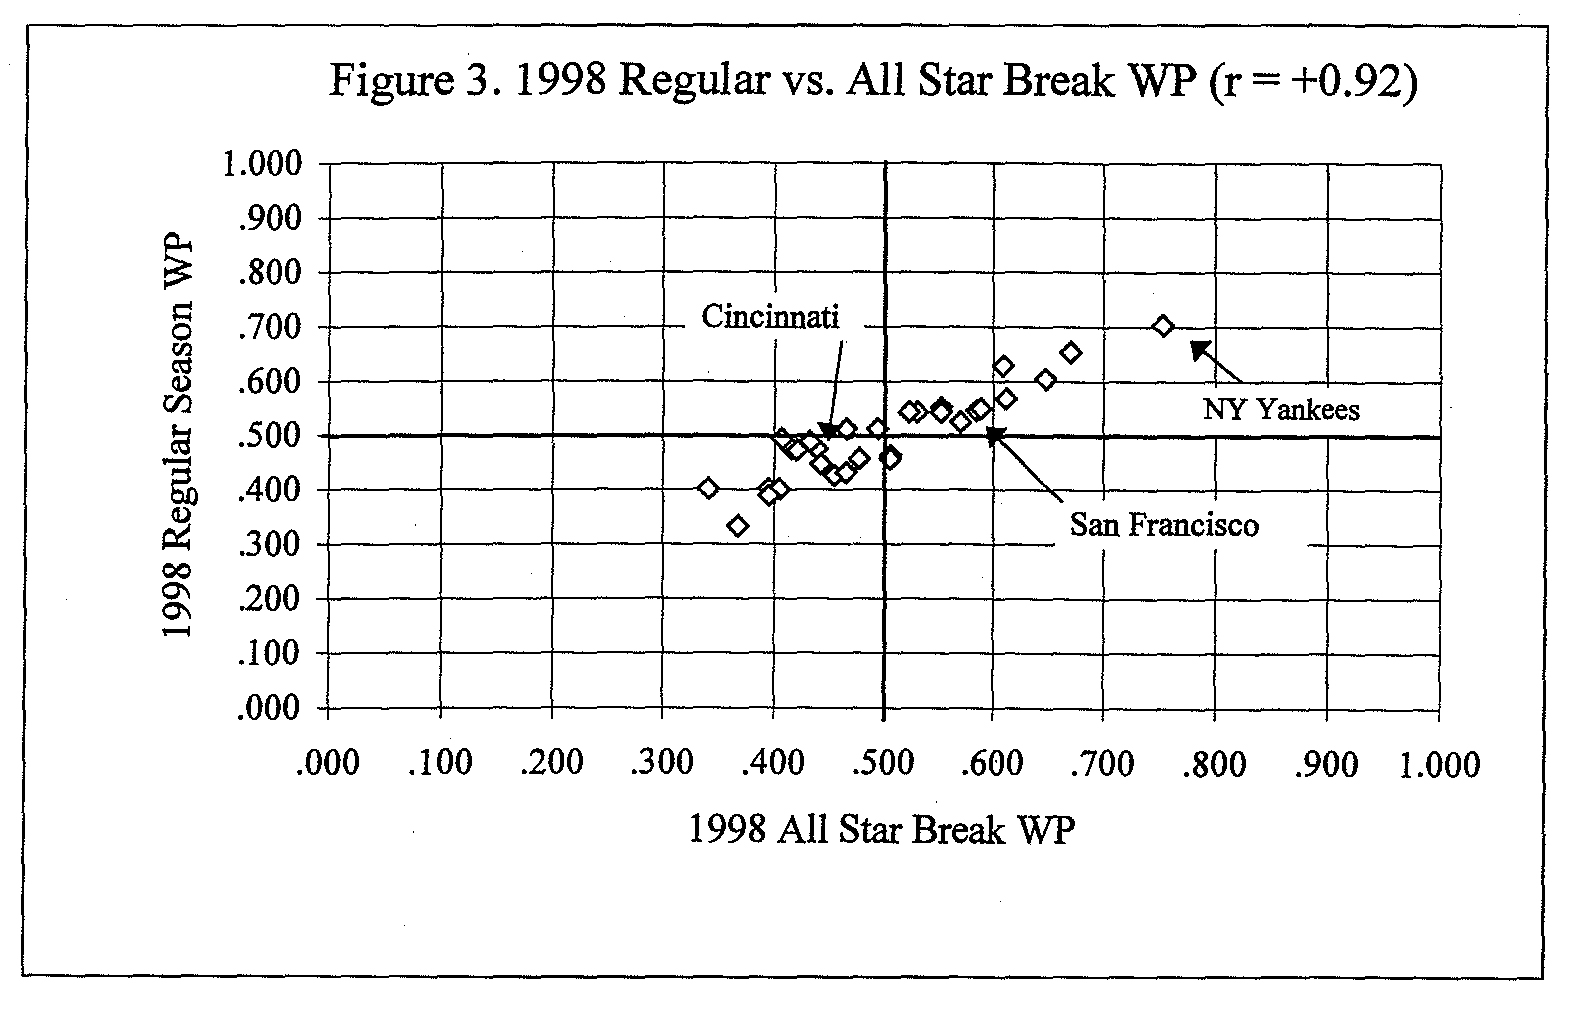
Here, the Yankees’ outstanding regular season (.704) was well underway by the All-Star Game (.753). Overall, the 1998 correlation was +0.92. Figure 4 plots the correlation in each year from 1960-1998, with a median value of r = +0.88.
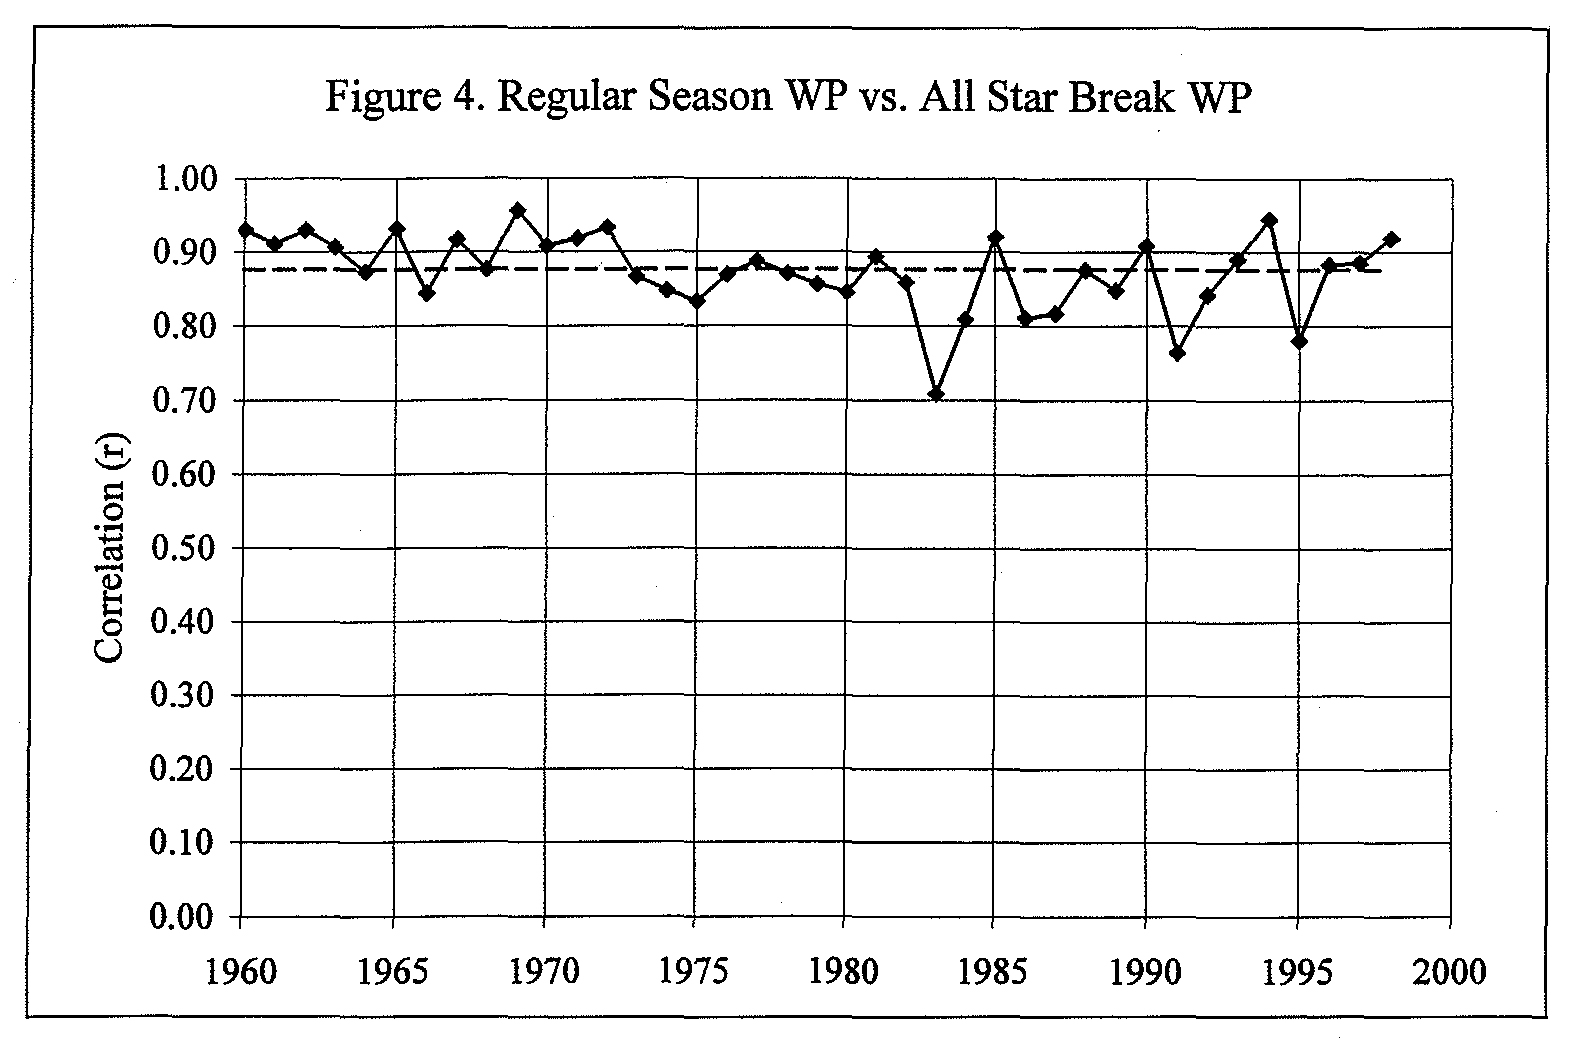
One way to interpret this value is that 77 percent of the variation in regular season success can be explained by the variation in team success during the first half of the season. This large percentage means that most teams do not significantly alter their WP during the second half of the season.
Teams that have done well (or poorly) in the first half tend to do about as well (or as poorly) over the entire season. It is perhaps for this reason that major league baseball has attempted to increase the drama of the second half by splitting into first two and now three divisions per league along with adding wild card playoff teams.
Occasionally, though, teams achieve a much different level of success by season’s end than they had reached by the All-Star break. The best and worst second half changes in WP since 1960 are listed in Tables 1 and 2, respectively.
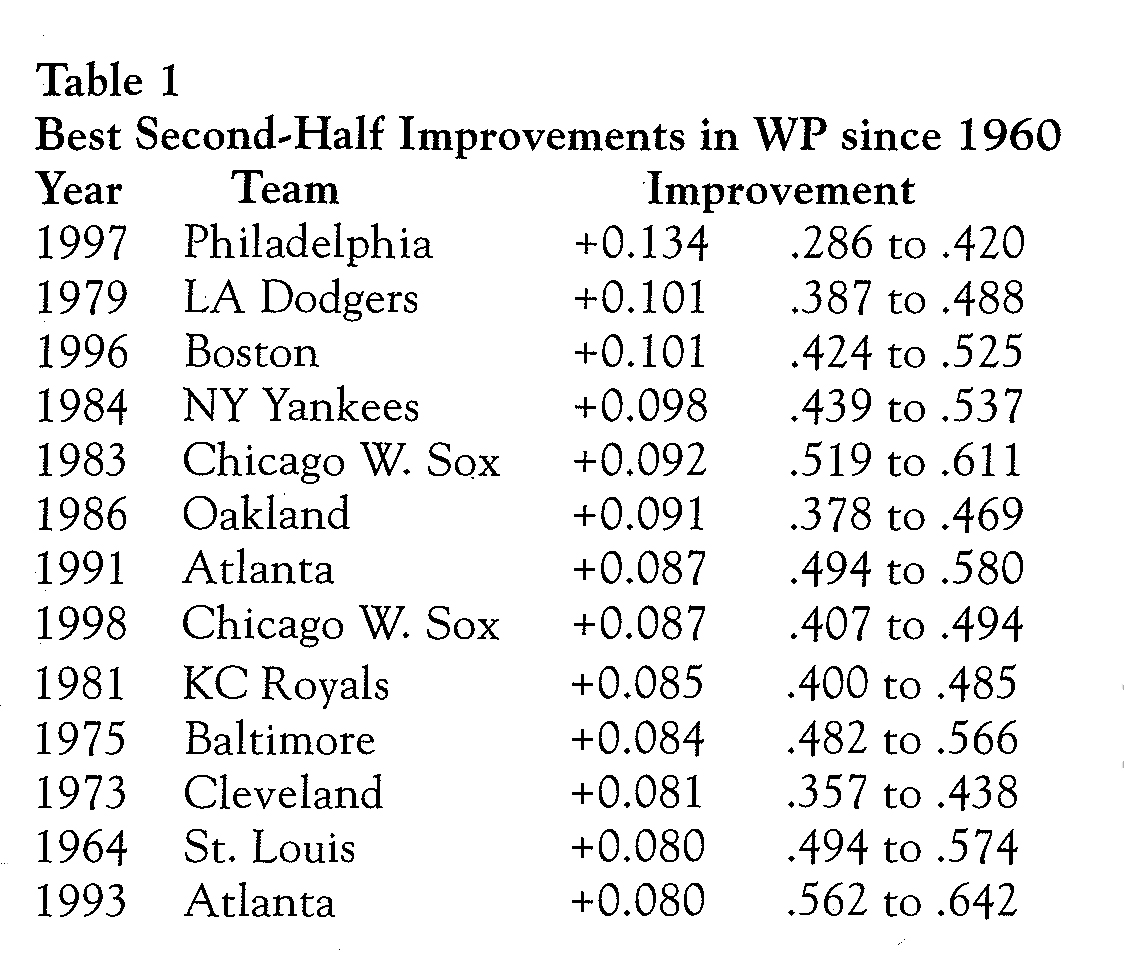

While most of the biggest improvements were made by teams who did not contend for first place, there have been some exciting second-half surges into first place. These include the 1983 White Sox (+.092) from third place, the 1991 Braves (+.087) from third place, the 1964 Cardinals (+.080), who dramatically came from fifth place to eventually win the World Series, and the 1993 Braves (+.080) from second. At the other extreme, notable second-half collapses by teams in first place at the All-Star break include those of the 1995 Phillies (-.103) to second place, the 1977 Cubs (-.102), to fourth place, and the 1978 Red Sox (-.080) to second place after a heartbreaking playoff loss to the Yankees.
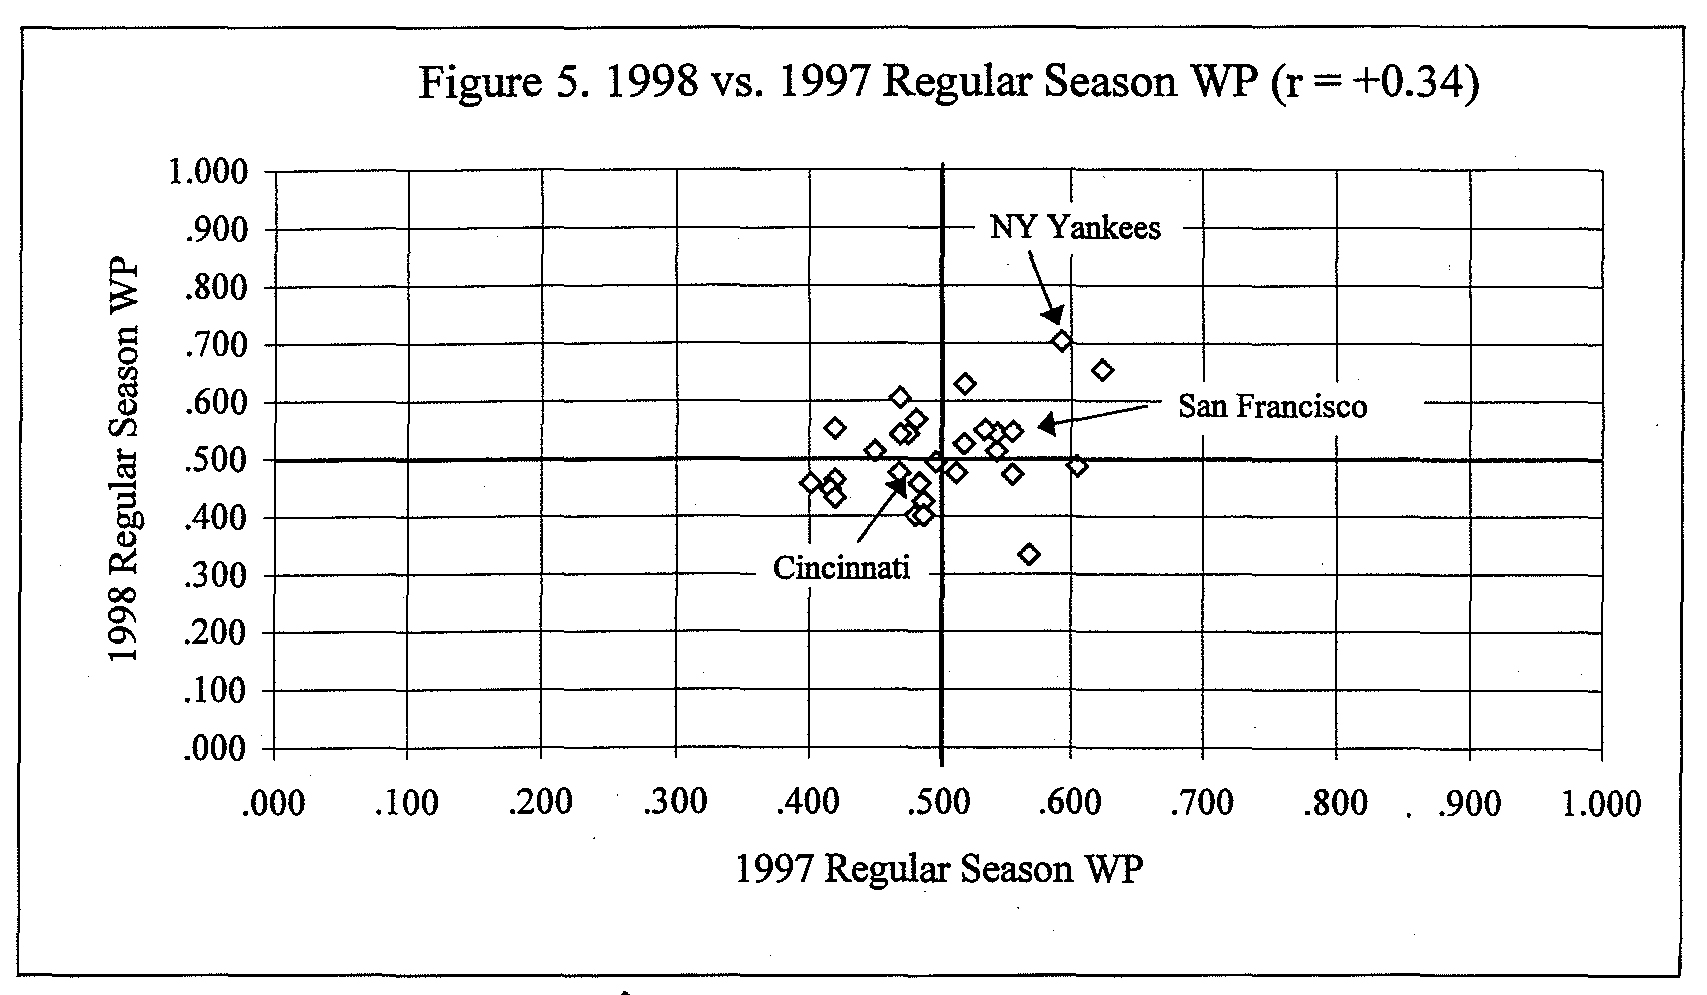
To address the third major issue, I looked at the correlation between regular season WP in one year and the preceding year. I give a plot of all thirty teams in Figure 5, which shows a weak correlation of +0.338 between 1997 and 1998 winning percentages. The data from 1960-1998 are plotted in Figure 6.
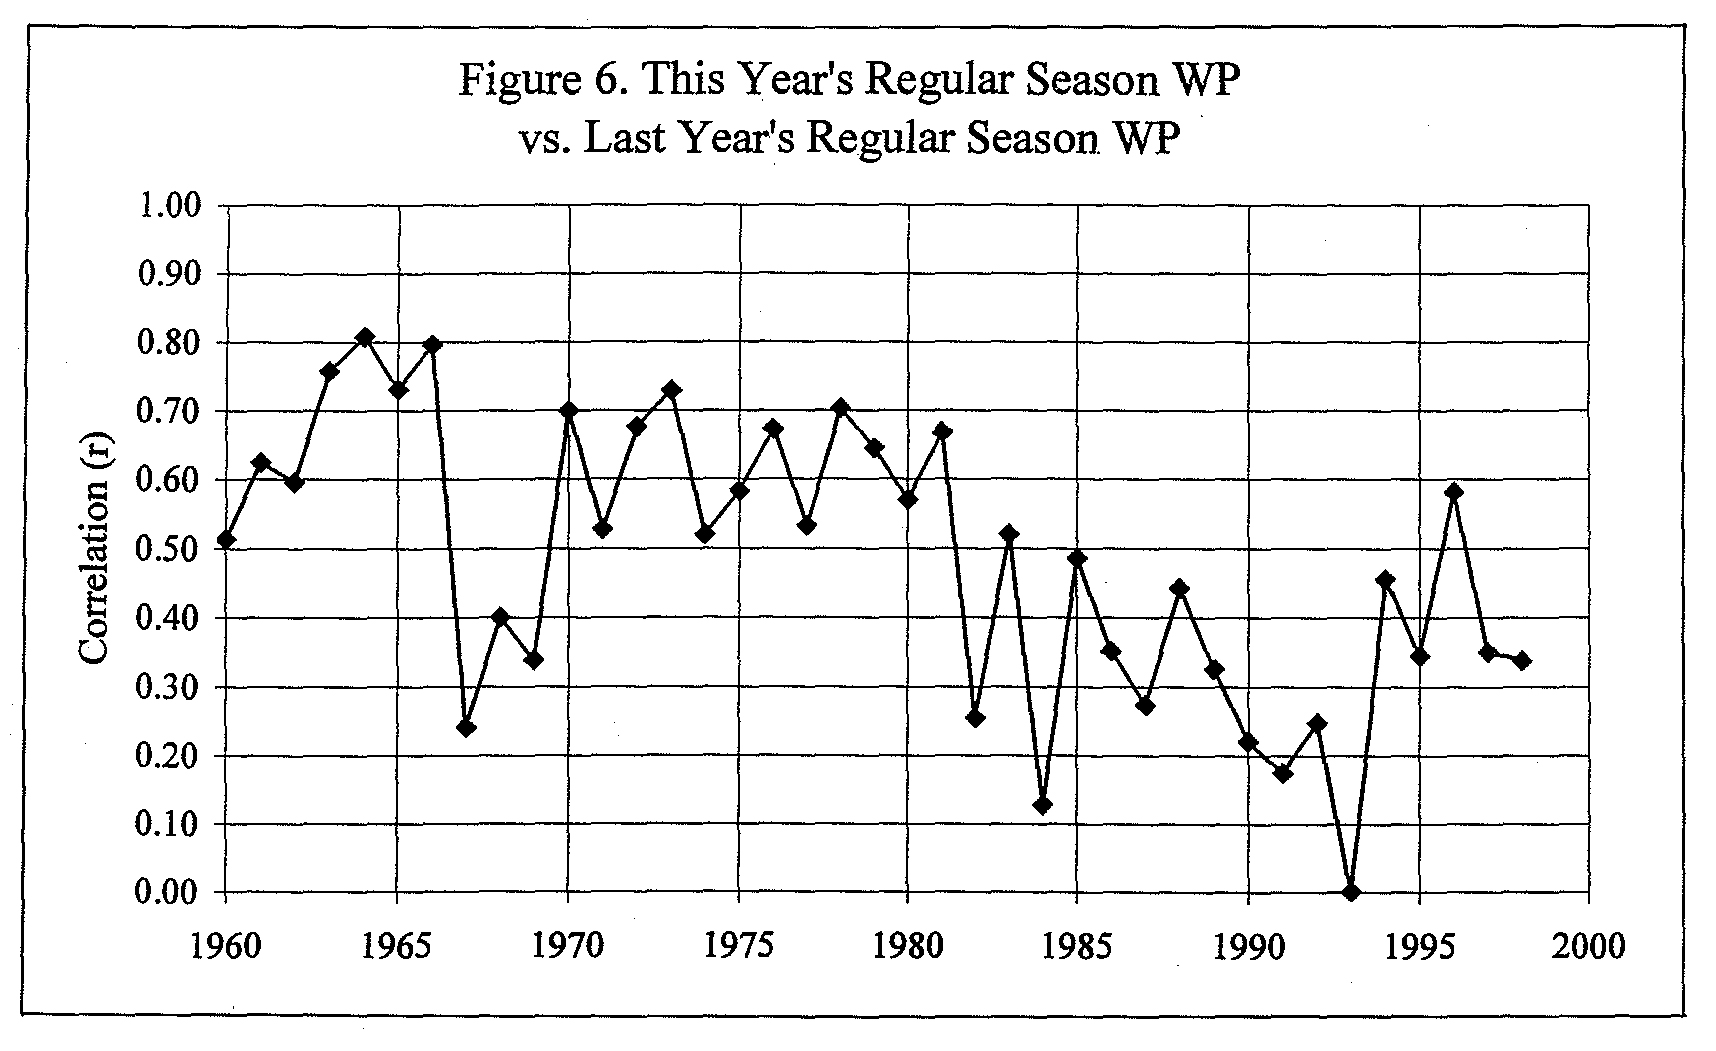
In a typical year, the correlation r = +0.52 (r2 = 27%), but it has been anything but stable over the years. The overall trend is that r has declined by an average of .01 per year over the past thirty-nine years. Prior to free agency (1960-1975), the median r was +0.61. Since its inception, it has been +0.35.
Another way to look at the predictability of team performance is to examine the distribution of changes in WP from year t-1 to the next year t, (WPt – WPt-1). In any year, the interquartile range (IQR) measures the spread of the middle 50 percent of the distribution. I calculated these, and plotted them in Figure 7.
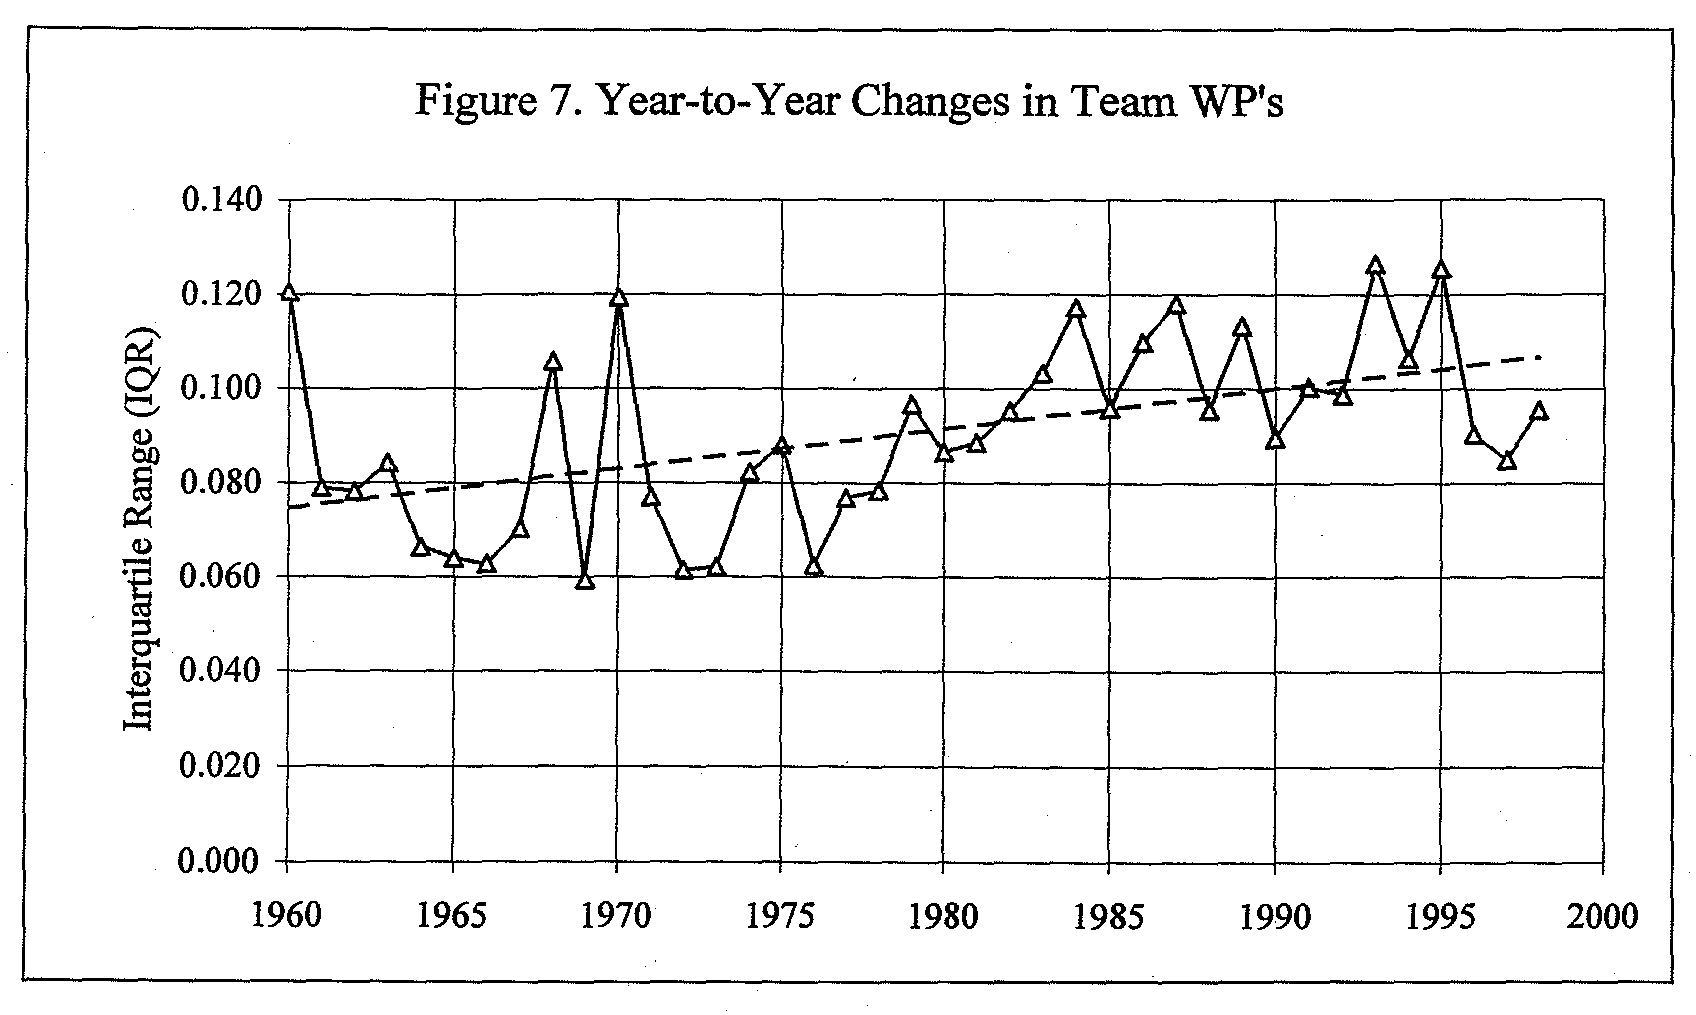
It’s clear from the graph that the spread of year-to- year changes has been growing over time-another indication of less predictability in team success from one year to the next. Large year-to-year fluctuations, both positive and negative, have been occurring more and more frequently.
Two recent examples include San Francisco’s surprising climb from last place in their division in 1996 (.420) to first in 1997 (.556), and Florida’s rapid demise after their 1997 World Series title (.568) to the majors’ worst record in 1998 (.333).
Since 1960, major league baseball has expanded six times, in 1961, 1962, 1969, 1977, 1993, and 1998. Except in 1961, the year-to-year correlation decreased (significantly in a few cases) but then went back up noticeably the following year (see Figure 6). Expansion, in which existing teams lose only a few non-star players, seems to have only a small and short-term negative impact on overall predictability.
On the other hand, the amateur draft begun in 1965 attempted to make all of the existing teams more balanced by spreading out the good new players. Initially, the draft appeared to do this, as evidenced by the large dip in the year-to-year correlation, 1967-1969. However, by 1970 the correlation returned to its pre-draft range of about +.65.
A more lasting effect was brought about by free agency, which began in 1975 and led to much less stability in team rosters. In some respects this instability has made baseball more exciting, enabling fourteen different teams to win the World Series between 1978 and 1993. Based on Figure 6, we can conclude that free agency had the strongest negative impact on predictability for at least those sixteen years, and perhaps continues its impact even to the present time.
Several conclusions can reasonably be drawn from these basic statistical analyses. First, there’s no need to follow baseball until Opening Day: the exhibition season is not important to your team’s ultimate success. Second, you should be concerned if your team isn’t playing well by the All-Star break: it’s quite unlikely to make a major recovery during the second half of the season, despite Yogi Berra’s admonition that “it ain’t over ’til it’s over.” Finally, should you optimistically “wait till next year” if your team has a bad season? Yes, you can be somewhat hopeful about your team’s chances of success next year after a poor performance this year, but you’ll have to be equally insecure about a letdown following a good year.
ROBERT SALTZMAN teaches business analysis courses at San Francisco State University. He dreams of playing center field at Pacific Bell Park.