
SABR Shortstops: An Analysis of Shortstops Before and During the SABR Era
This article was written by Joseph Werner
This article was published in Fall 2011 Baseball Research Journal
Baseball “common wisdom” says that in the days of yore, the shortstop was a defensive specialist whose bat was secondary, and that it is only in recent decades that we have seen the “rise of the offensive shortstop.” But the word “shortstop” alone conjures thoughts of some of the game’s greatest players, both past and present, calling that idea into question. From the early days of the twentieth century when Honus Wagner roamed the infield for the Pittsburgh Pirates to the more recent times of Derek Jeter as a New York Yankee, the position has been home to not only some of the game’s greatest players, but also some of the game’s best hitters. Arky Vaughan, another Pittsburgh shortstop, starred at the position, both in the field and in the batter’s box, as did Cleveland’s Lou Boudreau, Milwaukee’s Robin Yount, and Baltimore’s Cal Ripken Jr., to name a few.
But the position, which has been home to 14 Most Valuable Player awards and over 20 Hall of Famers, witnessed a steep decline in production in 1971—a drought that would last for five seasons—before slowly rebounding, and eventually reaching the height of production posted by the shortstops in the years directly following the end of World War II.[fn]According to the Baseball Hall of Fame website, www.baseballhall.org, there have been 22 players inducted that are recognized as shortstops. Luis Aparicio, Luke Appling, Dave Bancroft, Lou Boudreau, Joe Cronin, George Davis, Travis Jackson, Hughie Jennings, John Henry “Pop” Lloyd, Rabbit Maranville, Pee Wee Reese, Cal Ripken Jr., Phil Rizzuto, Joe Sewell, Ozzie Smith, Joe Tinker, Arky Vaughan, Honus Wagner, Bobby Wallace, John Montgomery Ward, Willie Wells, and Robin Yount. Two notable exclusions are Ernie Banks and George Wright. Banks, who is often associated with the position, played 1,125 games at shortstop, but also 1,259 games at first base, so the Hall of Fame recognizes him as a first baseman. George Wright, who was elected as an executive, played 12 seasons as a shortstop beginning in 1871, and hit .301/.318/.398.[/fn]
POST-WORLD WAR II ERA
In 1946, the first year following the end of World War II, 25 percent—or four of the league’s 16 teams—started a Hall of Fame shortstop; one other team started a former MVP, and two other teams also opened with very good offensive shortstops.[fn]The four future Hall of Fame shortstops are Luke Appling, Lou Boudreau, Pee Wee Reese, and Phil Rizzuto. The former MVP winner, Marty Marion, captured the award two seasons prior, in 1944. And the two other offensively minded shortstops that season were Boston’s Johnny Pesky and St. Louis Browns’ Vern Stephens, who hit .335/.401/.427 and .307/.357/.460 respectively. The Washington Senators also opened the season with Cecil Travis at shortstop, but he was never able to match his pre-war career hitting line of .327/.381/.436; he retired following the 1947 season.[/fn] Clearly, it was a position that was not without its stars, and the overall production proved it.
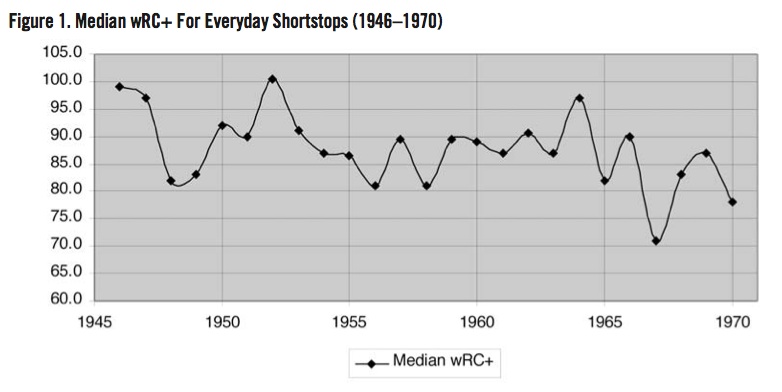
Using Weighted Runs Created Plus (wRC+), a park and league adjusted statistic scaled so 100 is league average and one point above or below that is one percent better or worse than the league average, Figure 1 illustrates the median value for everyday shortstops.[fn]For further reading on wRC+, please see the glossary section on www.FanGraphs.com.[/fn] For this purpose, an everyday shortstop will be defined as any player who’s played 61.7 percent or more of the season’s games at the position (i.e. 100 games in the current 162 game schedule, 95 games in a 154 game season, etc…)[fn]The median was used in this study, as well as most of the following analysis, in hopes of eliminating any outliers, both positive and negative, that could heavily and unjustly influence the data set, and in hopes of better capturing how the overall position performed as a group. This explanation is probably served best in the following example: 21 players appeared in 100 or more games at shortstop in 1969. The home run totals for those 21 players follow: 40, 14, 12, 10, 10, 7, 6, 5, 5, 4, 4, 4, 4, 3, 2, 2, 2, 2, 2, 0, 0. Combined, those players hit 138 home runs; an average of 6.57 home runs per player and a median of 4. But there was an extreme outlier: Rico Petrocelli. Of the 138 home runs slugged, he was responsible for 40 of them, or approximately 29 percent. Clearly, his output heavily influenced the average, which, in the bigger picture, is a bad representation of the group’s production; especially considering that more than 70% of the group falls below the average.[/fn], [fn]The 61.7 percent cutoff also creates a sufficient sample size. Of the 65 years studied throughout the duration of this paper, there were only two seasons in which at least 70 percent of the teams’ shortstops did not qualify. For example, in 1992, only 18 shortstops matched or exceeded the 61.7 percent cutoff; there were 26 teams in the league. So, 69.23% of the teams were represented that year.[/fn]
Keeping in mind that wRC+ is a park and league adjusted statistic and 100 is league average production; Figure 1 illustrates that six of the first eight seasons following World War II—1946 to 1953—half of the everyday shortstops performed offensively at 90 percent of the league average or better. To put it in a better perspective, this feat would only occur three additional times—in 1962, 1964, and 1966—before the establishment of SABR in 1971.
Also, despite the relatively high marks between 1961 and 1966, the 1961 and 1962 expansion clubs, for the most part, were hindered by the lack of production at shortstop, and that, ultimately, lowered the overall median production. The Washington Senators and Los Angeles Angels, who joined the American League in 1961, were on opposite sides of the spectrum in terms of shortstop production. Neither team had a shortstop start 100 or more games in 1961, but the Angels got decent production from Joe Koppe the following season—wRC+ of 89—and superb years from Jim Fregosi, who never posted a wRC+ less than 100 from 1963 to 1970. On the other hand, the Senators started Ed Brinkman, who was skilled with the leather, for the majority of the 1960s; he had two seasons in which he posted a total of 80 or better. The Colt .45’s and Mets, the National League expansion teams in 1962, both suffered below-average production from the position in the first five years following their inception, too; though Sonny Jackson did have his best year in 1966 with Houston when he posted a 101 wRC+. So, one team out of the four had a consistently above-average offensive shortstop. [fn]Ed Brinkman, whose top two offensive seasons were in 1969 (87 wRC+) and 1970 (80 wRC+), had three seasons—1967, 1969, and 1970—in which he saved 20 or more runs above the league average, according to Total Zone.[/fn], [fn]The 1967 season appears to be an anomaly in terms of shortstop production for the following reasons:
a. Several shortstops suffered a noticeable decline in production in 1967 and either rebounded the following season or didn’t qualify at all. Those players, along with their wRC+ totals for all three seasons beginning with 1966, include: Luis Aparicio (97, 77, 90), Ed Brinkman (64, 47, N/A), Dal Maxvill (71, 64, 89), Sonny Jackson (101, 71, N/A), Don Kessinger (64, 50, 64), and Denis Menke (109, 91, N/A). Zoilo Versalles also suffered a severe drop off—82 wRC+ to a 54 wRC+—but he held steady the following year, in 1968.
b. The 1966 season featured three players—Dick Groat (78 wRC+), Dick McAuliffe (149 wRC+), and Maury Wills (84 wRC+)—who did not qualify in 1967, and two of which (McAuliffe and Wills) performed well.
c. The 1968 season also featured several well-below-average performers who did not qualify the previous season. For this purpose, we’ll define “well-below-average” as 21 percent or greater below average. Those players, along with their wRC+ total for the 1967 season, are as follows: Ruben Amaro (70), Hal Lanier (41), Ray Oyler (60), and Bobby Wine (45).
d. While the league ERA dropped from 3.52 to 3.30 to 2.98, the position’s median value rebounded during the third year, the “Year of the Pitcher.”
e. Finally, after the initial decline in 1967, the position’s median value rebounded for two straight seasons before another slight decline—one which was less drastic than the decline in 1967.[/fn]
The 1967 season is another point worth noting. It was the lowest total in 21 years and would become the third lowest total in the post-WWII era. A strong case can be made for it being an anomaly.[fn]Based on team averages, runs per game have increased in all but one (1962) of the expansion seasons beginning in 1961. However, expansion teams, especially those prior to 1993 (both the Marlins in 1993 and Diamondbacks in 1998 had good offensive shortstops), have been hindered by poor offensive shortstops, which, in turn lowers the position’s median production. For example, including the qualifying expansion shortstops for 1969, the median wRC+ is 87, and without the expansion shortstops it is 88.[/fn]
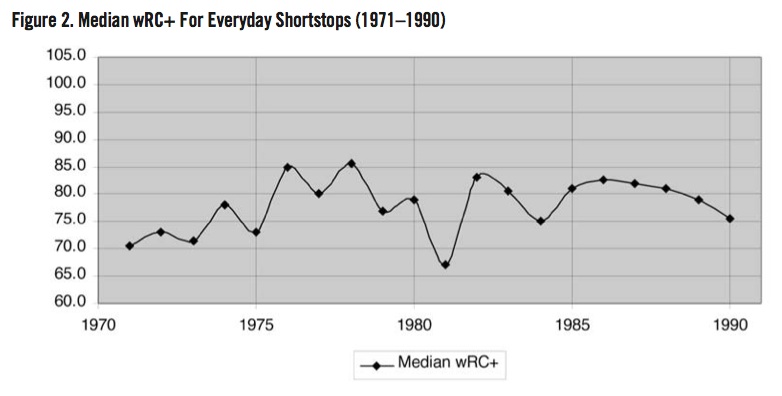
THE FIRST HALF OF THE SABR ERA
The 1971 season, the first year of SABR, was the beginning of a lull in shortstop production, coincidentally. Whereas the median wRC+ total for everyday shortstops sunk below 80 two times from 1946 to 1970, the total remained below that point eight of the first 11 seasons during SABR’s existence and 11 of the first 20.
More than half of SABR’s first 20 seasons in existence were marked by well-below-average offensive production, which would be acceptable if, and only if, there was a positive shift in defensive play. There wasn’t.
From 1966 to 1970, the 10 teams—excluding the 1969 expansion clubs—to receive the least amount of production from both their starting and backup shortstops were (starting with the worst) the Giants, Cardinals, Cubs, Phillies, Mets, Reds, Indians, Senators, Twins, and Tigers. Using Total Zone (TZ), an advanced defensive metric based on play-by-play data, those clubs, which posted a wRC+ of 74 or fewer, combined for a +93 TZ, or 93 runs saved.[fn]While there are more advanced metrics, Total Zone—developed by Sean Smith—is considered the most reliable advanced metric for seasons predating 2002. In an effort to maintain consistency and accuracy, it was used for all seasons in this paper. For further reading on Total Zone, please refer to www.Baseball-Reference.com or www.FanGraphs.com.[/fn], [fn]During the 1966 to 1970 study, the 1969 expansion teams— Royals, Pilots, Expos, and Padres—were ignored because they only played two of the five seasons.[/fn]
In contrast, the 10 teams to receive the worst shortstop production between 1971 and 1975 (including the 1969 expansion teams)—Braves, Expos, Pirates, Indians, Tigers, Brewers, Cardinals, Padres, White Sox, and Yankees—posted a -174 TZ, or cost their teams 174 runs because of sub-par defensive play. And the difference may seem significant, but it isn’t. Remember, this is over a 10-year span for 20 teams. The first time period saved, on average, 1.86 runs per year. The second period, 1971–75, lost 3.48 runs per year.
So, despite the decline in offensive production from the late ’60s to the early ’70s, there appears to have been no shift towards increased defensive play.
But delving deeper and looking at the qualifying everyday shortstops who were well-below-average offensive contributors during the same two time periods, the differences remain insignificant as well, 61 and 53 runs saved (or an average of 1.5 and 1.2 runs saved per player).[fn]Similar to Note 7c, “well-below-average” is defined as 21 percent or greater below the league average (i.e. a wRC+ of 79 or less).[/fn], [fn]A change in philosophy would require managers relying more on defense, not offense. Even though TZ is scaled to the league average, the defensive skill for poor-hitting shortstops would have to increase relative to the league average to prove a change in philosophy; it didn’t. In fact, it remained in close proximity in both time frames (1966–70 and 1971–75). So, even if defense at shortstop improved league-wide, the worst offensive shortstops showed no drastic improvement relative to the league. Thus, managers/teams did not appear to willingly sacrifice offense for defense.[/fn]
Similar to the previous expansion years, the 1969 expansion season in which four teams—Kansas City Royals, Seattle Pilots, San Diego Padres, and Montreal Expos—were added seemed to have a negative effect too. During those first five seasons, only Freddie Patek’s 1971 was above-average. The same can be said about the 1977 expansion teams. Both the Blue Jays and Mariners suffered during their first five seasons, except this time it was Craig Reynolds’s 1978 season that hovered near the league average.
One other season of note is the 1981 strike-shortened season, which will be discussed later.
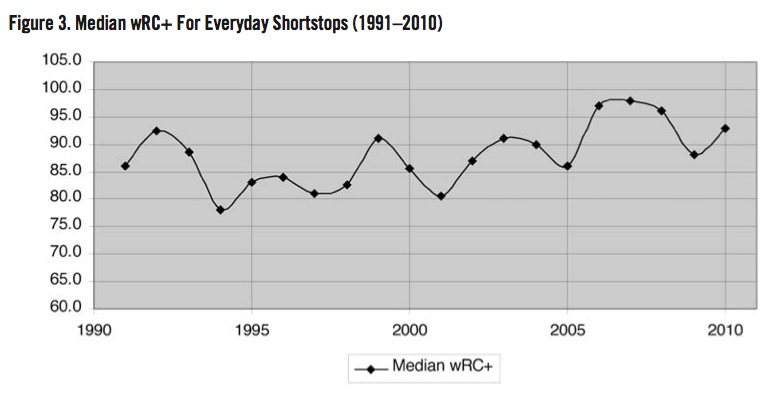
THE SECOND HALF OF THE SABR ERA
After witnessing a decline and minor rebound during the first half of the SABR era, the second half blossomed, beginning in 1991 and lasting for the next 19 seasons.
Unlike the 1971 to 1990 period, the median production topped 90 or better eight times, and four of the last five seasons. And there was only one instance, 1994, when the median production dipped below 80 percent of the league average, similar to strike-shortened 1981.[fn]The 1995 season, while technically a strike-shortened season, lost only 17 games, unlike the 1981 and 1994 seasons in which 51 and 45 games were lost, a significant decrease in sample size. Also, the cutoff point, 61.7 percent, resulted in 90 games for everyday shortstops in 1995, and only 69 in 1981 and 72 in 1994, also significant differences. Because the 1995 season played 90% of a 162-game regular season, it was treated as one. [/fn]
While both strike-shortened years played fewer than 120 games, it is much more difficult to come to a concrete conclusion on why significant downturns were experienced in both seasons.
Both years were within five seasons of an expansion—1977 saw two teams added to the AL and two teams were added to the NL in 1993. But, again, both strike seasons followed and were followed by significantly better seasons. So, it’s not likely that the expansions were a main cause, though they may have contributed somewhat.
Both years did have several players post good numbers the year before and the year after, but witnessed a sharp decline, which helped explain the 1967 season as an anomaly. So, this, too, could have been a contributing factor, at least to some degree. But perhaps the biggest influence was sample size. In both cases, qualifying shortstops only needed to play 69 and 72 games, respectively; which is roughly 30 games fewer than the surrounding years and a significant difference. Overall, it’s difficult to know definitively if that’s the main cause for the sudden declines, though the author believes it is the main influence.
Finally, within the last decade or so, the median shortstop production rebounded quite nicely. In fact, it’s on par with the level of production that the first post-war years witnessed.
The author would be remiss not to mention the use of steroids during the 1990s and 2000s. Did they affect the game? Yes, undoubtedly. But the feeling of this author is that the “Steroid Era” will inevitably be considered just another era in baseball history, much like the way the Deadball Era is viewed today. In both cases the statistics were altered by something; in the case of the Deadball Era, the ball and the overall strategy of the game, and in the case of the Steroid Era, performance enhancement. Basically, it’s difficult to separate the non-steroid users and the steroid users, which is unfortunate, but it is a fact. Knowing so, it’s best to consider the game’s stats during this recent era as a whole, accepting them at face value and for what they are.
CONCLUSION
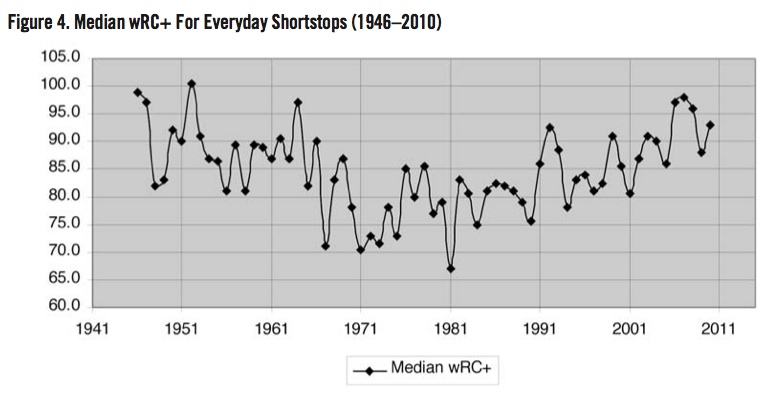
Figure 4 illustrates the median wRC+ for all qualifying shortstops from 1946 to 2010, and it clearly shows that the years closely following the end of World War II are followed by a downturn, which eventually leads to a lull beginning in 1971. This was followed by a slowly upward trend in production which ultimately peaks during the last five or so seasons.
While the majority of the median production on both ends of the graph resides above the 85 mark, the individual performances parallel each other as well. From 1946 to 1951, there were 28 instances that a player hit league average or better, or approximately 5.6 players per year. Since there were 16 teams in the league during that period, it averages out that 35 percent of the teams during that stretch benefited from league average production or better. And applying the same logic to the 44 times a shortstop topped 100 or more from 2006-10; 29.3% of teams within the last five years received league average or better offense from shortstops. Similar numbers.
So, relative to league average production, are shortstops better hitters today? Yes, generally speaking, they are better hitters than they were at the time SABR was established; they are better hitters than they were 30 years ago, and 20 years ago, too. But they are producing relative to the league near the same level that shortstops did during the first 15 or so years following World War II. And how many people would have suspected that? Those who tout the “common wisdom” about shortstops of generations past being defensive specialists who were not great hitters are suffering from either selective memory, a lack of knowledge,
or both.
JOSEPH WERNER seemed to always have a baseball in his left hand while growing up in suburban Cleveland. He played the game throughout his childhood, and continues to do so. He embraces every facet of America’s pastime. He has worked with Baseball Info Solutions as a video scout and analyst. Werner, an Ohio State grad with a degree in electrical engineering, is now co-chair for the Minor Leagues Committee of SABR. For further baseball analysis, visit his website: www.ReleasePoints.com. To contact Werner, email him at JosephMWerner@yahoo.com, and Werner welcomes feedback and suggestions.