The Future of Baseball Contracts: A Look at the Growing Trend in Long-Term Contracts
This article was written by Jim Turvey
This article was published in Fall 2013 Baseball Research Journal
Baseball contracts seem to be headed increasingly in the same direction; teams are trying to lock up their younger (particularly homegrown) stars to long-term deals before they hit the free agent market, which would drive up the price for a player. The Reds did it with Joey Votto (10 years, $225 million), and Ryan Braun inked a five-year extension on top of his current seven-year deal. Ryan Zimmerman got six years on top of five, and Troy Tulowitski is locked up through 2020. Even pitchers such as Madison Bumgarner have deals with club options until 2019, despite pitchers formerly being considered high-risk commodities. To a lesser extent, we see the signings of Chris Sale (five years, $32.5 million with two team-option years), Andrew McCutchen (six years, $51.5 million with one team-option year), and the contracts given to Matt Cain, Cole Hamels, Ian Kinsler, Adam Wainwright, David Wright, and numerous others, as heralding the future of baseball contracts.
These contracts carry “boom or bust” potential for both the player and the franchise. In the player’s case, he is guaranteeing himself a great deal of money, but at the same time, he is putting a ceiling on his earnings. He is potentially giving up an even greater sum if he were to hit the open market of free agency. When teams try to outbid each other, the player’s payday can skyrocket without the player having to do anything.
On the flip side, the same can be said of the team’s long-term investment in the player. They can keep him from hitting the open market and prevent that salary jump, but there is also a great amount of risk in committing several millions of dollars a year for a decade. A lot can change in a year, let alone 10: Players can be injured, skills can erode, projections can be wrong. Balancing this risk-reward is a huge part of building a successful franchise.
 In the NHL, contracts have moved to ridiculous lengths with players receiving 13-, 14-, and 15-year deals, with some offers up to 17 years.1 These contracts extend an unprecedented distance into the future and pay their players well past their fortieth birthdays. Even goalies, often considered on par with pitchers risk-wise, are receiving well over 10 years regularly in contracts. Despite the fact that teams have already been burned by this (the two longest were bought out or had the player leave the NHL less than halfway through the contract), not much has slowed down near-sighted owners looking to guarantee their franchise a “star” at any cost.
The success/failure rate of those contracts in hockey is a matter for a different publication, but whether the same can be said for baseball is certainly relevant. First of all, baseball teams have much higher revenue than hockey teams. In 2013, baseball payrolls topped $3 billion for the first time. The Dodgers, in particular, have become a team with bottomless pockets. Just to get Adrian Gonzalez at six years and $127 million, LA took on the poisonous contracts of Carl Crawford (five years, $102.5 million remaining) and Josh Beckett (two years and $31.5 million to go). In the offseason shortly thereafter they dropped just shy of $150 million on Zach Greinke and paid over $25 million “Dice-K dollars” to negotiate a $36 million contract on Hyun-Jin Ryu.
Revenue for player salaries used to be tied to attendance, drawn from the team’s ticket sales, concessions, and merchandise. Recently, though, teams that have traditionally not spent as much are finding a way to join the bigger spending teams at the top of the payroll billing: TV contracts. The Los Angeles Angels have become big spenders entering the top ten in payroll for the 2013 season thanks to big ticket signings like Albert Pujols and CJ Wilson before the 2012 season, and Josh Hamilton before 2013. TV deals have given some teams a significant bump in revenue—not quite Dodgers money, but enough to affect the economics of the sport.
Baseball is already on a substantial revenue upswing. Accounting for inflation, baseball has increased its revenue by 257 percent since 1995, and due to—you guessed it—TV contracts is potentially looking at nearly a $1.5 billion increase from only 2012 to 2014.2 What will this mean when it comes to handing out contracts? How much does a win really cost? There have been several different analyses done surrounding this question, but for these two case studies, Fangraphs studies of how $/WAR are valued in the open market will be used. According to Matt Swartz’s comprehensive breakdown of player contracts over a five-year window (2007–11), the average $/WAR in baseball was $4.92.3 With long-term contracts, teams assume the risk that their players will remain healthy and productive, as well as that contract values will keep rising. Some researchers argue that locking these players up before they hit the open market is actually the more risk-averse tactic. The long-term deal shifts the risk into the future, specifically, to the end of the contract when the player is not as productive, and the contract can possibly be moved (a la Alfonso Soriano from the Cubs to the Yankees in 2013).4
This article is not meant to be an in-depth analysis of every long-term contract, but a case study of two of the high profile deals signed by franchises which, in recent years, have climbed from years of obscurity into perennial pennant contention: the Tampa Bay Rays’ signing of Evan Longoria and the Texas Rangers doing the same for Elvis Andrus.
Longoria seems to be at a crossroads in his young career right now. He is the face of the franchise, which makes sense, as he is an immensely talented, highly touted, marketable, young superstar. He won Rookie of the Year his first year with the Rays, and posted 100/33/113 R/HR/RBI totals in his second year. He won the Gold Glove twice in his first three years, and probably deserved it in 2011, despite missing almost 30 games.
And therein lies the question: Longoria not only missed that time in 2011, but significant action in 2012. In 2011, he posted a batting average under .250, by far his lowest during his time in the majors. The Rays have contracted through 2023, and will pay him nearly $20 million in 2022. They need him to be the elite player he seemed at the outset.
Longoria’s career arc has resembled another player’s: Scott Rolen. Baseball-Reference.com has Rolen as the most similar player to Longoria at the ages of 24 and 25. Rolen is an excellent choice for comparison because, like Longoria, he won Rookie of the Year, was an excellent fielder, started his career with excellen power numbers, and had injury concerns creep up early in his playing days.
Projecting a player’s career arc is an art that has been attempted since the beginning of baseball, and has yet to be perfected. Comparing two players is a dangerous endeavor as no two careers are perfectly parallel; however, the comparison can offer a road map of how Longoria’s career could unfold. Looking back in an attempt to look forward is a tried and true method that spans all fields of study, giving us an inexact lens through which to view the future.
Table 1 looks at Scott Rolen’s rWAR totals. Each season of Rolen’s coincides with a specific year of Longoria’s contract and the money he will receive that season. This begins with Rolen in his age-27 season, the age Longoria was in 2013. The next two columns show the league average $/WAR (projected) and the verdict on whether or not the contract would be worth its value in the open market for the Rays. The $/WAR starts at 5.2 million, which was derived from the previously mentioned 4.92 million $/WAR found in Matt Swartz’s study, accounting for the time value of money outside of baseball. Being two years removed from that 2011 study, and with a three percent inflation rate increase accounted for, 5.2 million $/WAR is the result. Each progressive year is prorated at the three percent interest rate, as well.
Table 1
According to this analysis, Longoria will certainly be worth the value of his contract as a whole and would only be overpaid in four of the 11 seasons. Those rough seasons, if due in most part to injuries—certainly something Longoria is not immune to— would be more than made up for if his career was to follow Rolen’s career arc. The end of the contract does get a little messy for the Rays, but the middle and front-end bargains make it more than worthwhile overall. The team banks on getting so much out of the deal at the beginning that the end can be less than ideal and still have the whole contract be beneficial to the club. Note these data were collected before the beginning of the 2013 season, and as this article was going to press, Longoria has been worth 5.2 rWAR through 142 Rays games. Prorated to 162 games this becomes 5.9 rWAR, which is very close to Rolen’s 6.2 rWAR that was projected for 2013.
 The upticks in $/rWAR that have been accounted for in Table 1 could potentially be more gradual than we will see in baseball. With the aforementioned large TV contracts on the way for most ball clubs, we could see some absolutely absurd contracts going forward. On the other hand, the future of baseball contracts may be headed in the direction of more efficient spending. The Dodgers may be able to spend without limit, but we’ve already seen the Yankees cutting payroll, which is something that seemed unheard of a few seasons ago. With the success of teams like the Rays, A’s, Pirates, and Royals, building up a farm system may seem preferable to being profligate with contracts. Another possibility that could steer teams away from going wild with spending would be if MLB adopted a salary cap, and with it, some harsh repercussions for repeat violators, as the latest collective bargaining agreement in the NBA does. The NBA has also seen a movement toward draft picks being valued more highly, as some small market teams have become contenders without big free agents.
One issue with a limited case study is that it relies on a small sample size for comparison. If Bob Horner, another player with a high similarity score to Longoria, had been used, the 3.9 rWAR he was worth after the age of 26 would have been a complete disaster for the Longoria contract. The same goes for Hank Blalock, who was worth only 1.1 WAR after the age of 26. On the other hand, Chipper Jones was worth 57.3 WAR during the eleven corresponding years of his career. Right in the middle is Aramis Ramirez: worth 24.2 WAR and counting. Looking at Longoria’s contract through the lens of Scott Rolen’s career from a strictly $/WAR perspective is one thing, but there is more to it.
Of all the long-term deals signed, Longoria’s is for the least amount per year, and could very well be the best bang-for-your-buck deal. It takes a lot of guts (or in some cases not a lot of brains) to sign a guy to a contract that runs until this year’s second graders are graduating from high school, and baseball history is littered with proof of contracts gone wrong (see Zito, Barry) but the Rays needed to make a statement. Analyzing wins says nothing about the other contributions to franchise success that the Longoria deal makes. By signing the face of their franchise to a mega-deal, the Rays show their fan base a different side from what they are used to.
Although the front office may be frugal with money, they show they do know how to reward their stars and place a significant emphasis on winning. (Elsewhere in Florida Jeffrey Loria should be paying attention.)
The second part of this case study is a look at Elvis Andrus and the Rangers. Andrus is a solid player and already has two All-Star game appearances at the ripe age of 24. However, he also hasn’t posted a season with an OPS+ over 94, and has only topped 150 R+RBI in one season (156 in 2011). There’s also the fact that in Jurickson Profar, the Rangers have one of baseball’s top prospects and their supposed future starting shortstop, sitting in a reserve role and stuck behind Andrus in the depth chart. Barring an Andrus trade, Profar isn’t going to see any time at shortstop in Arlington for a while. With Ian Kinsler locked up through 2017, and Adrian Beltre playing at an All-Star level at third, even with a position-switch Profar seems to be pretty well blocked to any consistent starting job in Texas.
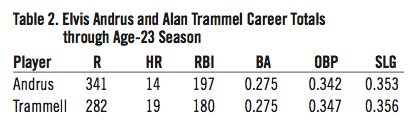
Putting that aside for the time being, however, let’s take a look at Andrus’s contract from a strictly dollars and WAR sense as we did for Longoria. The highest similarity score on Baseball-Reference for Andrus is Alan Trammell. Both players reached the big leagues at a very young age and relied heavily on their gloves in their first four years to make their impact with their respective teams. A quick comparison of the two through their age-23 seasons shows the similarities:
Table 2. Elvis Andrus and Alan Trammell Career Totals through Age-23 Season
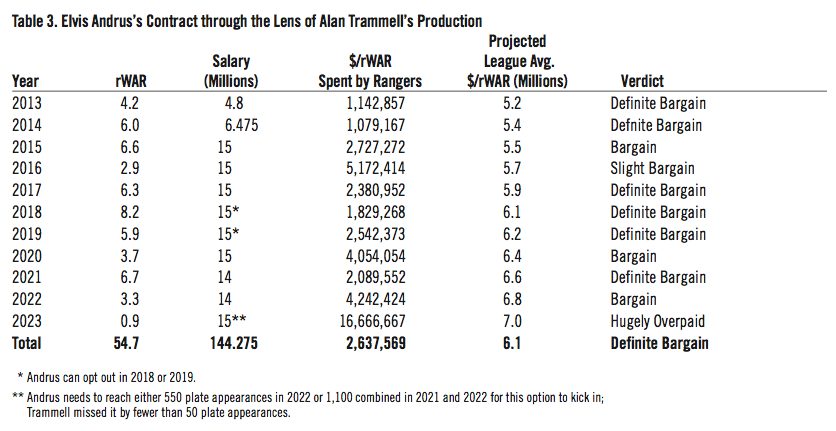
Andrus, so far, has contributed 12.8 rWAR with 10.6 oWAR and 5.5 dWAR (oWAR and dWAR can not simply be added together because there is also positional adjustment included) while Trammell’s numbers through 1981 were as follows: 11.4 rWAR with 10.4 oWAR and 4.8 dWAR. So the players clearly have very similar numbers, and the slightly lower R/HR/RBI splits for Trammell can be attributed to playing in a time in which offense was harder to come by, as well as Andrus having the boost of a potent Rangers lineup behind him. Using Trammell as the basis for Andrus’s future, as we did for the Rolen/Longoria comparison; the eight-year contract extension would play out as shown in Table 3.
Table 3
Andrus’s chart is very different from Longoria’s. By this measure, the Rangers won’t pay over market value for Andrus until 2023, which they wouldn’t even be on the hook for using Trammell’s career numbers.
Both the rWAR total, and the salary for Andrus are higher than Longoria’s, but Trammell stayed much healthier than Rolen, which was a huge factor. Andrus has never missed more than twenty games in a season—a feat Longoria has “achieved” each of the last two years—making the comparison a fair one.
To say that Trammell had an exceptionally healthy career is a bit of an understatement. Trammell was able to average 143 GP per season 1982–90, a task that Andrus may find difficult to replicate. Despite the fact that through his first four seasons, he averaged 150 GP, the health Trammell achieved over such an extended period of time is a challenge for any player. Another difference of note is that while Elvis may start to leave the building a little more frequently, he will be hard-pressed to reach the 49 home runs in a two-year stretch that Trammell did in 1986–87. Andrus has shown no signs of a decline in his fielding ability, a key component to his value to the Rangers in the past and potentially the future. As noted with Longoria above, these data were collected before the 2013 season, when this paper went to press, Elvis Andrus has been worth 3.4 rWAR through 143 Rangers’ games. Prorated to 162 games, this total would be 3.9 rWAR, once again, nearly on par with his projection of 4.2 rWAR.
Trammell is only one of the possible comparisons for Andrus. The second-best comparison on Baseball-Reference for Andrus at his current age is 1925–36 journeyman shortstop Mark Koenig. After the age of 23, Koenig was worth barely over 3.5 rWAR. On the other hand, Roberto Alomar was also worth over 50.0 WAR for the same years as Andrus’s contract. Edgar Renteria provides the middle-of-the-road example in this case, being worth 23.1 WAR for the length of Andrus’s contract. Both Rolen and Trammell were selected because they provided the most similar styles to Longoria and Andrus, while putting up very similar numbers, but as previously noted, a case study such as this is limited.
But as with Longoria, there are other elements of value to consider in the big picture. As mentioned, there is still the matter of Profar. He is baseball’s top prospect, and will need a home soon. If the Rangers deal him because Andrus is blocking his way, it could very well be something the Rangers regret for a long while, as the Red Sox did with Jeff Bagwell.
More intriguing, however, is something raised in another of Matt Swartz’s studies at Fangraphs. This one, examining positional values through the 2011 season, concludes that shortstop is the position on which teams pay the least amount of $/fWAR, and the price is dropping. According to his research, teams paid 4.6 million $/fWAR at SS in 2009, 3.2 million $/fWAR in 2010, and 2.7 $/fWAR in 2011—a trend that has to be disturbing to Rangers’ fans.6
This information from Fangraphs was not incorporated into Table 2 for two reasons. First, the previous analysis of Longoria’s contract used the progressive $/rWAR system and we retained it for consistency. The other reason is that with Profar lurking, Andrus may be switched to third to make room for him (if Beltre were to leave). In such a case, his positional value might be different for the majority of his contract. However, knowing that the shortstop position is worth $3 million/fWAR and may be trending down, one can start to see the cracks in this contract for the Rangers. For the entirety of Andrus’ contract, the Rangers do spend less than 3 million $/fWAR—and that number drops to around 2.5 million $/fWAR with that final season eliminated.
One worry we have not touched on is that players with long-term contracts may begin to rest on their laurels, enjoying the guaranteed income they have received, and no longer pushing themselves. Multiple researchers have dispelled this worry, including J.G. Maxcy, Anthony Krautmann, and John Solow.7,8
Their work has shown that even if it is due to their hopes for yet another contract, there won’t be a drop in production from these players merely because of the long-term nature of their contracts.
The results of this case study show that both Longoria’s and Andrus’s contracts are a good value for the Rays and Rangers respectively. There’s no perfect way to analyze contracts into the future, but the future of combating small sample size problems may be in clustering players by similarity, as SABR President Vince Gennaro discussed during his presentation at SABR 43. Gennaro’s analysis in that presentation was on batter-pitcher match-ups, but the technique of extrapolating potential performance based on clustering can be extended to other parts of the game. The idea is that by using the minute breakdowns in performance data now available to us, we can group pitchers with similar performance attributes into clusters.
In the future, we may be able to compare Longoria not only to Rolen, but perhaps to all players in the Rolen similarity cluster, thereby eliminating the extremes of small sample size error.
To cite Gennaro again, another point that has to be made in this analysis is that not all wins—or in this case WAR—are created equal. A prime example would be to go back to the beginning of this paper, and use the case of Troy Tulowitski. Tulowitski and Longoria will both be worth around 6.0 WAR in 2013, but this does not mean each team has gotten the same return on the value of their contracts. The six wins that Longoria has been worth for the Rays have kept them in the Wild Card race, and as of this minute, are the difference between the Rays making the playoffs as the second Wild Card, or missing out on the playoffs entirely. Making the playoffs can be a huge source of revenue for a team, and is part of the reason Gennaro states that wins 91–100 are worth exponentially more than wins 86–90 (which in turn are worth exponentially more than wins 1–86).9
The six wins that Tulowitski has produced are the difference between the Rockies finishing with 76 wins, or merely 70. Both the Rays and Rangers are currently in that tier in which 3.0–4.0 WAR can be the difference between making the playoffs or missing out, which adds even more value to both Longoria’s and Andrus’s contracts as of this moment. If either team were to slip out of the playoff picture in the coming years, those contracts essentially decrease in value, which is yet another risk for the team when it comes to long-term deals.
One final note is on a related question: will baseball ever see another free-agent class stocked with multiple, bona fide super-stars? Except for Robinson Cano, the biggest names set to become free agents after the 2013 season are Shin-Soo Choo and Hideki Kuroda—not exactly the A-list free agents seen in the past. Teams are locking their players up more and more often, preventing teams like the Yankees and Red Sox from being able to sign all the big names in the off-season. This trend puts an emphasis on producing home grown talent, and being able to coach this talent to succeed at the big league level. This leveling of the playing field seems to be a generally good thing for baseball, so if that means more uber-contracts for players before they hit the open market, I’m all for it.
Notes
1. Nicholas Goss, “Why NHL ‘Lifetime’ Contracts are a Terrible Idea,” Bleacher Report, August 22, 2012, http://bleacherreport.com/articles/1306796-why-lifetime-contracts-are-a-terrible-idea-in-the-nhl; Chris Yuscavage, “New Jersey Devils Forward Ilya Kovalchuk Retires at 30, Gives Up $77 Million Remaining on Contract,” Complex Sports, July 11, 2013, www.complex.com/sports/2013/07/ilya-kovalchukretires-30-gives-up-77-million.
2. Maury Brown, “MLB Revenues Could Approach $9 Billion by 2014,” The Biz of Baseball, December 10, 2012, http://bizofbaseball.com/index.php?option=com_content&view=article&id=5769:mlb-revenues-75bfor-2012-could-approach-9b-by-2014&catid=30:mlb-news&Itemid=42.
3. Matt Swartz, “A Retrospective Look at the Price of a Win,” Fangraphs.com, August 14, 2012, www.fangraphs.com/blogs/a-retrospective-look-at-the-price-of-a-win.
4. Joel G. Maxcy, “Motivating Long-term Employment Contracts: Risk Management in Major League Baseball.” Journal of Sports Economics 25.2 (2004): 109–20. Accessed September 10, 2013.
5. www.baseball-reference.com/players/l/longoev01.shtml#contracts.
6. Matt Swartz, “Positional Differences in the Price of WAR,” Fangraphs.com, February 16, 2012, http://www.fangraphs.com/blogs/index.php/positional-differences-in-the-price-of-war-2.
7. Joel G. Maxcy, “Do Long-term Contracts Influence Performance in Major League Baseball?” Advances in the Economics of Sport. Wallace E. Hendricks (ed.) Vol. 2. Greenwich, CT: JAI, 1997. 157–76.
8. Anthony C. Krautmann and John L. Solow, “The Dynamics of Performance Over the Duration of Major League Baseball Long-Term Contracts,” Journal of Sports Economics 10.1 (2009): 6–22. Accessed September 10, 2013.
9. Vince Gennaro, Diamond Dollars: The Economics of Winning in Baseball, Hingham, MA: Maple Street Press, 2007.


