
Baseball Demographics, 1947-2016
This article was written by Mark Armour - Daniel R. Levitt
 Several years ago, I (Mark) performed a research project to numerically define the spread of integration in the years after Jackie Robinson’s debut. This research was presented at the 2007 SABR convention in St. Louis, and then in the Fall 2007 Baseball Research Journal. The primary task in the project was to identify players who played in the 1947-1986 period (40 years) who would not have been allowed to do so before Robinson broke the color line. These players included both African Americans and Afro-Latinos, though I also recorded the player’s country of birth—providing an approximation for distinguishing the two groups. Although my research was conducted independently, I was able to confirm my findings with several other people who had traveled down the same road, including Steve Treder, Rick Swaine, Tom Timmerman and Jules Tygiel.
In recent years there has been increased attention on the obvious decline of African Americans in the major leagues. Although my period of study ended in 1986 (at which point the decline had not begun), many published accounts have claimed African American percentages from the 1970s that I knew were way too high since they matched the figures I had for African Americans and Afro-Latinos combined. In April 2013, for the first time, I was contacted by a number of media outlets who wanted to understand the discrepancy, and I shared my research on the subject.
However, I was asked one question more than any other: Why did you stop at 1986? My honest response was that the questions I was trying to answer in 2007 were satisfactorily addressed. I was studying the rise, not the decline. Nonetheless, the increased interest in the subject suggested that I needed to completely redo the study to make it up-to-date, and also to more deliberately separate the Latino players.
For the present study, Dan did the work to identify the more than 11,000 players who have played since 1947, which players played in which seasons, their primary positions and other demographic or statistical information. For each of these players, I divided them into four demographic categories: African American, Latino, Asian, and White. This is not an exact science. Many players are of mixed-race, from Roy Campanella to Derek Jeter. Race is principally a social construct and is mostly about self-identification.
As my study was intended to estimate the effects of lifting the color barrier, I used skin color as the determining factor, because this is how Organized Baseball itself defined the issue prior to Robinson (and even for many years thereafter.) As there are more than 11,000 players, disagreements on a few of them are not going to change our conclusions.
Now that we have the data, there are many questions we can answer. We will answer a few of them here, starting with the most commonly discussed one: what is the overall percentage of various demographic groups in baseball, particularly for African Americans, and how has it changed over time.
Table 1 summarizes the percentage of the total pool of players who appeared in a given season who belong to each ethnic group.
Table 1 – All Players, 1947-2016
| Year | White | African Americans |
Latino | Asian |
|---|---|---|---|---|
| 1947 | 98.3% | 0.9% | 0.7% | 0.0% |
| 1948 | 98.5% | 0.7% | 0.7% | 0.0% |
| 1949 | 96.6% | 1.5% | 1.9% | 0.0% |
| 1950 | 95.3% | 1.7% | 3.0% | 0.0% |
| 1951 | 94.3% | 2.9% | 2.8% | 0.0% |
| 1952 | 94.4% | 2.9% | 2.7% | 0.0% |
| 1953 | 93.3% | 3.7% | 3.0% | 0.0% |
| 1954 | 90.7% | 5.6% | 3.7% | 0.0% |
| 1955 | 89.8% | 5.2% | 5.0% | 0.0% |
| 1956 | 88.2% | 6.7% | 5.1% | 0.0% |
| 1957 | 88.1% | 6.7% | 5.2% | 0.0% |
| 1958 | 86.7% | 7.4% | 5.9% | 0.0% |
| 1959 | 84.8% | 8.8% | 6.5% | 0.0% |
| 1960 | 82.3% | 8.9% | 8.9% | 0.0% |
| 1961 | 82.6% | 9.7% | 7.7% | 0.0% |
| 1962 | 81.9% | 10.1% | 8.0% | 0.0% |
| 1963 | 80.1% | 11.7% | 8.2% | 0.0% |
| 1964 | 79.3% | 11.7% | 8.9% | 0.1% |
| 1965 | 78.3% | 12.7% | 8.8% | 0.1% |
| 1966 | 76.9% | 13.4% | 9.7% | 0.0% |
| 1967 | 75.6% | 13.6% | 10.7% | 0.0% |
| 1968 | 73.8% | 15.4% | 10.8% | 0.0% |
| 1969 | 74.4% | 14.5% | 11.1% | 0.0% |
| 1970 | 73.7% | 14.6% | 11.7% | 0.0% |
| 1971 | 73.9% | 15.5% | 10.6% | 0.0% |
| 1972 | 72.9% | 16.1% | 10.9% | 0.0% |
| 1973 | 71.6% | 17.4% | 11.0% | 0.0% |
| 1974 | 71.1% | 17.4% | 11.5% | 0.0% |
| 1975 | 71.3% | 18.5% | 10.2% | 0.0% |
| 1976 | 70.5% | 18.0% | 11.5% | 0.0% |
| 1977 | 70.7% | 17.9% | 11.4% | 0.0% |
| 1978 | 71.3% | 17.4% | 11.3% | 0.0% |
| 1979 | 71.4% | 17.9% | 10.7% | 0.0% |
| 1980 | 71.1% | 17.4% | 11.6% | 0.0% |
| 1981 | 70.1% | 18.7% | 11.1% | 0.0% |
| 1982 | 70.4% | 17.9% | 11.7% | 0.0% |
| 1983 | 70.3% | 18.0% | 11.6% | 0.0% |
| 1984 | 69.6% | 18.4% | 12.0% | 0.0% |
| 1985 | 70.3% | 18.3% | 11.3% | 0.0% |
| 1986 | 70.0% | 18.3% | 11.8% | 0.0% |
| 1987 | 69.9% | 17.7% | 12.3% | 0.0% |
| 1988 | 68.2% | 17.3% | 14.5% | 0.0% |
| 1989 | 70.3% | 16.5% | 13.2% | 0.0% |
| 1990 | 68.6% | 16.6% | 14.8% | 0.0% |
| 1991 | 66.8% | 17.0% | 16.1% | 0.1% |
| 1992 | 67.7% | 16.7% | 15.6% | 0.0% |
| 1993 | 66.3% | 16.8% | 16.9% | 0.0% |
| 1994 | 65.0% | 17.2% | 17.8% | 0.1% |
| 1995 | 64.5% | 16.1% | 19.2% | 0.2% |
| 1996 | 63.2% | 16.0% | 20.4% | 0.4% |
| 1997 | 60.9% | 15.0% | 23.5% | 0.5% |
| 1998 | 62.0% | 14.3% | 22.8% | 0.8% |
| 1999 | 61.7% | 13.6% | 23.5% | 1.2% |
| 2000 | 61.2% | 12.8% | 24.7% | 1.3% |
| 2001 | 60.7% | 12.1% | 26.0% | 1.2% |
| 2002 | 60.8% | 10.8% | 26.5% | 1.9% |
| 2003 | 61.0% | 10.4% | 26.8% | 1.8% |
| 2004 | 60.3% | 10.1% | 27.7% | 1.8% |
| 2005 | 60.9% | 9.1% | 27.8% | 2.3% |
| 2006 | 61.3% | 9.0% | 27.9% | 1.9% |
| 2007 | 63.1% | 8.5% | 26.1% | 2.2% |
| 2008 | 62.1% | 8.2% | 27.3% | 2.3% |
| 2009 | 62.2% | 7.1% | 28.5% | 2.1% |
| 2010 | 63.0% | 7.8% | 27.2% | 1.9% |
| 2011 | 63.5% | 7.9% | 26.9% | 1.7% |
| 2012 | 63.9% | 7.2% | 26.9% | 1.9% |
| 2013 | 63.6% | 6.7% | 27.7% | 2.0% |
| 2014 | 63.7% | 6.7% | 27.7% | 1.8% |
| 2015 | 63.4% | 7.2% | 27.7% | 1.7% |
| 2016 | 63.7% | 6.7% | 27.4% | 2.1% |
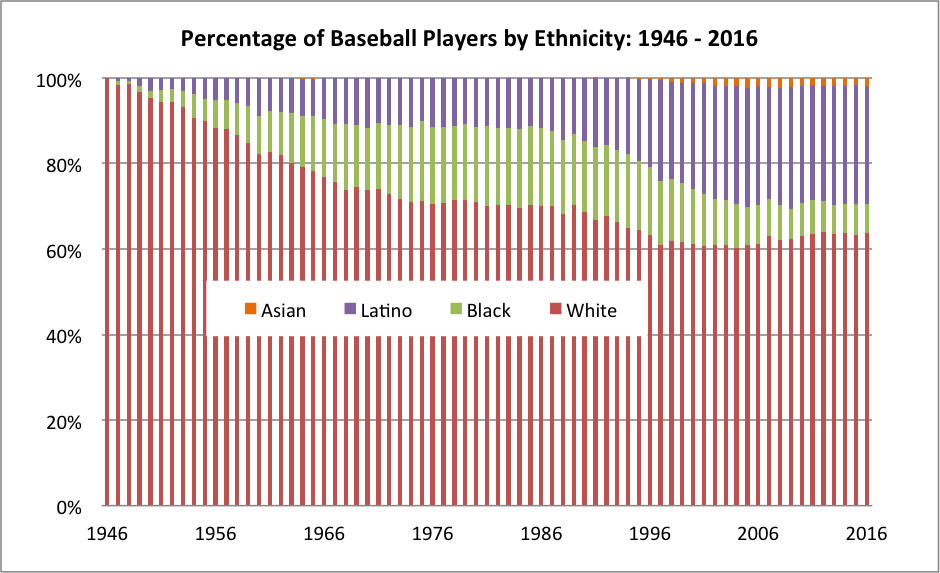
Figure 1 highlights the data in graphical form.
(Click image to enlarge)
The percentage of African Americans grew steadily from Jackie Robinson’s debut in 1947 until the early 1970s at which point it plateaued around 16% to 19% for a quarter-century (1972-1996). Since then it has plummeted to less than half that amount. There are a lot of theories as to why this happened, most of which are beyond the scope of this article. Our interest here is not to determine why, but to examine the data itself as a useful starting point.
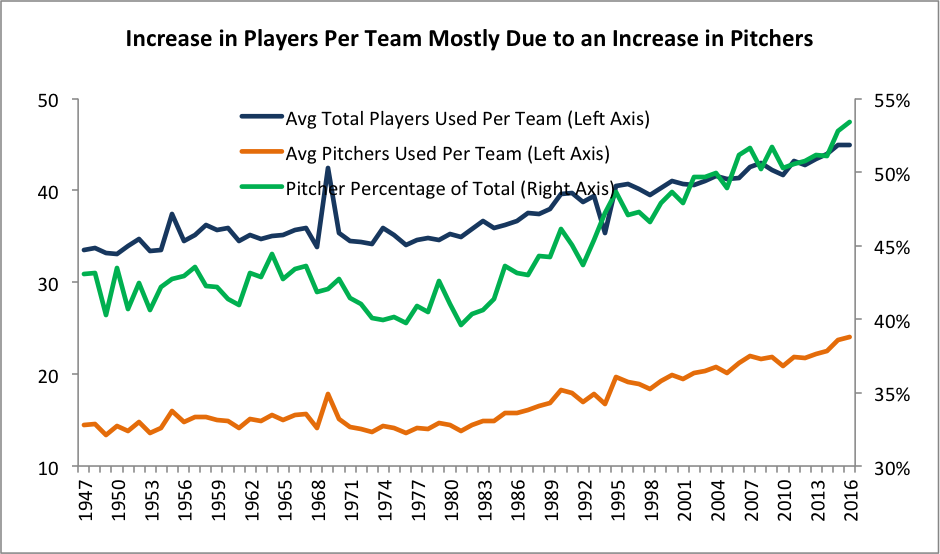
One undeniable change in baseball rosters in the past generation is the growth of pitching staffs at the expense of position players. As shown in Figure 2, nearly all the increase in players used per team comes from an increased use of pitchers. In the late 1980s and early 1990s the percentage of players who were pitchers began rising from the low 40 percent range to 53.4% in 2016. For the past dozen or years, more than half of all players in major league baseball have been pitchers.
(Click image to enlarge)
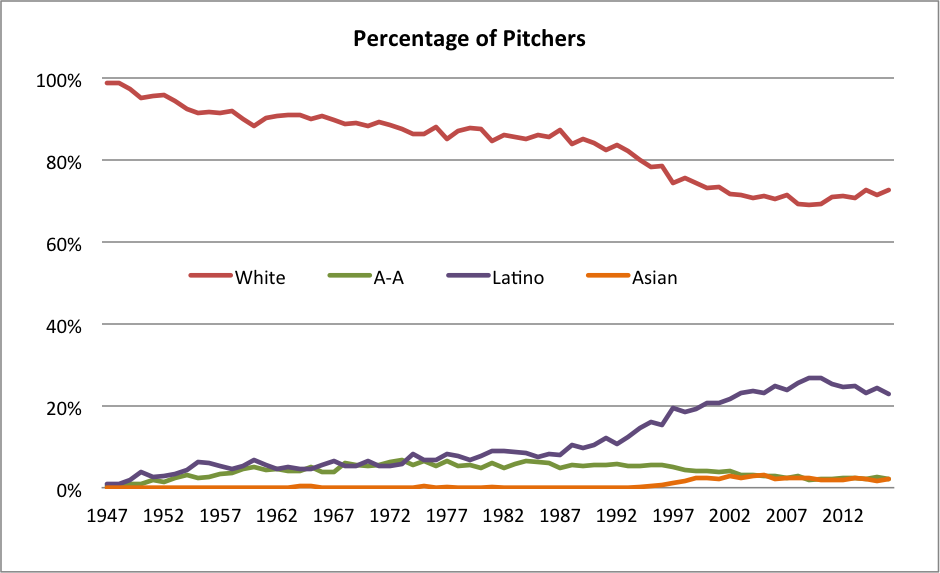
African Americans have been disproportionately underrepresented on the mound, consisting of between 2 and 3 percent of the major-league hurlers over the past twelve years. This number has never been as high as for other positions — getting over 6% a handful of times — but there are now 10 times as many Latino pitchers as there are African Americans.
(Click image to enlarge)
We also looked at other positions, assigning each player a primary position for his career. Alex Rodriguez, for our purposes, is a shortstop because he played more games at shortstop than at any other position. Again, we are looking for trends in a pool of more than 11,000 players, so these simplifications will not affect our conclusions.
The story at catcher, for example, is even more dramatic than at pitcher, with just a handful of African American catchers in the past decade. As of 2016, pitchers and catchers generally occupy 14 or 15 of the 25 roster slots. For the most part, African Americans have been significantly underrepresented at these positions, and are instead competing for the remaining 10 or 11 places on the team.
So what positions are African Americans playing? As shown in figure 4, most commonly, they are outfielders.
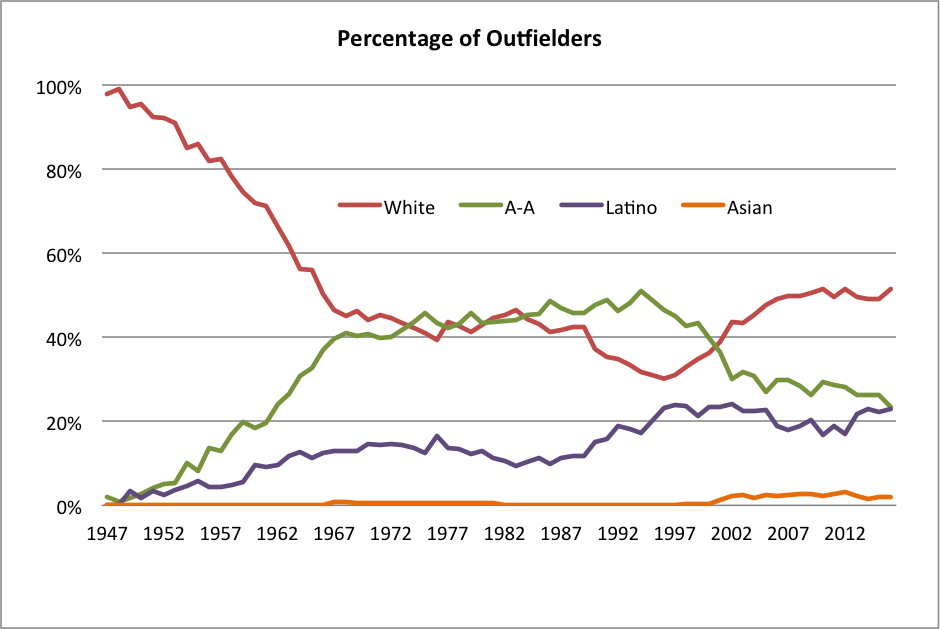
(Click image to enlarge)
Major-league outfielders were over 40% African American for a 30-year period (1967-1999) before dropping below 30%. The share of Latino outfielders has remained over 20% for the past twenty years during the period of the African American decline.
We mentioned earlier that the pool of outfielders is shrinking, but African Americans’ share of the pool is also shrinking, even though their numbers are still high relative to the rest of the positions on the field.
Our study considers every player who played in a major league game in a given season, and weighs all of them — Willie Mays and Bob Uecker — equally. But what if instead, as an alternative way to measure the impact of African Americans on the game, we weighted each player by his contributions? The next chart summarizes the total percentage of a season’s WAR (Wins Above Replacement, as defined by Baseball-Reference.com) of each group.
The following table repeats the first table above, weighted by value:
Table 2 – Player WAR, 1947-2016
| Year | White | African Americans |
Latino | Asian |
|---|---|---|---|---|
| 1947 | 99.9% | 0.4% | -0.3% | 0.0% |
| 1948 | 97.6% | 2.6% | -0.2% | 0.0% |
| 1949 | 93.9% | 5.4% | 0.7% | 0.0% |
| 1950 | 91.0% | 7.2% | 1.7% | 0.0% |
| 1951 | 86.7% | 8.8% | 4.5% | 0.0% |
| 1952 | 88.3% | 7.5% | 4.2% | 0.0% |
| 1953 | 87.3% | 7.4% | 5.4% | 0.0% |
| 1954 | 85.2% | 8.5% | 6.3% | 0.0% |
| 1955 | 82.2% | 12.7% | 5.0% | 0.0% |
| 1956 | 81.8% | 14.5% | 3.7% | 0.0% |
| 1957 | 82.8% | 11.5% | 5.7% | 0.0% |
| 1958 | 79.9% | 13.7% | 6.3% | 0.0% |
| 1959 | 78.0% | 15.4% | 6.6% | 0.0% |
| 1960 | 79.5% | 13.8% | 6.7% | 0.0% |
| 1961 | 74.6% | 17.4% | 8.0% | 0.0% |
| 1962 | 71.3% | 19.3% | 9.4% | 0.0% |
| 1963 | 70.4% | 19.7% | 9.9% | 0.0% |
| 1964 | 68.6% | 21.2% | 10.1% | 0.1% |
| 1965 | 64.4% | 24.2% | 11.2% | 0.2% |
| 1966 | 63.6% | 24.0% | 12.4% | 0.0% |
| 1967 | 67.4% | 20.2% | 12.4% | 0.0% |
| 1968 | 64.5% | 22.0% | 13.5% | 0.0% |
| 1969 | 63.2% | 24.4% | 12.4% | 0.0% |
| 1970 | 66.8% | 23.5% | 9.7% | 0.0% |
| 1971 | 66.0% | 24.6% | 9.5% | 0.0% |
| 1972 | 64.9% | 24.9% | 10.2% | 0.0% |
| 1973 | 66.0% | 25.5% | 8.5% | 0.0% |
| 1974 | 66.8% | 24.3% | 8.9% | 0.0% |
| 1975 | 65.0% | 25.0% | 10.1% | 0.0% |
| 1976 | 66.1% | 24.3% | 9.7% | 0.0% |
| 1977 | 62.3% | 27.2% | 10.4% | 0.0% |
| 1978 | 67.8% | 24.2% | 8.0% | 0.0% |
| 1979 | 67.9% | 24.2% | 7.9% | 0.0% |
| 1980 | 66.7% | 26.4% | 7.0% | 0.0% |
| 1981 | 66.7% | 26.0% | 7.3% | 0.0% |
| 1982 | 66.6% | 22.1% | 11.3% | 0.0% |
| 1983 | 65.0% | 25.8% | 9.2% | 0.0% |
| 1984 | 66.8% | 22.9% | 10.2% | 0.0% |
| 1985 | 66.9% | 24.2% | 8.9% | 0.0% |
| 1986 | 69.5% | 22.8% | 7.7% | 0.0% |
| 1987 | 67.8% | 20.6% | 11.6% | 0.0% |
| 1988 | 68.7% | 20.2% | 11.1% | 0.0% |
| 1989 | 65.2% | 22.4% | 12.3% | 0.0% |
| 1990 | 64.4% | 24.0% | 11.6% | 0.0% |
| 1991 | 61.8% | 22.4% | 15.9% | 0.0% |
| 1992 | 59.6% | 23.8% | 16.6% | 0.0% |
| 1993 | 64.5% | 21.2% | 14.3% | 0.0% |
| 1994 | 59.1% | 22.0% | 18.9% | 0.0% |
| 1995 | 66.0% | 18.0% | 15.5% | 0.5% |
| 1996 | 58.8% | 18.8% | 21.8% | 0.6% |
| 1997 | 63.3% | 16.7% | 19.4% | 0.6% |
| 1998 | 55.0% | 19.9% | 23.9% | 1.2% |
| 1999 | 55.0% | 15.8% | 28.2% | 1.0% |
| 2000 | 55.7% | 13.9% | 27.7% | 2.6% |
| 2001 | 56.2% | 12.7% | 29.0% | 2.1% |
| 2002 | 56.4% | 12.4% | 29.3% | 1.9% |
| 2003 | 54.5% | 11.7% | 31.7% | 2.2% |
| 2004 | 54.3% | 10.9% | 32.9% | 2.0% |
| 2005 | 58.3% | 11.3% | 28.4% | 2.0% |
| 2006 | 59.1% | 9.7% | 28.4% | 2.8% |
| 2007 | 57.3% | 11.6% | 27.7% | 3.4% |
| 2008 | 58.6% | 10.3% | 26.9% | 4.1% |
| 2009 | 59.8% | 11.8% | 25.1% | 3.2% |
| 2010 | 57.0% | 11.1% | 29.6% | 2.3% |
| 2011 | 56.7% | 12.9% | 29.0% | 1.3% |
| 2012 | 58.3% | 11.4% | 28.0% | 2.2% |
| 2013 | 57.3% | 7.7% | 30.7% | 4.3% |
| 2014 | 59.1% | 11.0% | 27.3% | 2.7% |
| 2015 | 58.1% | 11.6% | 28.0% | 2.3% |
| 2016 | 59.9% | 8.3% | 29.2% | 2.5% |
As with the raw number data, figure 5 presents the data graphically.
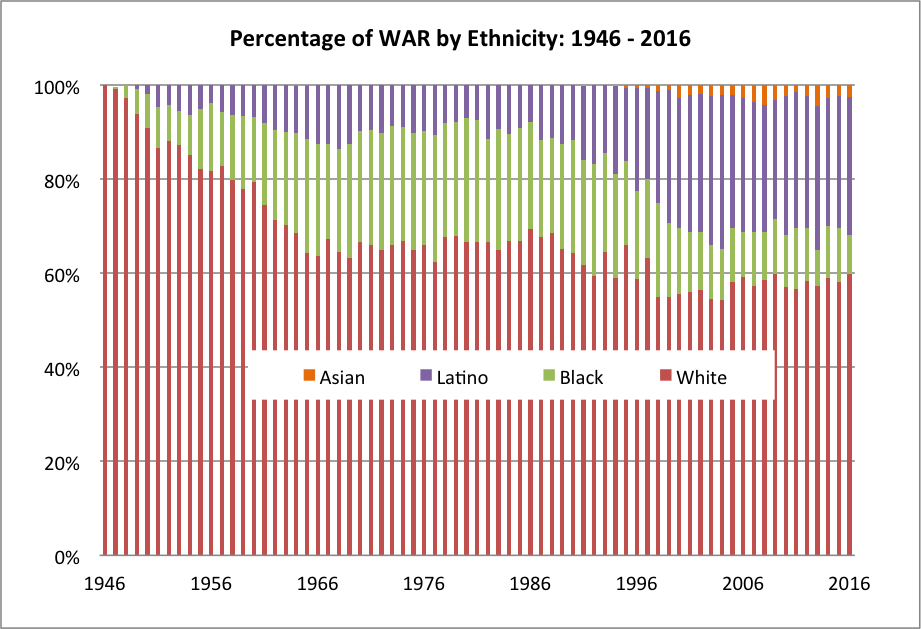
(Click image to enlarge)
It might not be obvious from the two graphs, but the African American percentages are consistently higher when considering value rather than just counting players.
Figure 6 below illustrates this more directly, comparing the raw percentage of African American players with the percentage of value they contributed.
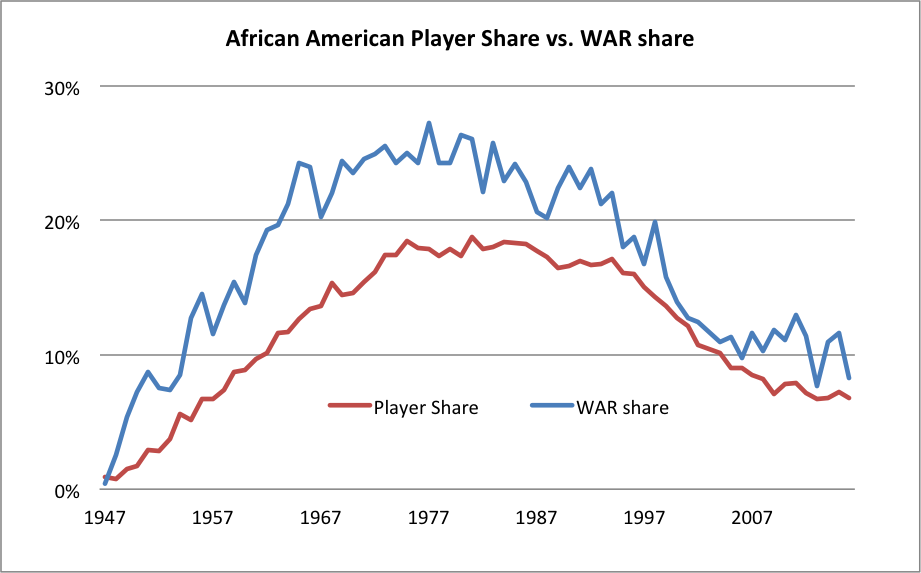
(Click image to enlarge)
From the very early days of integration African American players have provided more on-field value than their raw numbers would suggest. While the 1960s discrepancy might have been caused by the lingering effects of prejudice, the explanation today is likely less nefarious. Measuring WAR, rather than a simple player count, lessens the impact of the increasing number of players who are only on a roster for a few days or weeks (many of them pitchers) who earn little or no “value”. The WAR line is therefore a more accurate view of the impact of African American players in the game.
Of course the other major trend is the huge increase in the number of Latinos in Major League Baseball. As summarized in Table 1 above, the percentage grew slowly until the late 1960s, at which point the level plateaued at around 11 to 12 percent where it held steady for roughly 20 years. In the late 1980s the percentage of Latinos began growing rapidly until the early 2000s. Since then, the percentage has held steady in the mid to high twenty percent range.
Finally, it’s worth noting the presence of a small, but meaningful number of Asians in the game. Over the past dozen or so years, the percentage of Asians has been around two percent. Unlike earlier years, however, when the Asians were predominately pitchers, they are now more proportionately spread out over all positions.
Conclusions
The past 20 years has witnessed a decline in African American players in the game. This has become common knowledge, though we do not believe that the data has been publicly presented back to 1947 in a place that is easy to find.
The downward trend is present at all positions, although the overall decline has been exacerbated by the increased share of roster spots being allocated to pitchers and catchers. Also, looking at player value lessens some of the decline.
During this same period, the share of both Asians and Latinos has increased markedly, keeping the major leagues as diverse as it has ever been.
Further studies
The prevalent opinion seems to be that the cause of the decline in African Americans is external to major league baseball: that African Americans are focusing on other sports as youths, either by choice or because of fewer opportunities to play baseball. As far as we are aware, this issue has not been studied — it is reasoned speculation.
Could there be other factors? We showed above that the shift in how rosters are constructed (pitchers vs. position players) has had an effect. Could it be that there have been shifts in the types of skills that are emphasized (speed vs. power/patience) or where players are drafted (college vs. high school) that have disproportionately affected certain demographic groups? Clearly further research is called for to more fully understand the changing demographics of major league baseball.