
Baseball Demographics, 1947-2012
Editor’s note: Click here to read the updated version of this article, “Baseball Demographics, 1947-2016”.
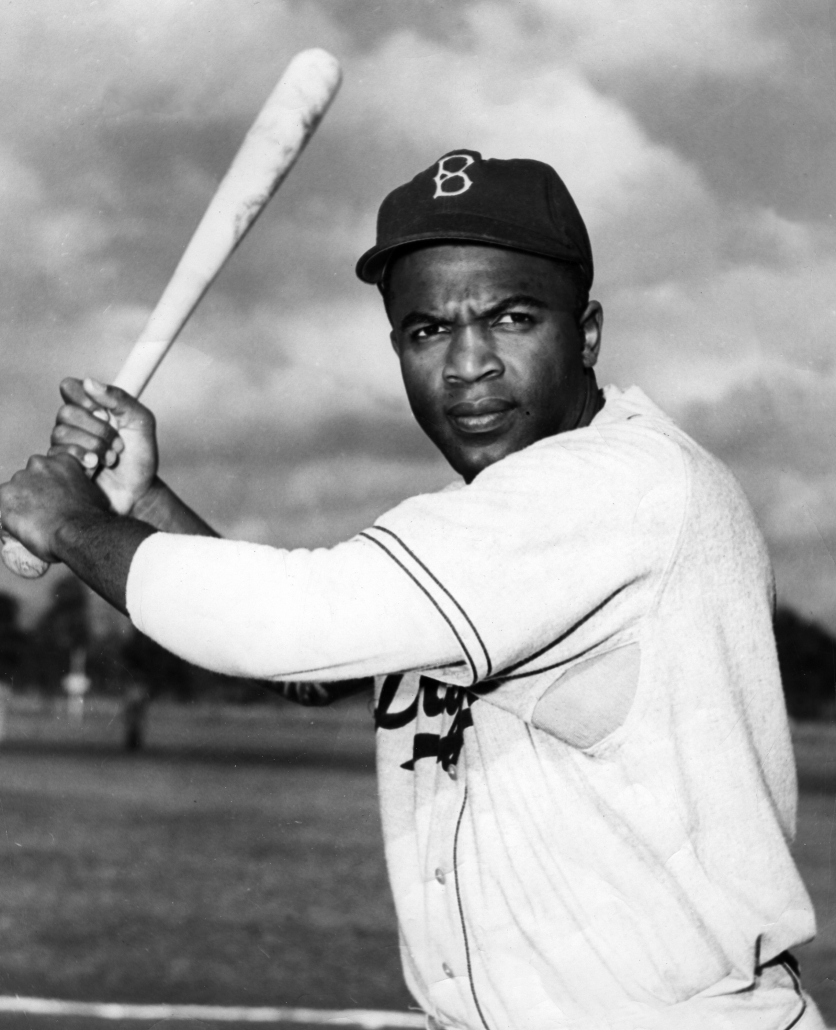
Several years ago, I (Mark) performed a research project to numerically define the spread of integration in major league baseball in the years following Jackie Robinson’s 1947 debut. This research was presented at the 2007 SABR convention in St. Louis, and then in the Fall 2007 Baseball Research Journal. The primary task of the project was to identify players from 1947 to 1986 (a 40-year period) who would not have been allowed to play before Robinson broke the color line. These players included both African-Americans and Afro-Latinos, though I also recorded the player’s country of birth, providing an approximation for distinguishing the two groups. Although my research was conducted independently, I was able to confirm my findings with several other people who had traveled down the same road, most notably Steve Treder, Rick Swaine, Thomas A. Timmerman and Jules Tygiel.
 In recent years, attention has increasingly focused on the obvious decline of African-Americans in the major leagues. Although my period of study ended in 1986 (at which point the decline had not begun), many published accounts have reported African-American player percentages from the 1970s that seemed too high based on my study. In April 2013 I was contacted by a number of media outlets who wanted to understand the discrepancy, and I shared my research on the subject.
However, I was asked one question more than any other: Why did you stop at 1986? My honest response was that the questions I was trying to answer in 2007 were satisfactorily addressed. I was studying the rise, not the decline. Nonetheless, the increased interest in the subject suggested that I needed to completely redo the study to make it up-to-date, and also to more deliberately separate the Latino players.
For the present study, Dan did the work to determine the 10,240 players who have played since 1947, which players played in which seasons, their primary positions and other demographic or statistical information. For each of these players, I divided them into four demographic categories: African-American, Latino, Asian, and White. We understand this is not an exact science. Many players are of mixed-race, from Roy Campanella to Derek Jeter. To some people, race is mostly about self-identification, others believe it to be cultural, and still others believe it is solely about skin color.
For the purposes of this article, skin color was necessarily the determining factor, principally because this is how Organized Baseball itself defined the issue prior to Robinson (and even for many years thereafter.) As there are more than 10,000 players, disagreements on a few of them are not going to change our conclusions.
Now that we have the data, there are many questions we can answer. We will answer a few of them here, starting with the most interesting one.
In each column of the below table, the number represents the percentage of the total pool of players in that season who belong to each ethnic group.
| Year | White | African- Americans |
Latino | Asian |
|---|---|---|---|---|
| 1947 | 98.3% | 0.9% | 0.7% | 0.0% |
| 1948 | 98.5% | 0.7% | 0.7% | 0.0% |
| 1949 | 96.6% | 1.5% | 1.9% | 0.0% |
| 1950 | 95.3% | 1.7% | 3.0% | 0.0% |
| 1951 | 94.3% | 2.9% | 2.8% | 0.0% |
| 1952 | 94.4% | 2.9% | 2.7% | 0.0% |
| 1953 | 93.3% | 3.7% | 3.0% | 0.0% |
| 1954 | 90.7% | 5.6% | 3.7% | 0.0% |
| 1955 | 89.8% | 5.2% | 5.0% | 0.0% |
| 1956 | 88.2% | 6.7% | 5.1% | 0.0% |
| 1957 | 88.1% | 6.7% | 5.2% | 0.0% |
| 1958 | 86.7% | 7.4% | 5.9% | 0.0% |
| 1959 | 84.8% | 8.8% | 6.5% | 0.0% |
| 1960 | 82.3% | 8.9% | 8.9% | 0.0% |
| 1961 | 82.6% | 9.7% | 7.7% | 0.0% |
| 1962 | 81.9% | 10.1% | 8.0% | 0.0% |
| 1963 | 80.1% | 11.7% | 8.2% | 0.0% |
| 1964 | 79.3% | 11.7% | 8.9% | 0.1% |
| 1965 | 78.3% | 12.7% | 8.8% | 0.1% |
| 1966 | 76.9% | 13.4% | 9.7% | 0.0% |
| 1967 | 75.6% | 13.6% | 10.7% | 0.0% |
| 1968 | 73.8% | 15.4% | 10.8% | 0.0% |
| 1969 | 74.4% | 14.5% | 11.1% | 0.0% |
| 1970 | 73.7% | 14.6% | 11.7% | 0.0% |
| 1971 | 73.9% | 15.5% | 10.6% | 0.0% |
| 1972 | 72.9% | 16.1% | 10.9% | 0.0% |
| 1973 | 71.6% | 17.4% | 11.0% | 0.0% |
| 1974 | 71.1% | 17.4% | 11.5% | 0.0% |
| 1975 | 71.3% | 18.5% | 10.2% | 0.0% |
| 1976 | 70.5% | 18.0% | 11.5% | 0.0% |
| 1977 | 70.7% | 17.9% | 11.4% | 0.0% |
| 1978 | 71.3% | 17.4% | 11.3% | 0.0% |
| 1979 | 71.4% | 17.9% | 10.7% | 0.0% |
| 1980 | 71.1% | 17.4% | 11.6% | 0.0% |
| 1981 | 70.1% | 18.7% | 11.1% | 0.0% |
| 1982 | 70.4% | 17.9% | 11.7% | 0.0% |
| 1983 | 70.3% | 18.0% | 11.6% | 0.0% |
| 1984 | 69.6% | 18.4% | 12.0% | 0.0% |
| 1985 | 70.3% | 18.3% | 11.3% | 0.0% |
| 1986 | 70.0% | 18.3% | 11.8% | 0.0% |
| 1987 | 69.9% | 17.7% | 12.3% | 0.0% |
| 1988 | 68.2% | 17.3% | 14.5% | 0.0% |
| 1989 | 70.3% | 16.5% | 13.2% | 0.0% |
| 1990 | 68.6% | 16.6% | 14.8% | 0.0% |
| 1991 | 66.8% | 17.0% | 16.1% | 0.1% |
| 1992 | 67.7% | 16.7% | 15.6% | 0.0% |
| 1993 | 66.3% | 16.8% | 16.9% | 0.0% |
| 1994 | 65.0% | 17.2% | 17.8% | 0.1% |
| 1995 | 64.5% | 16.1% | 19.2% | 0.2% |
| 1996 | 63.2% | 16.0% | 20.4% | 0.4% |
| 1997 | 60.9% | 15.0% | 23.5% | 0.5% |
| 1998 | 62.0% | 14.3% | 22.8% | 0.8% |
| 1999 | 61.7% | 13.6% | 23.5% | 1.2% |
| 2000 | 61.2% | 12.8% | 24.7% | 1.3% |
| 2001 | 60.7% | 12.1% | 26.0% | 1.2% |
| 2002 | 60.8% | 10.8% | 26.5% | 1.9% |
| 2003 | 61.0% | 10.4% | 26.8% | 1.8% |
| 2004 | 60.3% | 10.1% | 27.7% | 1.8% |
| 2005 | 60.9% | 9.1% | 27.8% | 2.3% |
| 2006 | 61.3% | 9.0% | 27.8% | 1.9% |
| 2007 | 63.1% | 8.5% | 26.1% | 2.2% |
| 2008 | 62.1% | 8.2% | 27.3% | 2.3% |
| 2009 | 62.2% | 7.1% | 28.5% | 2.1% |
| 2010 | 63.0% | 7.8% | 27.2% | 1.9% |
| 2011 | 63.5% | 7.9% | 26.9% | 1.7% |
| 2012 | 63.9% | 7.2% | 26.9% | 1.9% |
Or, if you prefer, here is the same data in graphical form:
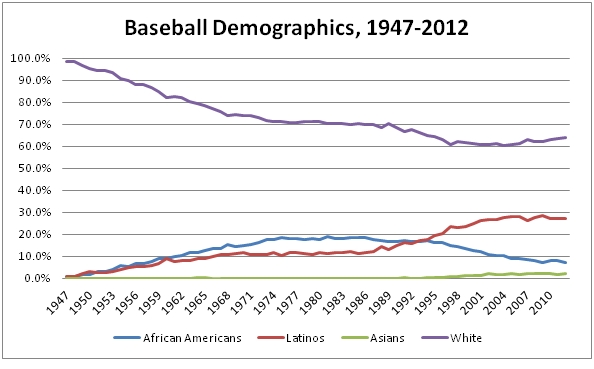
(Click to enlarge)
The percentage of African-Americans held steady between 16% and 19% for a quarter-century (1972-1996) but has since plummeted by more than half. There is seemingly no end to theories as to why this happened, but most of them are speculative. The consensus seems to mostly identify causes external to the game: African-Americans are choosing to play other sports; there are fewer opportunities to play in urban areas, etc. Our purpose here is not to determine the reasons, but to examine the data and see what it might show us.
One undeniable change in baseball rosters in the past generation is the growth of the pitching staff at the expense of position players. Black players, for whatever reason, tend to be position players, especially outfielders. We wondered whether this was part of the explanation for the decline.
A methodological note: We assigned each player a primary position for their career, and then treated him as if he played only a single position. Again, since we are looking for trends in a pool of more than 10,000 players, this simplification will not materially impact our conclusions.
So what positions are African-Americans playing?
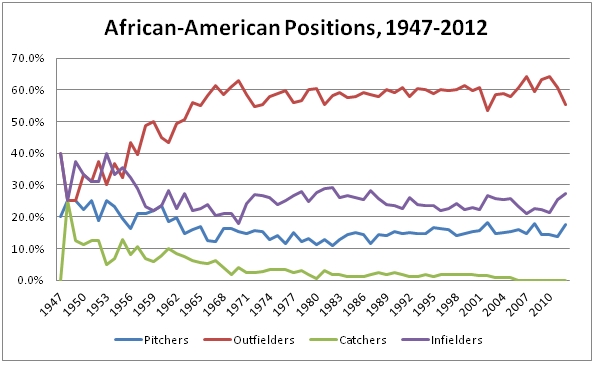
More often than not, African-American players are outfielders. In fact, the positional distribution has not changed much in the past 40 years. This implies that the drop in all African-American players is not particularly position-specific. The next few graphs will demonstrate this more directly.
The next graph shows the annual change in demographics for pitchers only.

African-Americans have never been heavily represented among pitchers — making up over 6% of the pool only a handful of times — but there are now 10 times as many Latino pitchers as there are African-Americans.
As noted above, in an unrelated trend, pitchers now make up a larger percentage of a team’s roster. Throughout the 1960s and 1970s, pitchers were between 39% and 44% of the total player pool. Since 2006, pitchers have been over 50% of the pool. The reduction in position players is one of the reasons — one of many, to be sure — for the drop in African-Americans in the game.
The story at catcher is even more dramatic.
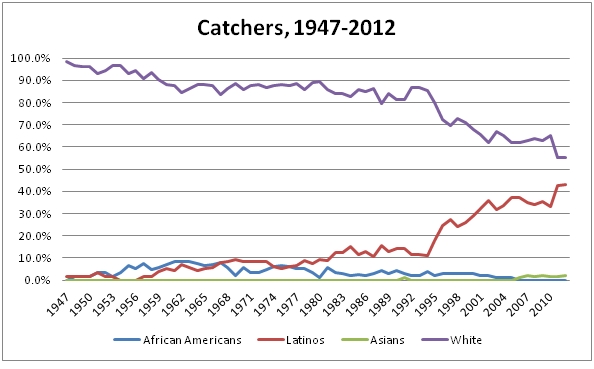
The last US-born African-American whose primary position was catcher was Charles Johnson back in 2005. Meanwhile, Latinos are increasing their representation at the position.
Pitchers and catchers now generally occupy 14 or 15 of the 25 roster slots. For the most part, African-Americans are not playing these positions and are instead competing for the remaining 10 or 11 places on the team.

The graph for middle infielders shows the strong representation from Latino players beginning in the 1950s and continuing to the present day. More than half of middle infielders were Latino for the period 2003-2006.
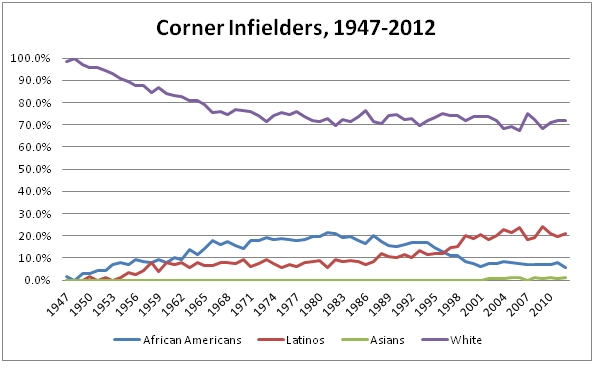
The infield corners are typically power positions, and African-Americans made up 15-20% of these spots for 30 years. By the turn of the century this had changed, and now Latinos are four times more present at the corner infield than African-Americans.
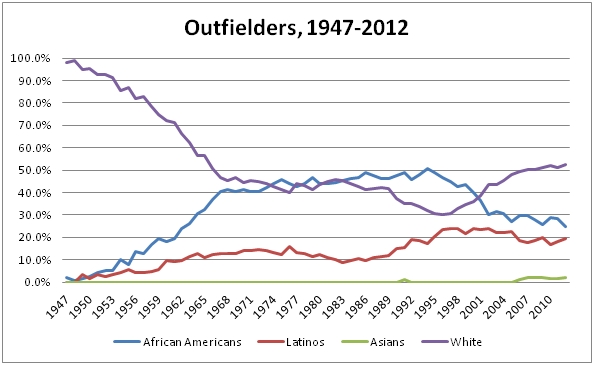
Major league outfielders were over 40% African-American for a 30-year period (1967-1999) before dropping below 30%. The share of Latino outfielders has remained around 20% for the past twenty years during the period of the African-American decline.
We mentioned earlier that the pool of outfielders is shrinking, but African-Americans’ share of the pool is also shrinking, even though their numbers are still strong relative to the rest of the positions on the field.
Conclusions
The past 20 years has witnessed a decline in African-American players in the game. This has become common knowledge, though we do not believe that the data has been publicly presented back to 1947 in a place that is easy to find.
The downward trend is present at all positions, although the overall decline has been exacerbated by the increased share of roster spots being allocated to pitchers and catchers.
Further studies
The prevalent opinion seems to be that the cause of the decline in African-Americans is external to major league baseball: that African-Americans are focusing on other sports as youths, either by choice or because of fewer opportunities to play baseball. As far as we are aware, this issue has not been studied — it is reasoned speculation.
Could there be other factors? We showed above that the shift in how rosters are constructed (pitchers vs. position players) has had an effect. Could it be that there have been shifts in the types of skills that are emphasized (speed vs. power/patience) or where players are drafted (college vs. high school) that have disproportionately affected certain demographic groups? Clearly further research is called for to more fully understand the changing demographics of major league baseball.