
Baseball Integration, 1947-1986
This article was written by Mark Armour
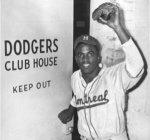
In early 2007 major league baseball marked the 60th anniversary of Jackie Robinson’s first season with the Dodgers, bringing an end to a sixty-year ban on black players in the major leagues. The story of Robinson and the brave men who followed his lead and helped change the game has been told often and well over the succeeding years. The story tends to focus on the moral and ethical implications of the game’s integration, the righting of baseball’s great wrong, as well as on the troubles endured by the heroic men who led the way.
The study presented here begins with 1947, but it concerns itself not with social justice or heroism, but with the effect of integration on the playing field. Jackie Robinson improved baseball ethically and morally, which is plenty, but he also made it better because he was a great player, and his playing time came at the expense of someone who was a lesser player. Robinson opened the doors for a vast new source of baseball talent, and that talent could not help but dramatically improve the game.
I began following baseball a generation after Robinson, in the late 1960s. The baseball I grew up with was well integrated, as far as I knew. In fact, many of the best players seemed to be black men, people who would not have been able to play 25 years earlier. Commentators of the time, and the occasional outspoken player, would whisper that it remained difficult for a black man to make a team if he was not a star—for example, few teams carried black utility infielders. After mulling this over for forty years, I finally decided to try to determine if this was true.
Related link: For an update to this study, see “Baseball Demographics, 1947-2016” by Mark Armour and Dan Levitt
The first, and ultimately most difficult, step in this study was to determine which players were “black” and which were not. The so-called “color line” was never acknowledged, let alone defined. For other purposes, one might be interested in differentiating between African-American players and dark-skinned Latinos, and in today’s culture we would consider certain players “bi-racial”. For my purpose, such distinctions are unnecessary. I only needed to determine which players would not have been able to play during the days when black players were prohibited from playing. For almost all players the determination is straight-forward. Lou Brock is black, Al Kaline is not black, etc. For the players I could not recall or never knew, I had to scout down pictures or baseball cards, or solicit the help of other SABR members. To summarize, when I refer to “black” players in this study, I am using the term generically to include any player who would have been prohibited from playing major league baseball before 1947.
I do not claim that this is an exact science, but the types of questions I am trying to answer here would not be affected by the misidentification of a few players. Ultimately, I made a determination for every player who played in this 40 year period, a total of 5490. According to my findings, there were 933 black players in this period, beginning with Jackie Robinson in 1947, and ending with Ruben Rodriguez, who caught two games for the Pirates in September of 1986. Putting all of these players in a data base, I can answer any number of questions. I present a few of these here.
How quick was the pace of integration?

Figure 1
The graph in Figure 1 shows the percentage of major league players in a given season who were black. The number increased slowly at first, but accelerated in the mid-1950s and was still growing at the end of this 40 year period. Black players first accounted for 10% of rosters in 1958, reached 20% in 1965, and 28% in 1986. Recent studies suggest the number is over 30% today (to reiterate, I am including dark-skinned Latinos as well as African-American players).
This is part of what I wanted to know, but this graph gives all players–Willie Mays and Julio Gotay–equal weight. I next needed to separate the quality from the quantity.
How integrated were the All-Star teams?
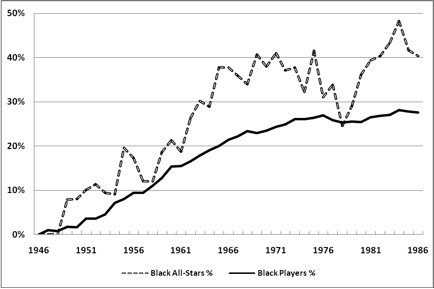
Figure 2
In Figure 2, the solid line again shows the percentage of blacks on major league rosters, while the new line shows the percentage of blacks on the two mid-season all-star teams. This graph clearly shows that there were more black players on all-star teams than one would expect if all-stars were randomly distributed. In 1965, for example, while 20% of all players were black, they accounted for 38% of the all-stars. Based on the overall percentage of black players in the majors, one might have expected roughly 11 of the 53 players on the all-star teams to be black; in fact, there were 20. As the graph highlights, this discrepancy was quite common during the era under study.
All-star teams are not a precise representation of the best players, of course. Besides the human biases that go into the selections, the all-star rosters require a player from each team and a balancing of positions. What we really want to know is: who were the real star players in baseball, and who were providing the most value?
How many of the “real” star players were black?
Win Shares, a system invented by Bill James that allocates team wins to individual players, lends itself well to studying large pools of players. One can always argue about some of the individual components of the highly complex formula, but when aggregating 5500 players over 40 seasons one would expect any imbalances to average themselves out. As a point of reference, James suggests that a player who earns 20 Win Shares had a star-quality season. Again, one can find examples of 19 Win Share seasons which are better than 22 Win Share seasons, but over tens of thousands of player-seasons, these anomalies are of little importance. It turns out that the number of 20 Win Share seasons in a league is similar to the size of All-Star rosters—20 or 25 per league or so in the 1950s, and about 35 today with the larger league sizes.

Figure 3
When contrasted with Figure 2, Figure 3 shows that the “real” star players were even more likely to be black than the All-Star teams. Returning to 1965, black players made up 20% of team rosters, and fully 44% of the “star” players in baseball. This is not an anomalous season—these results are repeated to some extent for most every season for 20 years.
From another perspective this discrepancy is even starker. In 1965, 6.4% of white major leagues (36 out of 562) were star players, while 20% of blacks players (28 of 140) were stars, a percentage three times as large.
What was the total contribution of Black players?
A more thorough way to examine the contributions of black players is to figure how much value the entire group was providing. To examine this question, I summed the Win Shares accumulated by every black player, and calculated the percentage of total Win Shares these men accounted for.

Figure 4
Figure 4 confirms the evidence of the previous two graphs: the black players were consistently doing more than their share of the work. The solid line again is the percentage of black players in the major leagues, while the dotted line represents the value they were producing. In 1965 when black players made up 20% of major league players, they accounted for 28% of the value, a huge difference when considering the size of the pool.
As an aside, it is ironic that many people consider baseball post-1960 as diluted by expansion, even as this great talent source was finally being mined. If 28% of the talent in the league was not allowed to play a generation before, how likely is it that the game was of lesser quality? Baseball in the 1960s had 25% more teams (20 versus 16), but the addition of black players easily accounts for that increase, even as blacks likely remained underrepresented.
As I pushed this study further out, I expected the two lines in Figure 4 to converge. In fact, although they got closer, there remained a significant gap in 1986, strongly suggesting that lesser skilled black players still had a tougher time getting work. It would be interesting to see how this trend has evolved over the past 20 years.
How large was the difference between the two leagues?
Let’s first take a closer look at the American League.
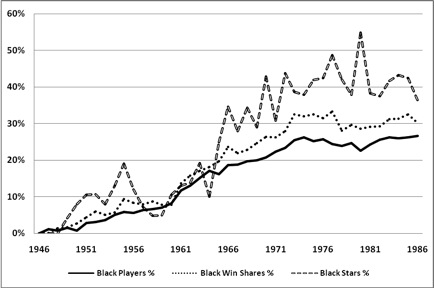
Figure 5: American League
Figure 5 shows the percentage of American League players who were black (solid line), the percentage of star players who were black (dashed line), and the overall value of the black players. The American League integrated slowly, and other than for a few years in the mid-1950s, the black players in the league were performing about as one would expect from their share of the rosters through the mid-1960s. During the late 1960s, however, as the American League became more fully integrated, black stars began to make up larger percentage of the talent base than suggested by their numbers alone.
In the National League, the story is much more dramatic, as shown in Figure 6.

Figure 6: National League
By the early 1960s, half of the stars in the league were black, and the number was over 60% by 1967. The dramatic effect of the star players illustrated in Figure 3 is nearly completely fueled by the NL; the AL did not begin to field many black stars until the late 1960s.
Finally, one can just plot the difference in the value of the black player in the two leagues.

Figure 7
In Figure 7 we do not plot lines for the two leagues, but just look at the difference in the value of each league’s black players, subtracting the AL share from the NL share. The NL had a small advantage in the early years of integration, but their edge grew rapidly in the late 1950s and remained strong into the early 1970s. This graph highlights the National League’s superior ability to not only find black players but to find the best black players. In the National League they accounted for roughly 30% of the league’s player value by 1961, more than 15 percentage points ahead of that achieved in the less integrated junior circuit–a gap that persisted for the next decade. To put this more concretely, the difference in the two leagues was about 40 Win Shares per team, which is a peak-level Willie Mays season.
Why did the leagues take different paths in this area? Perhaps it is as simple as teams imitating the best clubs in their league. In the National League, the Dodgers provided a model of excellence for the other teams to follow, and first the Giants and Braves, and later the Cardinals brought in black players and became consistently competitive. In the American League, the Yankees won every year with very little help from black players.
How about the top-flight stars, the future Hall of Famers?
I will conclude with a look at the career superstars, the future Hall of Famers. Rather than using percentages, I focused on the number of these players who were performing in each league. For the purposes of this chart, I have not included Satchel Paige or Willard Brown, deserving Hall of Famers inducted for their great careers outside of the major leagues.

Figure 8
In 1947, each league had a single Hall of Famer—Jackie Robinson, and Larry Doby. Doby remained the sole American Leaguer until his retirement in 1959—at which point there were no black Hall of Famers in the AL for six years.
Meanwhile, the NL added a new Hall of Famer nearly every season, until 1965 when their gap on the Americans was 15-0. In 1966, Frank Robinson was traded to the Orioles, reducing the gap to 14-1, and, perhaps not surprisingly, he was immediately the best player in the AL, winning the Triple Crown.
It should be noted that the players represented on this chart were all top-flight stars. The Veterans Committee, the so-called “back door” into the Hall of Fame, has inducted only two black players—Larry Doby and Orlando Cepeda—along with several white players from this period. Furthermore, if one removed the contributions of the 15 National League Hall of Famers from 1965, the remaining black players in the NL still accumulated more Win Shares than their AL counterparts. The NL dominance extends past the superstars.
What can one conclude about the talent levels in the two leagues?
Win Shares is inadequate to definitively answer a question like this. If you add up the Win Shares of the players in the two leagues they will be exactly equal, because Win Shares begins with the assumption that the two leagues are the same—Win Shares is a parsing out of credit for all of the wins a team achieves. Since each league has the same number of wins, they will also have the same number of Win Shares. To the point, in order for the leagues to be of comparable strength in the 1960s, the white American Leaguers would have to have been significantly better than the white National Leaguers.
Could this be true?
Returning to 1965 again, who were the best players, of any color, in the American League? According to Win Shares, the best players were Tony Oliva, Zoilo Versalles (who won the league’s MVP award), and Don Buford, three fine black players. Going down the list, the best AL white players that year were Rocky Colavito, Brooks Robinson, Curt Blefary and Jim Hall. How much better could they really have been than Sandy Koufax, Don Drysdale, Pete Rose, Jim Bunning, and Ron Santo, each of whom had excellent seasons that year in the NL?
Admittedly, this is not proof. But I suggest we should all take with a grain of salt comparisons of, for example, Willie Mays and Mickey Mantle, which do not include a huge adjustment for the quality of the two leagues. According to Win Shares, Mickey Mantle deserved his third MVP Award in 1962, beating out Norm Siebern and Floyd Robinson. Meanwhile, Willie Mays competed with a large crop of superstars to win just two MVPs. He might have won every year had he changed leagues.
How much did the black players improve the game?
One argument often used in making the case to induct players from the Negro Leagues into the Hall of Fame is that there were just as many great black players playing before 1947 as there were afterwards. This argument, while not without holes, is a compelling one. There were players like Willie Mays and Frank Robinson playing in the 1930s, the theory goes, and they should be honored just as their successors were.
A parallel argument is to consider the game of the 1960s without its great black players. The baseball of the 1930s, I propose, was comparable to the baseball of the 1960s if all of the black players were somehow removed from the game. Had segregation continued for another generation, players like Harmon Killebrew, Ron Santo, and Norm Cash would have been the superstars and baseball fans who focused solely or largely on the white major leagues would not have known that there were better players who were not able to play. Mays and Aaron and Clemente, those wonderful players who remade the game, would have remained in the shadows, and we would be wondering today whether they really could have competed in the great major leagues.
What would baseball have been like in 1965 without Willie Mays and the 27 other black stars? It would have been immeasurably worse. It would have been, I suggest, comparable to the baseball played in 1946.
Note: This article was originally published as “The Effects of Integration,” in Jim Charlton (editor), Baseball Research Journal 36 (SABR, 2007).
- Related link: For an update to this study, see “Baseball Demographics, 1947-2016” by Mark Armour and Dan Levitt.
Sources
The main data I relied on for this study was gathered by hand, poring over baseball cards and hundreds of pictures found on the internet. Many SABR members helped me in determining the “race” of the 5490 players, but I want to especially mention three: Rick Swaine and Steve Treder have each been working on research that overlaps what I present here, and were generous with their findings; and Bill Hickman found pictures of many of the most obscure players that had eluded me from this period. Once I had the black players identified, Dan Levitt provided me year-by-year Win Shares totals for each of my players, and (as usual) helped me think through many of the ideas contained in this paper. Bill James’s Win Shares (Stats Publishing, 2002) was also necessary, of course.