1899 National League Strikeouts
This article was written by Jonathan Frankel
This article was published in 2007 Baseball Research Journal
This article details my research and summation of 1899 National League batter strikeouts. Batter strikeouts from this period are not documented and summarized in any common source by individual batters. The team totals of batter strikeouts do exist in season totals as well as in the era’s box scores.
I was able to document individual batter strikeouts in 87 percent of the 1899 games. As a result, I feel comfortable in giving a basic projection of what the individual batter strikeout totals would be. The leaders on both the most and least sides as well as the entire 1899 National League roster are included in this research. The purpose of the research is to fill in the gaps in the baseball records as much as possible but also to give a good idea of which players were more or less “strikeout-prone.”
WHY NO BATTER STRIKEOUTS IN 1899?
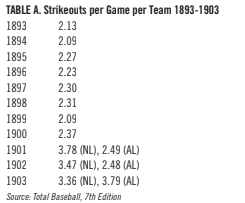
From 1897 through 1909, there are no individual batter strikeouts officially documented. The Boston Globe had been documenting individual strikeouts for some years prior to 1897, but discontinued this practice prior to the 1897 season. To give some perspective about strikeouts during this period, Table A shows the strikeouts per game by year from 1893 through 1903. This 10-year period is somewhat arbitrarily picked, but it covers the era leading up to the adoption of the foul strike rule by both leagues. It also starts with the changed pitching distance that we have today.
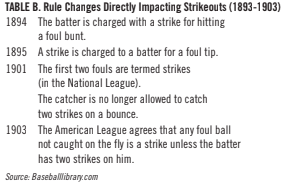
Table B covers the same period and lists the rules that impacted the nature of the strikeout. Of course, there are other rules dealing with the ball and the plate that affected the nature of the strikeout (e.g., 1900—the introduction of the five-sided plate), but these rules directly deal with the nature of the strikeout. This adds additional perspective about the nature of the strikeout. One key change was the foul strike rule of 1901, which was adopted by the American League in 1903. This altered the strategy of some players (e.g., Willie Keeler) and, as can be seen below, dramatically affected the leagues. Further research of individual batter strikeouts during these transitional years will tell the true individual impact of that rule change.
WHY 1899? WHY BATTER STRIKEOUTS?
This research actually started as an analysis of the lineups and substitutions that the 1899 Cleveland Spiders used during their fateful season. I became interested in the Spiders many years ago and started documenting their lineup and those of the other 11 National League teams, as well as various team pitching statistics. In the course of this research, I noticed in Sporting Life that for Philadelphia home games, the individual batter strikeouts were documented. This led me to further research this then undocumented stat (in this era). Of course, my research of 1899 opened me up to many other interesting happenings of the season— John McGraw’s magical .391 season with 73 stolen bases and 140 walks, tragically interrupted by the sudden death of his first wife, Minnie, at age 22; Buck Freeman’s 25 homers; the 27 triples of rookie Jimmy Williams; and other highlights.
RESEARCH
I asked fellow SABR members for sources where I might find batter strikeouts. One person directed me to the New York Evening Telegram, since it had play-by-play documented for most of the Giant and Brooklyn games of the era. This turned out to be a great source. I started researching other cities’ local coverage through ProQuest Historical Newspapers and interlibrary loans of the other local newspapers’ microfilms. In addition, through Greg Rhodes and Chris Eckes of the Reds Hall of Fame Museum, I was able to review a Cincinnati score book which contained about the first month’s worth of Reds games.
From my initial lineup research, I already had the total number of batter strikeouts for each team in each game; I just needed to identify who made those strikeouts. I discovered that 11 of the 12 teams had documented individual batter strikeouts for at least their home games. Brooklyn, New York, Chicago, and St. Louis, to varying degrees, had away-game batter strikeouts as well. Cincinnati and Louisville had no local papers which identified individual batter strikeouts, though I was able to extract a few from the aforementioned Reds scorebook. With the exception of the New York Evening Telegram and the Reds score book, which had play-by-play coverage, I gathered the individual batter strikeouts from the box scores. I included all newspapers that had individual batter strikeouts documented for both the home and visiting teams.
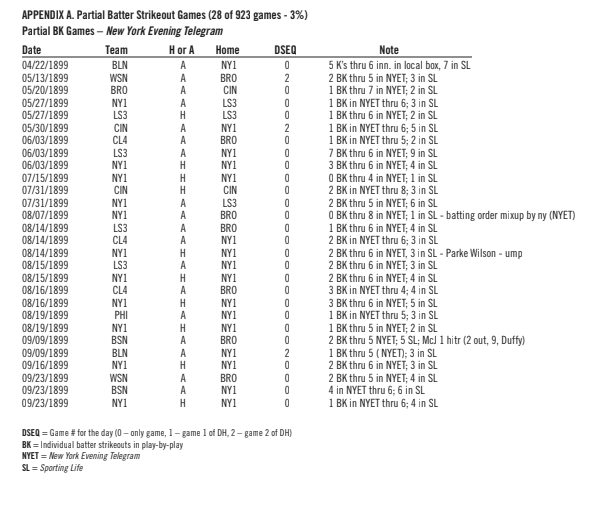
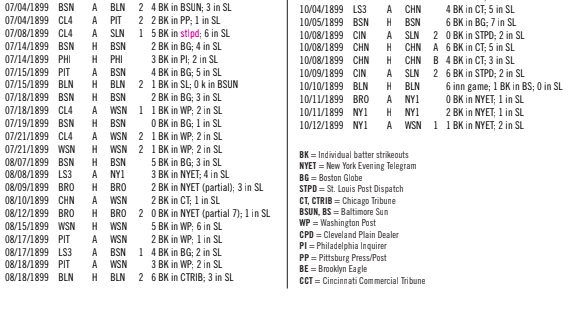
In the New York Evening Telegram, being an evening paper, the game accounts were of that day’s game(s). As a result, there were cases where the play-by-play of the second game was not complete. There are also instances where the first game does not have play-byplay at all. Incomplete play-by-play also occurred in games that were played in the West (St. Louis, Chicago, Louisville, and Cincinnati). Incomplete games are documented in Appendix A. Of note, the Pittsburg Post had an end-of-year summary of individual batter strikeouts.
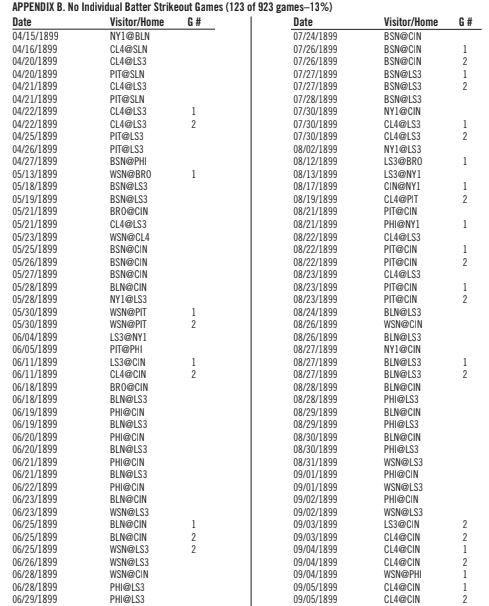
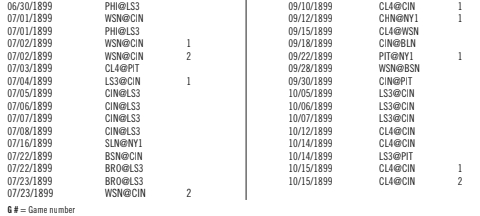
As noted above, most teams had the home individual batter strikeouts, while a couple had road game batter strikeouts; however, two cities had no such information, Cincinnati and Louisville. The Louisville and Cincinnati home games account for the vast majority of the missing batter strikeout games. All missing (or “no batter strikeout”) games are documented in Appendix B and account for 13% of all of the games played.
There were a few variances in the number of strikeouts documented in Sporting Life (as team totals) and the total number of individual strikeout totals. There were cases when back-to-back games between two teams varied by +1 in the first game and -1 in the second of the series—thus “correcting” each other. The number of variation occurrences only accounts for 6.3% of all documented games and are documented in Appendix C.
Regarding the discrepancy, a fair question is which should be considered more “accurate” as to what actually occurred, the summary team game total or the individual summation? In the case of this research and analysis, I deferred to the local coverage and individual strikeout totals. [Of course, there were multiple newspapers that may differ from the source I selected, but in many cases these papers were using the same summary source. However, in reading game summaries, I did find some strikeouts not documented in the detailed box scores.
DATA SUMMARY APPROACH
Since only Chicago had complete home and away individual batter strikeouts, I was unable to get a complete picture of the totals. For the other teams I was able to piece together their home game coverage with the other teams’ home coverage to tabulate a great deal of the individual strikeouts. I then projected the batter strikeouts for each player, based on the number of games that I had individual batter strikeouts for (including partial game stats) over the total number of games played. Projections are based on documented batter strikeouts per game (not at-bat).
A potential additional step to getting “more accurate” numbers would be to assess each of the remaining missing 13 percent of the games’ box scores and their listed team strikeout totals. I would then have to assign (ala integer programming) strikeouts to the team’s players based on the most probable strikeout victims (based on their frequency from the documented games). This would get us closer, but is still not exact.
SUMMARY OF RESULTS
The controversial Ducky Holmes of the Baltimore Orioles (see Freedman vs. Holmes, 1898), who had 51 documented strikeouts in 123 of his 138 games (89.1%), led the NL with a projected total of 57. There is a four-way tie in second place between the veteran shortstop Monte Cross, of Philadelphia; youngster and stolen base champ, Jimmy Sheckard; the leading rookie of the year candidate and triples leader, Jimmy Williams of the Pittsburgh Pirates; and second-year player Danny Green of the Chicago Orphans, all with projected totals of 50. Cross had 45 strikeouts documented in 138 of his 154 games (89.6%), Sheckard had 46 strikeouts documented in 135 of his 147 games (91.8%), Williams had 46 strikeouts documented in 142 of his 153 games (92.8%), and Green had 50 strikeouts in his completely documented 117 games.
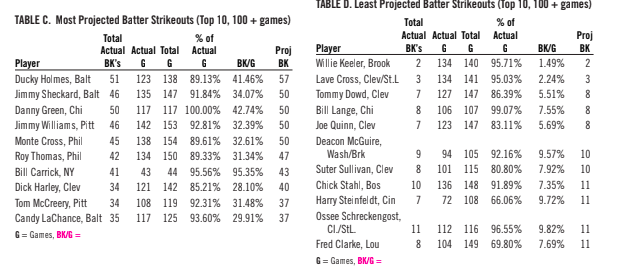
(Click image to enlarge)
At the other end, Willie Keeler showed that he lived up to his documented reputation of making contact by having only two documented strikeouts in 134 of his 140 games (95.7%)—with a projected total of two strikeouts. Lave Cross started the season with the Spiders and once he showed he was useful was moved over to Robison’s parent club, the St. Louis Perfectos, had three documented strikeouts in 134 of his 141 games (95%), projecting out to only three strikeouts.
Keeler’s two strikeouts occurred on April 17 (Brooklyn’s second game of the season) at the hands of Boston’s rookie sensation, Vic Willis (in his major league debut) and May 6 (Brooklyn’s 19th game) against Boston’s Kid Nichols. After that, he did not strike out again for the remainder of the season. By contrast, Cross’s three strikeouts all occurred at the end of the season. His first strikeout occurred in the second game of a doubleheader on September 13 at the hands of Boston’s rookie Harvey Bailey, making his seventh major league appearance. His second strikeout was on September 17 by (Bill Carrick or Willie Garoni), and his final punchout was on October 4 by Pittsburgh’s Bill Hoffer.
Ironically, another player who had a reputation for getting on base and great bat control, rookie Roy Thomas, had a projected 47 strikeouts (42 documented, 134/150 games) to go with his 115 walks. Interestingly, three of the top seven in the “least” category were members of the Cleveland Spiders, with the aforementioned Cross, a partial fourth, and a fifth, in eighth place, “Schreck,” playing 40% of his season with them.
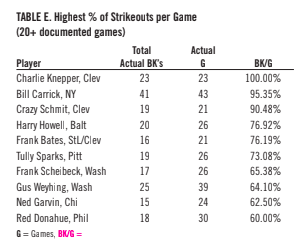
Not surprisingly, all players with the highest percentage of strikeouts per game were pitchers, with the exception of Frank Scheibeck, a late-season infield addition to Washington. The Spiders are again well represented with three of the top five. The highest everyday player was Chicago’s Danny Green with a percentage of 42.74.
OTHER STRIKEOUTS STATS
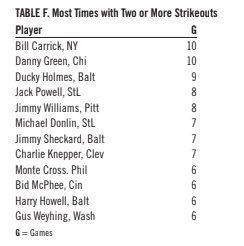
Bill Carrick, a pitcher for New York, and Danny Green of Chicago had the most games with two or more strikeouts with 10. Ducky Holmes of Baltimore with nine and Jack Powell of the St. Louis Perfectos were right behind with nine and eight respectively. Bid McPhee should be given special mention with his six multi-strikeout games, since only 63% of his games are documented.
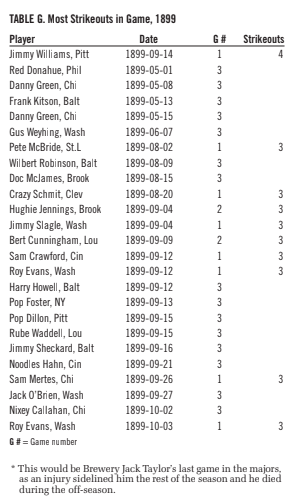
In game one of a doubleheader on September 14, Jimmy Williams, who would lead the league with 27 triples, had four strikeouts against Doc McJames of the Brooklyn Superbas, the most in the National League. There were 24 occurrences of games with three strikeouts, with Chicago’s Danny Green and Washington’s Roy Evans having two such games—Evans, on September 12 against Cincinnati’s Jack Taylor,* and Heinie Peitz in Evans’ first game of the season, and later, on October 3, against Brooklyn’s Jay Hughes. Green’s three-strikeout games were against Cleveland’s Willie Sudhoff on May 8 and Pittsburgh’s Sam Leever and Jesse Tannehill on May 15. Interestingly, 16 of the 25 three or more strikeout games occurred after Labor Day, with recently signed players from the minor leagues (these leagues had finished their schedules) such as Roy Evans (from Providence), Sam Crawford (from Grand Rapids), Rube Waddell (from Grand Rapids), and Pop Dillon (from Buffalo) having joined the circuit.
One last note of interest deals with Washington’s slugger Buck Freeman. Freeman appears to have achieved the rare feat in 1899 of having more homers (25) than projected strikeouts (24), plus he also had more triples (25) too. He just missed having more stolen bases (21) as well. As Mel Allen might have said, “How about that!”
SUMMARY
With 87% of the 1899 National League games having individual batter strikeouts documented, I was able to get a very good vision of who the players were who were the most and least strikeout prone during the campaign. Though there was a little variance in documented totals and the individual counts as well as few partial games, I was able to get a good picture of the season. Totals into the other seasons, including 1898 and the pivotal 1901-03 seasons, remains for future research.
ACKNOWLEDGMENTS
I wish to acknowledge the following people for their assistance and referrals in this project—the interlibrary loan staff at the Plymouth (MI) District Library, John Zajc, Paul Wendt, Greg Rhodes, Chris Eckes, Fred Schuld, Mike Grahek, Pete Palmer, Pete Mancuso, and Denis Repp.