

A Manifesto for Defensive Baseball Statistics
This article was written by Jon Bruschke
This article was published in 2007 Baseball Research Journal
Current defensive statistics are far less meaningful than batting or fielding statistics, mostly because the correct information is not collected. Statistics that do exist tend either to be not revealing or incredibly complex. I propose the collection of a single new piece of information that I think might change popular understandings of defense and allow complex analyses. By simply assessing the difficulty of the play, it should be possible to measure Hit Saving Plays and Difficult Plays Not Made. Sample data are presented for the first 21 games of the 2004 Anaheim Angels season.
Defense makes a profound difference in the outcome of baseball games but is usually not reflected in official statistics. Consider the Angel-Mariner game on July 7, 2005. With the Mariners leading 4-0 in the second inning, and two outs and two runners on, Richie Sexson hit a chopper to the hole. Dallas McPherson hesitated, had the ball glance off his glove, and watched it fall behind him on a play the official scorer ruled a hit. The next batter cleared the bases with a double to make the score an out-of-reach 7-0. The starter, Bartolo Colon, then blanked the Mariners for the next four innings, allowing no more runs and only one hit. The play was absolutely decisive. Had McPherson made the play, Colon would have been out of the inning and a potent Angel offense might have started chipping at the four-run deficit. The turning point in the game was a difficult play that was not made, and the sportswriter covering the game dedicated more than half his column to McPherson’s unmade play. The make-ability of the play was also not lost on Mike Scioscia, who commented: “If [McPherson] stays aggressive, I think he makes that play. It wasn’t routine, but there might have been a little indecision that prevented Dallas from getting to the ball cleanly.”1 Despite the fact that Scioscia, the sportswriter, and everyone watching the game could tell it was the defensive play not made that turned the ball game, that event appeared nowhere in the box score. Colon was charged with seven runs despite the fact that at least three of them could have been prevented had McPherson caught the chopper. The scorer was not at fault because the ruling was perfectly consistent with the rulebook definition of a hit. What was missing was a statistical category to describe the play.
The McPherson play highlights a general problem with defensive statistics. The statistics that are in common use—chances, putouts, and errors—are so general that they tell us almost nothing about the value of defense, nor do they separate the better players and teams from the worse ones. The statistics that do have useful information are obtained through a system of such awkward analytical yoga that usually only we sabermetricians even try to comprehend them. The most basic information—how many hits were robbed by a fielder and how many tough balls they let go by—isn’t collected.
The gap in usefulness between fielding statistics and those for hitting and pitching is so large that I believe that by collecting a few pieces of information about defense, we could massively alter our understanding of defense and its value. This knowledge, in turn, would change how we understand and evaluate pitching and hitting. This article is a call for better baseball defense research in three parts. First, it will review existing measures of defensive performance. Second, it will outline the scheme for recording two new statistics. Third, it will explore possible calculations than can be made on these new data and present some results I’ve collected. In the main, it will argue for the addition of two new defensive statistics that I believe have the most potential to rapidly increase the appreciation of defense.
THE STATE OF CURRENT DEFENSIVE STATISTICS
As James Click sagely noted: “Statistics are only valuable if they are consistent and accurately reflect the action on the field.”2 A review reveals that our current measures of defense fall short of the mark. Tom Tippett has cut to the heart of the matter by identifying that the shortcomings come down to two basic issues: (1) we don’t have a good count of the number of chances, and (2) we don’t know whether the chances were routine, normal, or challenging.3 To briefly elaborate on point (1), “chances” are measured by assists plus putouts plus errors. They do not include balls that are ruled hits even though many of those “hits” presented fielders with “chances” to produce outs. What is not captured is the number of balls that get past Derek Jeter that Ozzie Smith would have turned into outs. As a result of these shortcomings there is a consensus that measures such as fielding percentage are of very little use in evaluating defensive performance.
The reaction by the baseball experts, by and large, has been to try to compensate for factor (1) with increasingly elaborate analyses, while efforts at correcting factor (2) by collecting information on the difficulty of the play have been lagging. The advanced statistics can be quite useful but are complex to calculate, difficult to understand, and often hard even to find. A related issue is the accessibility of the more sophisticated statistics, both in terms of ease of understanding and in ease of finding them. Although complexity is not a problem with a statistic per se, and the lack of wide publication is certainly not a knock against any author, there is much to learn from the principle of Occam’s Razor (loosely paraphrased, “The simplest solution is usually the best one”). To state the point quickly, useful but complex statistics do not replace the need for intuitive and parsimonious ones. Complicated figures that are hard to understand and difficult to get your hands on are unlikely to enter the popular baseball vernacular and change the thinking of casual fans, cutting-edge analysts, managers, announcers, and players.
Existing defensive measures follow two basic approaches, one which estimates range based on putout and assist data, and one which measures range more directly by dividing the field into zones.
In the first category, the Range Factor was an early attempt to deal with the problem of a slow fielder committing fewer errors than a better defender who got to more balls and hence had more chances to drop them. Essentially, the formula divided chances by games. The statistic was obviously limited by using games rather than defensive innings as the denominator4 and failed to account for other factors. Adjusted Range Factors were Tom Tippett’s solution and corrected many of these shortcomings by counting the balls in play at the position while the player was on the field, removing chances insignificant to defensive range (like taking a throw at first), tracking the hitting side of the batter, and adjusting for the ground-ball percentage of a pitching staff.5 It should be further noted that the information is proprietary, difficult to access, and complex to compute. For example, when Tippett was explaining what the formula revealed about Jose Vidro, he had to comment “we can’t finish our assessment of his play without using more advanced methods,”6 and presumably only Tippett has the complete formula.
More advanced efforts that extend the same basic logic include John Thorn and Pete Palmer’s Fielding Runs and Bill James’ Fielding Runs and Defensive Win Shares. Each have sparked their own disputes (Fielding Run formulas have been in dispute7 and compared unfavorably to Defensive Wins;8 both Defensive Wins and Win Shares have been criticized for their complexity9, 10 and Win Shares in particular have sparked much debate11, 12, 13, 14, 15, 16). The advanced systems improve over the Range Factors, but, as Tippett notes, they still make “educated guesses at how many opportunities each fielder had to make plays. It goes without saying that it’s possible to do better when we have access to play-by-play data that records the location of every batted ball.”17
To correct for the basic problem of guessing how many balls landed near a fielder based on the number of chances, a second approach has incorporated the use of “zones.” Independent, non-official scorers mark the area of the field on which each ball lands; Stats, Inc. uses 22 zones.18 The Zone Rating simply divides the outs by the number of balls hit into a fielder’s zone. As early as 1994, Milt Pappas was already declaring it an “inadequate measure of fielding aptitude”19 and that it needed to be adjusted for the average performance by a major leaguer and the “Adjusted Run Value (ARV).” The ARV, in turn, is the likelihood that an unfielded ball will produce a run, the figures for which were taken from Pete Palmer’s statistical glossary in Total Baseball.
David Pinto noticed two problems with the Stats, Inc. Zone Ratings, namely, that they treat all balls hit in the zone equally, and that how far a ball travels (and hence which zone it ends up in) depends on whether a fielder stops it.20 Pinto responded with a probabilistic model for Adjusted Zone Ratings that accounted for the zone into which the ball was hit, how hard it was hit, and whether it was a grounder, line drive, or fly ball. Pinto then calculated the average number of outs for a ball of a given type (say, a grounder to third base) and assessed whether a given team or player produced more or fewer outs than average. Pinto’s ratings have never been fully published, involve a number of complex calculations, and it is unclear how many additional adjustments (for ballpark effects, pitcher handedness, etc.) are required or are being added. Pinto at some point hints that adjustments are coming and at others favorably compares his system to Ultimate Zone Ratings because they do not require complex adjustments.
The Ultimate Zone Ratings (UZR) by Mitchel Lichtman21 are the state of the art in complex fielding analysis based on zones. The analysis is dizzying: Fielding zones are divided into sub-zones for a total of 78 possible areas and weight a player’s performance against the league average and for the probability of a run produced by defensive failure as suggested by Pappas. In addition, UZRs incorporate up-to-date empirical weightings for the run value of a hit in a given zone based on data from the current season rather than relying on the Total Baseball formula. The resulting ratings are then adjusted for ballpark factors, runner/out combinations, handedness of the batter, ground ball-to-fly ball ratios of pitchers, and the speed of the batted ball. It almost goes without saying that the UZRs are very complex and not well published.
A limitation of extant zone schemes is that they do not account for the original positioning of a player. A third baseman hugging the line in a late-inning situation will have an easier time with a grounder hit over third than a fielder playing even with the infield grass expecting a bunt and fielding the same ball. Or imagine Barry Bonds coming to bat, the defense shifting, and the third baseman fielding a routine ground ball just to the third-base side of the second-base bag from where the shortstop would usually stand. In the zone system this would appear to be an incredible feat; compared to the league average, a third baseman making a play in the shortstop zone around secondbase would appear to be the fastest defensive player in history. In reality, the play would be much easier than fielding a screaming grounder inside the third-base bag from a standard third-base position.
Whether or not good positioning should be counted as part of good defensive performance is a point that has been debated by baseball statisticians. The UZRs, and the progeny of Zone Rating measures in general, quietly assume positioning doesn’t matter so long as the out is recorded. This is not a fault with a UZR approach in general, but it does demonstrate that like their chance-based predecessors, the UZRs are an attempt to estimate the number of difficult plays a defender makes rather than measure them directly. Once again Tippett has hit the mark: an estimate will never be as useful (and can quickly become less intuitive) than a direct measure.
This discussion centralizes to two central points. First, current fielding research tends toward advanced schemes that due to their complexity will have a hard time capturing the common baseball imagination. It is worth asking, and several have already asked, whether the gain in understanding is worth the explosion of complexity. Second, all of these advanced systems for analyzing data would benefit greatly from the collection of good data in the first place.
Perhaps due to these patterns, there is a vast confusion about the importance of defense. I can still remember Joe Garagiola Sr. chortling every Saturday during the Game of the Week, “Shake a tree and ten gloves will fall out of it. Give me a guy who can hit!” Some analyses support the Garagiola opinion and hold that defense makes no difference at all.22 Others place a greater but still limited value on defense, such as Jarvis’s work that estimates that 10% of all runs, and not just unearned runs, can be accounted for by errors.23 At the other extreme, Voros McCracken’s recent work has done much to show that once a ball is put in play, the quality of fielders dominates the outcome and the value of the pitcher all but evaporates.24 Similarly, Dick Cramer claims that fielding is far more important than pitching and has produced
four studies to prove it.25 Sitting squarely in the middle are two analyses that have tested McCracken’s proposition and concluded that pitching does matter, but less than is popularly supposed.26 To beat a dead horse, much of this confusion can be traced back to the lack of good data on the difficulty of the play (Tippett’s second limitation of current statistics), resulting in the need to estimate rather than directly measure how many hits a good defender is taking away. Cramer, for example, used a “Hits Prevented” measure, but had to estimate the figure based on league data and could only compute it for teams, not individuals.
TWO NEW STATISTICS
The preliminaries. A solution to complexity, of course, is to start with something simple: Collect data on the number of defensive plays that rob hits. The hit-saving play is already widely recognized. It shows up on the ESPN Top 10 Plays each night and in the “web gem” sequence. It is recognized every time an announcer screams, “call the FBI, Brooks Robinson robbed another hit!” It is recognized by GMs and managers who build contenders with good defense up the middle. It is simply not counted in official statistics.
The counterpart to the hit-saving play, the difficult play that is not an error but is possible to make, is also recognized by baseball people. Consider this Los Angeles Times account of a Dodger game: “Speedy Willy Taveras hit a chopper that Choi bobbled before tossing to Brazoban, who didn’t get to the bag in time. It was ruled a hit, although Tracy said the out could have been recorded had Choi fielded the ball cleanly.”27 Scioscia recognized the same feature of McPherson’s play; it was correctly ruled a hit but was a play that was possible to make.
It is time to make our statistical sheets match what baseball people already recognize. The job of good statisticians is to create quantitative categories that match the action on the field, as Click has suggested, and to create a set of rules that allows scorers to put that field action into the correct categories.
Before offering my solution, I should discuss why the current measures don’t capture the concept and how positioning should fit into the assessment of defensive play.
To begin with, why don’t the current Stats, Inc. measurements account for the difficulty of play? They include both the type of hit (grounder, line drive, or fly) and how hard it was hit (soft, medium, or hard); why isn’t that enough information? First, as Pinto has pointed out, the zone that the ball lands in depends on whether or not a fielder has caught it. A line drive snagged by an infielder gets counted in the infield zone, while the same ball a less adept (or simply shorter) fielder didn’t get to that hits the gap is considered an outfield hit. Second, not all hard-hit balls are difficult. A hard-hit line drive that goes right to a third baseman is a much easier play than, say, a swinging-bunt grounder with a fast runner. Third, not all balls hit right at a defender (and hence within their zone) are equally difficult; some are screaming one-hop line drives, some are dribblers you have to bare-hand to have any chance on, and some are routine three-hoppers.
How should positioning be considered? Tippett has taken other systems to task for giving undue credit to players with soft hands who cover no ground; zone ratings, in contrast, assume that if you can produce the out, you should get credit and that good positioning is part of good defense. In my view, the debate may conflate what are separate issues. There are two ways to get a hitter out. You can either position yourself so that he’ll hit the ball at you, or you can make a great play from a more distant starting position. A poorly positioned player who can make a play despite his positioning is still more valuable than a poorly positioned player who cannot make the same play on the same ball. Ideally, of course, you’d want a player to be properly positioned and also be able to make plays at the edge of his range. It is equally obvious to state that no matter how well a player is positioned overall, there will be some balls hit just outside of his range. What we need are measures that can count how many times a defender can convert a ball hit right at him to an out, and others to count how well a player handles balls hit just to the edge of his range. The entire positioning-versus-range-versus-hands debate is simply a function of the failure of current measures to assess each skill separately.
The new categories. The additions proposed here divide all balls in play into two categories: Those that produce outs and those that result in a batter reaching base safely. Presently, all outs are treated equally; the proposed system would divide outs into those that are routine and those that had they not been fielded would have been ruled a hit rather than an error. The latter are “Hit Saving Plays” (HSP). Balls that result in hitters reaching base safely are currently counted as either hits or errors. The proposed system would further divide hits into “clean hits” (those which presented no opportunity for a defender to make a play) and “Diffficult Plays Not Made” (DNM); balls that required greater than “ordinary effort” (to use the language of the current rule) but that presented the defender with an opportunity to produce an out. Generally, a DNM requires that a defender leave his feet in a dive or a lunge and either touches the ball or have it pass through their wingspan. Balls outside a player’s range (wingspan) are clean hits. DNMs do not replace the category of “hits,” but some hits will be ruled DNMs. Similarly, HSPs do not replace the category of “outs,” but some outs may be scored as HSPs. HSP and DNM designations are only made on the initial stop of a ball in play and are not given to subsequent catches or throws. (Full details of the scoring system, the complete dataset presented below, and proposed wording changes to the rulebook are available at https://commfaculty.fullerton.edu/jbruschke/baseball.htm).
There are many ready advantages to this proposed system. Most fundamentally, it will allow comparisons of how often a player produces outs on difficult plays. Instead of estimating the number of difficult chances with a series of adjustments, the number of opportunities for making a difficult play is simply counted. Dividing the number of hit-saving plays by the total number of difficult plays (HSP+DNM) will give a percentage measure of how often a player can turn a difficult play into an out. Separately assessing routine and difficult plays will also allow a way to identify the players who are able to make difficult plays but often botch routine ones, the vexing case that constantly frustrates current defensive measurement.
The system makes it possible to identify what portion of a hitting or pitching feat can be accounted for by defense. It can identify hard-luck batters who hit the ball the hard but have their hits robbed by good defense. It can identify good-luck batters as those who benefit from defense that can’t turn difficult plays into outs. Pitchers saved by good defensive plays can be identified, as can pitchers who don’t enjoy the defense turning good plays behind them.
Finally and importantly, the hit-saving-play can be easily integrated into both the popular understanding of the game and advanced statistics. Announcers and fans can grasp and appreciate phrases like “he’s taken away more hits than any other shortstop in the league this year,” or “he turns a higher percentage of tough plays into outs than any other second baseman.” Advanced sabermetricians can use the new data for their powerful analyses and recalculate ERAs and batting averages based on the number of difficult plays turned to outs over league averages. Instead of estimating the number of runs a play might save with an aggregate number, calculations could simply count the number of times a defensive play saved a hit with, for example, a runner in scoring position. Instead of tortuous calculations to figure out how many Fielding Runs a shortstop is worth, you can simply count the number of runs he saved by taking away what otherwise would have been ruled hits with runners in scoring position.
A concluding point is that it is important to measure range and catching ability separately. Simply put, a good defender needs both good speed and good hands. There’s no point in being able to catch well if you can’t get to the ball you’re supposed to catch, and no point in getting to the ball if you can’t catch it. The best fielders do both well, the worst fielders do neither well, and those good at one but not the other fall in the middle. So long as we have good ways to assess each capability separately, there’s no reason to assume that one is more important than the other. Instead, we should collect separate information on each skill.
The system presented above is not intended as a measure of range, but instead is a measure of how well a player handles difficult chances within their range. In other words, some players will have more range than others, but within each player’s range—however wide or narrow it might be—that player will encounter balls that will be more difficult to handle due to bad hops, how hard they are hit, and how close to the edge of a player’s range they are. The HSP/DNM scheme is designed to measure how often a player can convert difficult chances into outs.
HOW DO YOU KNOW ONE WHEN YOU SEE ONE?
Isn’t the notion of a “difficult play” too subjective? Don’t good defenders make difficult plays look easy, and aren’t there bad defenders who make easy plays look hard? Aren’t there some guys who dive after every ball, including those that they have no chance of reaching? These are valid questions, and there are good answers to them. Repeating the mantra “It’s still better than just counting errors” will cut to the core of most of it.
It is a fact that human judgment is already coded into the definition of an error, which requires the scorer to assess “ordinary effort” (rule 10.13 note 2 and 10.14.b), “slow handling of the ball,” (rule 10.13 note 1), what is a “good throw” (rule 10.13.d.1 and 10.14.b), or an “occasion for the throw” (rule 10.13.e). Note that for the HSP, the scorer would ask themselves “Had he not made that play, would I have called it a hit?” This exerts no more subjective judgment than the existing error (and hit) rulings. To score a DNM, the scorer would first have ruled a hit rather than an error, and would then simply ask, “Although that was not an error, was it possible for an outstanding defender to convert the ball to an out?” This decision, while somewhat subjective, is not a reach far beyond the current “ordinary effort” judgment about a hit or error. As will be demonstrated below, it can be made reliably.
What about the defender who can make a tough play look easy, or through good positioning and anticipation get squarely in front of more balls than other players? Consider four things. First, if it is possible to know that there are players who make difficult plays look easy, that is presumably because it is possible to know what a difficult play is in the first place. If so, it should be possible to put on paper what features of the play made it difficult, and those elements could simply be added to this system to make it more reliable. Second, at present, all these players have to show for their effort is a higher error total if they get to more balls than other players but miss them at the same rate. The proposed system would at least allow them to show hit-saving plays as an offset. Third, the HSP/DMN categories are not designed to measure range, and presumably these players would be highly ranked on other measures of range. Again, if range and catching ability are measured separately, we can identify players with good range, those with good hands, those with both, and those with neither. Fourth, even in the HSP/DNM system, a player who showed the same number of outs in a zone with fewer HSPs could at least make the claim that they were doing a better job of being where the ball was and hence diving around less. In other words, this system could quantify the existence of the player with good anticipation, something only supposed at present.
What about players who make easy plays look difficult? I should say that I am not at all convinced that there are such players, at least not at the major league level. The level of competition is such that if you are doing things that make your routine tasks more difficult, it is unlikely that you’ll stick around for long. But, once again, the HSP/DNM scheme would be no worse than simply counting errors, since the players making easy plays look tough should be fooling scorers into handing them fewer errors by virtue of making routine plays appear to require greater than “ordinary effort.” And the system would perfectly identify players who dive after balls they have no chance at; they would have a huge number of DNM plays and very few HSP plays. It is also worth noting that another type of player— the one who makes spectacular plays but also blows a large number of routine ones—is invisible with current statistics but easily revealed if HSPs and DNMs are counted.
A final point, and perhaps the most important one, is that simply because judgments are subjective does not mean that they cannot be made reliably. When to remove a pitcher, for example, is a subjective decision, but good managers make the decision better and more reliably than bad ones do. Other decisions, like whether someone is attractive or whether a food tastes good, are also subjective but made all the time and with a high degree of reliability. In fact, almost all social science textbooks discussing quantitative research methods have chapters on how to measure whether a subjective judgment is made reliably. For example, my area of professional expertise is pretrial publicity, and we often need to determine whether a news story is pro-defense, pro-prosecution, or neutral.
The procedure generally involves writing down a set of coding rules, training coders (or “scorers”) to use the system, having several of them independently code the same thing (such as a news story), and counting how often the coders put the same item in the same category. There are three criteria typically used to assess reliability: (a) whether coders agree more often than chance levels, called “statistical significance,” (b) the raw percentages of agreement, and (c) the score on a statistic called Cohen’s Kappa, where scores range between -1 and +1 and scores of .41-.60 are “moderate,” .61-.80 are “substantial,” and scores of .81-1.00 are “almost perfect.”28
To measure the reliability of this system, I gave the coding rules discussed above to a group of people with a general knowledge of baseball who knew how to score a game but were not professional scorers. These coders watched a random selection of games during the 2005 season, either by watching a nationally televised game in different cities and sending me their codes or by watching the same game in person. If they watched the same game in person, efforts were made to ensure that each coder scored the play independently without consulting other coders. To avoid missing data, often more than two coders were assigned to score the same game. When more than two sets of scores were available for one game, two sets of codes were randomly selected and the others were discarded to avoid weighting some games more heavily than others. Some games were recorded and went into extra innings and thus, in a very few cases, the coders who taped the game did not have all extra innings available to watch. When this occurred, only data for the first nine innings were included. Small alterations to the coding rules were made during the life of the project; this, of course, tends to depress agreement rates since games scored early on had slightly lower reliability than those scored later.
Overall, 501 plays were coded and the agreement rate was 95.8%, that is, the two coders assigned the same code to the same play 480 times out of 501. The odds of this occurring by random chance were less than one in a thousand, making the pattern statistically significant. The overall Kappa score was .92, well within the “almost perfect” range. Considering only the base hits, 115 times the coders agreed the play was a clean hit, 27 times they agreed on a DNM code, and 5 times they disagreed. Considering only base hits and only the plays where at least one coder assigned a DNM code to the play, the agreement rate was 84.4% (27 of 32) with a Kappa of .89. Considering only outs, 304 times coders agreed the play was a routine out, 34 times they agreed on an HSP code, and there were 16 disagreements. Considering only the outs and only the plays where at least one coder scored the play an HSP, there were 34 agreements in 50 plays for an agreement rate of 68% and a Kappa score of .78.
These data show a reliable coding system on all three criteria with high agreement percentages, statistical significance, and high Kappa scores. Anecdotally, it is worth noting that of the 165 plays scored by four coders (two of which were discarded in the analysis reported above), all four coders agreed 94.5% of the time, three of four coders agreed 3.6% of the time, and there was a two-to-two split only 1.8% of the time. The overall percentage of difficult plays (HSP or DNM) in the reliability dataset was 16.3%, which matched very closely the rate of 17.75% in the final dataset (reported below).
Finally, it bears repeating that knowledgeable baseball people, Mike Scioscia and Jim Tracy among them, already recognize that there are plays that rob hits and plays that are not errors but could be made. If the present set of coding rules does not clearly identify these categories, the best course will be to come up with rules that do define them rather than to continue as if they don’t exist.
SOME DATA
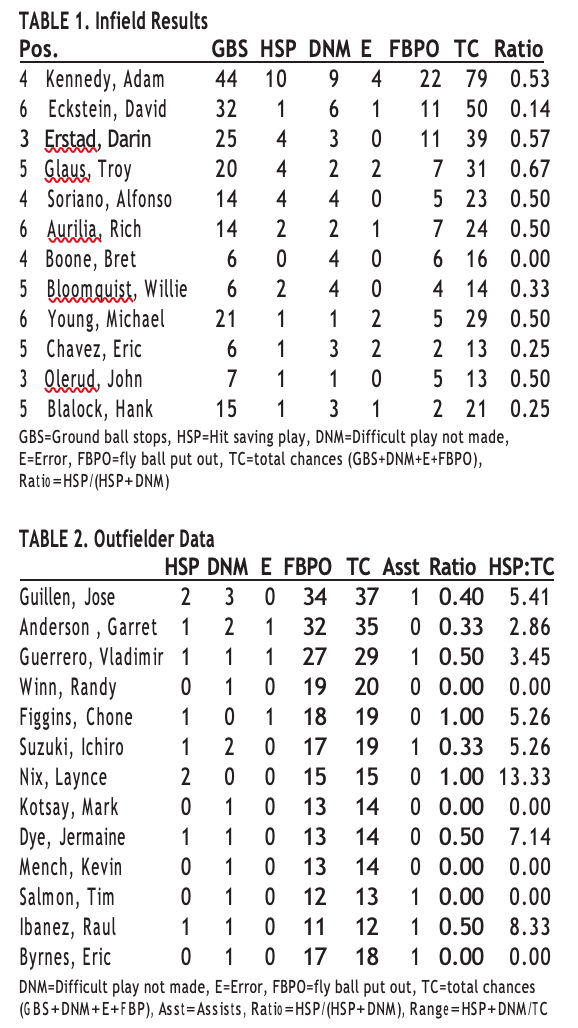
Using the system described above, I scored the first 21 games of the 2004 season for the Anaheim Angels. Table 1 shows the results for all infielders with seven chances or more. “Ground ball stops” include all ground balls the fielder turned into outs and include all HSPs (ground balls not converted to outs are scored either as errors or difficult plays not made). “Total chances” includes all ground-ball stops, difficult plays not made, fly-ball putouts, and errors. It differs from traditional chances in that it includes difficult plays that were not made but does not include assists on double-play balls. As such it represents the number of opportunities to produce an out when fielding a batted ball. Of course, it would be possible to add in assists on double plays, in which case the “chances” figure would represent every chance the fielder had to produce an out or commit an error.
The case of Adam Kennedy is especially telling. Looking only at the traditional error total, he is the worst on the list with 4 errors in 44 grounders and 22 fly balls. David Eckstein made only one error over the same span, and thus viewed through traditional measures, Eckstein was a much more productive defensive player than Kennedy. Using the HSP and DNM figures, however, it is possible to tell that Kennedy also robbed 10 hits during his 79 total chances, more than double that of any other fielder. He is revealed as a player who muffed some routine balls he should have turned into outs but also robbed a number of hits to compensate. In addition, Kennedy’s ratio of DNM to HSP is .53 and the overall ratio on the table is .47 (42 DNMs and 31 HSPs), and thus Kennedy’s mark is better than the average. Eckstein only turned 1 of 7 difficult chances into outs. In short, viewed through traditional statistics Kennedy was a four-fold dropoff from Eckstein on defense, but viewing HSPs and DNMs reveals much that is otherwise unknown about the player’s defensive performances and shows that Kennedy, relative to Eckstein, was a greater defensive asset. Those familiar with Eckstein’s performance in Anaheim will readily agree this is an accurate assessment; Eckstein was a gamer who gave all he had, but he could only rarely turn a borderline chance into an out. Kennedy could dominate a game on defense.
It is also interesting to note that reputed defensive stars Bret Boone and Eric Chavez had poor ratios, although neither had many chances. Remember that these figures only show performance in a few games and not an entire season; showing batting or pitching statistics over the same short span might also produce results that are counter to reputation. What this system does provide is a more objective way to evaluate a player’s performance in a series. While current batting statistics allow conclusions like “He’s a great hitter, but the Angels sure had his number this series,” the proposed system would allow conclusions like “He’s a Gold Glover, but he didn’t do much on defense over the last six games.” In fact, Gold Gloves are given largely on reputation, and perhaps even on the basis of hitting, in part because defensive statistics cannot at present reveal in a generally understood way who had a better defensive season. The scheme proposed here provides a more objective way to evaluate defensive performance over the short or long term.
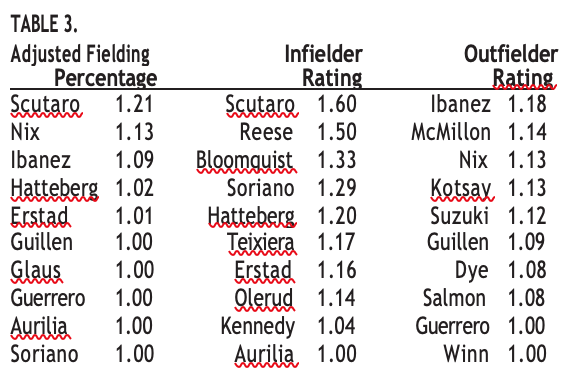
Outfielder data are reported in Table 2. Since outfielders generally do not turn ground balls into outs, chances are fly-ball putouts plus DNM plus errors. Because no outfielder had more than 5 HSP+DNM, the ratios are not especially meaningful, but dividing HSP by TC and multiplying by 100 gives a HSP:TC ratio that represents the number of hits saved by the outfielder over 100 chances. Laynce Nix is the leader by a wide margin; 2 of his 15 chances were instances of stolen hits. Ibanez and Dye had good performances, while defensive superstar Ichiro Suzuki showed his range by getting to 3 difficult balls in 19 chances but was only able to convert 1 of 3 into outs. It goes without saying that this system represents an improvement over fielding percentage; the error totals tell almost nothing about the quality of defensive play and the HSP and DNM figures provide much richer information about what a player did with the balls hit to him. The discussion thus far has focused on simple calculations or at least calculations with easy interpretations (e.g., “Nix robs 13 hits for every 100 balls he can make a play on,” or “6 percent of the balls Byrnes gets to are difficult to field”).
It is possible to make more advanced calculations. An Adjusted Fielding Percentage can be calculated by summing ground-ball stops, assists on ground balls, unassisted putouts, assisted ground-ball putouts, assists on unforced base-running plays, and difficult plays (every opportunity a player has to make an error or fail to make a difficult play), subtracting errors and DNMs, and dividing by the revised total chances, which are obtained by summing ground-ball stops, assisted putouts, unassisted putouts, fly-ball putouts, and assists. The resulting figure represents the net number of good versus bad plays relative to total plays. An exact balance will produce a score of 1.0, more HSPs than errors or DNMs will produce a number above 1.0, and more errors and DNMs than HSPs will produce a number below 1.0.
Similarly, an Infielder Rating can be obtained by dividing groundball stops plus HSPs minus errors by ground-ball stops plus errors. The resulting figure can be interpreted the same way as an Adjusted Fielding Percentage with an emphasis on infielder duties. Finally, an Outfielder Rating interpreted the same way can be obtained by summing assists, difficult plays, and putouts, subtracting errors, and dividing by putouts plus errors. The top 10 players in these categories are listed in Table 3. All calculations could be divided by league averages or incorporate other adjustments. The point is simply to show that the additional data obtained by counting DNMs and HSPs can be integrated into more advanced calculations or used by those who wish to give a single number evaluation of defense.
Another calculation the DNM and HSP data make possible is the ability to track runs and outs to defensive plays. If an inning is reconstructed without DNMs, it is possible to identify “preventable runs,” that is, runs that could have been prevented had the defense converted difficult plays into outs. This is the same method used to calculate unearned runs where the scorer reconstructs the inning without any errors. The hardest-luck pitcher was Rafael Soriano, who averaged 20.25 Preventable Runs per nine innings. Chan Ho Park had the highest figure for pitchers with nine innings or more at 6.17. It is of course possible to calculate an ERA subtracting preventable runs, which would be the ERA a pitcher would have if every defender turned every difficult play into an out.
A “saved run” is a run prevented by above-average defense and occurs when (a) a runner is on third and a HSP occurs, (b) a runner is on second and a HSP occurs with two outs, (c) a batter is retired on an HSP and a subsequent runner scores or advances to third, or (d) a catch prevents a home run, in which case the batter and all runners on base are counted as saved runs. This scheme probably underestimates the number of saved runs, but every saved run counted is a run definitively prevented by a HSP. Rule (a) assumes that a run has been saved by the HSP even if the runner subsequently scores. The logic is that the defender saved the run for the time being and isn’t responsible if subsequent action allows the runner to score.
The greatest beneficiary of good defense was Pedro Martinez, who enjoyed 3.6 saved runs per nine innings. For players with at least nine innings the leader was Ben Weber with 1.5 saved runs per nine innings. It is possible to calculate an ERA adding back in saved runs. Finally, it is possible to calculate an “adjusted ERA” that subtracts from earned run totals Preventable Runs and adds back Saved Runs. In my data sample the most extreme case of a pitcher’s ERA changing (with at least nine innings) was Kenny Rogers, whose ERA of 6.97 adjusted to 1.74. The average change for pitchers in the group was 1.42 runs.
Finally, these new data allow an overall assessment of the value of defense. Of the 1,110 outs in the sample, 6.22% (n=69) were recorded on difficult plays and 24.5% (n=272) were on strikeouts. There were 97 DNMs that resulted in an official scoring of “hit.” Subtracting the strikeouts from the total outs and adding in the 97 balls that defenders made plays on that were scored as hits totals 935 balls put in play that resulted in, or could have resulted in, outs. Of those, 17.75% were above-average difficulty (n=166; 69 HSPs and 97 DNMs). Overall, 87.21% were recorded on routine plays or strikeouts, and the balance were recorded by HSPs, double plays, and base-running outs. In other words, roughly 18% of the time on balls in play, and roughly 13% of the time overall, what makes a difference in the outcome of a play is the defender’s ability to turn a difficult play into an out.
Of the 235 runs in the sample, 59 (25.11%) were preventable and there were 21 saved runs. Adding the saved runs to the total (n=256) and dividing the saved and preventable runs (n=80) by the new total means that 31% of all scoring can be accounted for by defensive performance on non-routine plays. To repeat, 25% of the actual runs scored, and 31% of the runs scored or prevented, can be accounted for by defense on non-routine plays. These figures and those in the prior paragraph represent the amount of the game that is not accounted for at all by simply counting assists, putouts, and errors. Notice how closely these figures are to one divided by three—the third of the game missing from current statistics.
I will emphasize that the data presented above are not intended to validate the proposed scoring system, but instead are designed to demonstrate what sorts of things this system can reveal. I hope the system offers a deeper intuitive understanding of defense for the casual fan and provides the advanced analyst with new data to use. The next step is to collect a much larger set of data over a full season and correlate the new measures with bottom-line statistics such as run totals and wins.
CONCLUSION
This is the first step of a larger project to deepen the scope of defensive statistics. I will not belabor the point that defensive statistics lag behind pitching and hitting measures (much), but I will say that counting all putouts as equal is roughly like grouping all singles, doubles, triples, and home runs under the generic category of “hits.” I believe that the swiftest advance in understanding defense can be had by adding the HSP and DNM categories, but there is much more that can be done and there are limitations to this scheme that I hope future efforts can address. One is to incorporate arm strength into the scheme; another is to refine the ways that a “difficult play” is defined; still another is to unify measures of range, hands, and arm strength. The entire project is detailed on the website cited earlier.
I believe that this first step has been a fruitful one. As the case of Adam Kennedy demonstrates, knowing how many hits a player saved can radically change assessments of their defensive value. Knowing how many hits are saved in a given amount of time (like every 100 balls fielded) gives important new information about outfielders. Counting preventable and saved runs, in addition to those earned and unearned, opens new possibilities for knowing how games are won and lost. The portion of runs accounted for by defense in this preliminary analysis (roughly a third) hints that broader analyses will be quite illuminating. Adjusting batting averages and ERAs for preventable and saved runs offers the potential to assess how much of those performances can be accounted for by defensive play.
In summary, I think this system offers improvements in three areas. (1) It is more intuitive and usually less complex than what we have now. The value of any measure is the way it balances information content against complexity; the best measures contain a lot of information and are easy to understand. As of this writing, there is a gaping hole between error counts and UZRs. It is my belief that the measures suggested here contain a lot of information without getting too complicated. (2) The subjectivity of the measures presented here has been evaluated, and using appropriate professional standards it has been shown that the measures can be reliably applied by different coders to reach the same decisions. Few other approaches have presented similar results. (3) The measures suggested here tend to be direct assessments and, in Click’s words, to “reflect the action on the field” by direct observation rather than estimation.
But improvements are rarely conclusive, and other schemes have their own strengths not captured here. Hopefully, a collective overhaul of how defense is measured will soon produce significant advances in how we think about this crucial but largely un-measured part of the game.
Acknowledgments
Thanks to Leo Leckie, Rick Wynne, Shawn and Kristina Whalen, Rich Sutton, Mike Hall, Glenn Frappier, Brian DeLong, and Greg Acthen for their help scoring games and gathering reliability data, and to Freddi-Jo Eisenberg Bruschke for her help editing the manuscript.
Notes
- Los Angeles Times, July 8, 2005, D9.
- Click, Baseball Prospectus Basics: Measuring Defense, www.baseballprospectus.com/article.php?articleid=2620, March 2004.
- Tippett, Tom, Evaluating Defense, www.diamond-mind.com/articles/field99.htm, October 12, 2001.
- Ibid, October 12, 2001.
- Ibid, October 12, 2001.
- Ibid, December 5, 2002.
- Ibid, December 5, 2002.
- Rankin, T.. “In defense of Horace Clark: A comparison of two defensive measures,” By the Numbers, vol. 10, no. 4, November 2000, 7-12.
- Ibid.
- Allen, Robert T, “’Win Shares’ has meat on its bones,” By the Numbers, vol. 12, no. 3, August 2002, 1-2.
- Baseball Graphs.
- Gartman, “Rating the top baseball players of all time: The extrapolation method,” http://baseballguru.com/egartman/analysis- ericgartman01.html, updated through the 2003 season.
- Tango, “Explaining Bill James’ win shares,” www.tangotiger.net/winshares.htm, downloaded July 17, 2004.
- Tango, Tom (“TangoTiger”). “Win shares and losses,” tangotiger.net/winsloss.html, downloaded July 17, 2004.
- “New problem with win shares,” Netshrine discussion board, netshrine.com/vbulletin2/archive/index.php/t-12005.html, October 13, 2003.
- Baseball graph, baseballgraphs.com/details.html, downloaded July 17, 2004.
- Tippett, Evaluating Defense, www.diamond-mind.com/articles/defeval.htm, December 5, 2002.
- Dial, “What is zone rating?,” bigbadbaseball.com and www.eeeeeegp.com/Notes00/Jan00Notes2.html, January 29, 2000.
- Pappas, D, “Defensive Runs: A better fielding statistic,” By the Numbers, vol. 6, no. 3, September 1994, 2-3.
- Pinto, David, “A probabilistic model of range,” baseballmusings.com/archives/004765.php, September 19, 2003. “More on probability and range,” www.baseballmusings.com/archives/004776.php, September 22, 2003. “Probabilistic model of range, continued,” www.baseballmusings.com/archives/005622.php, November 2, 2003.
- Lichtman, Mitchel, “Ultimate Zone Rating (UZR), Part 1,” baseballthinkfactory.org/files/main/article/lichtman_2003-03-14_0, March 14, 2003. “Ultimate Zone Rating (UZR), Part 2,” www.baseballthinkfactory.org/files/main/article/lichtman_2003-03- 21_0/, March 21, 2003.
- High Boskage House Baseball Operations, “Baseball fielding and its implications,” http://highboskage.com/team-defense.shtml, downloaded July 17, 2004, copyright 2000-2005.
- Jarvis, John F, “A survey of baseball player performance evaluation measures,” http://knology.net/~johnfjarvis/runs_survey.html, July 24, 2004.
- McCracken, Voros, “Pitching and defense: How much control do hurlers have?” www.baseballprospectus.com/article.php?articleid=878, January 23, 2001.
- Cramer, Dick, “Preventing base hits: Evidence that fielders are more important than pitchers,” Baseball Research Journal, 31, August 2002, 88-92.
- Woolner, K, “Counterpoint: Pitching and Another look at pitchers preventing hits,” www.baseballprospectus.com/article.php?arti- cleid=883, January 29, 2001. Wright, Craig & James, Bill. “January 2001 Archives,” http://espn.go.com/mlb/s/2001/0115/1017090.html, January 26, 2001.
- Los Angeles Times, July 9, 2005, D6.
- Landis, J. R., & Koch, G. G., (1977a), “The measurement of observer agreement for categorical ” Biometrics, 33, 159-174.