
A Novel Approach for Baseball Pitch Analysis Using a Full-Body Motion Analysis System
This article was written by Paul Canavan
This article was published in Spring 2021 Baseball Research Journal
Contributing authors: Paul K. Canavan, Bethany Suderman, Alex Sklar, and Nicholas Yang
Biomechanical analysis in sports has been used for more than 140 years, including Eadweard Muybridge’s work in 1879. Muybridge created the Zoopraxiscope to analyze motion through photographs and motion pictures (Muybridge E 1882, Muybridge E. 1891, Rondinella L.F. et al.,1929). For the past 50 years, baseball coaches have used biomechanical analysis from movies of the baseball pitch to help improve pitcher performance (Bethel, 1967; Hulen, 1966; Petroff et al., 1966). High speed photography, stroboscopic photography and high-speed video cameras have been used to analyze pitching mechanics for over 40 years (Atwater, 1977; Elliott et. al, 1986; Escamilla et al., 2001; Hang et al., 1979; Pappas et al., 1985, Thurston,1984). High-speed cameras and the use of retroreflective markers worn on the major joints on the body for the baseball pitcher have been used to analyze baseball pitching for over 25 years to the present (Dillman et al., 1993; Escamilla et al., 2002; Escamilla et al., 2017; Fleisig et al., 1999, Solomito et al., 2017).
Over the past 10 years there have been several research studies that have utilized wearable sensors on the arm involving gyroscopes, accelerometers, and/or magnetometers to identify torque and other upper extremity biomechanical parameters related to baseball pitching (Camp et al., 2017; Koda et al, 2010; Makhni et al, 2018; McGinnis et al, 2012; Murray et al, 2017; Sagawa et. al, 2009). Objective testing that truly evaluates baseball ability is welcomed by professional, college, and high school coaches. Pertinent research findings and their practical applications are needed for coaches and players to help improve pitching ability (Reiff et al., 1971).
However, these sensors have only been utilized on the upper extremity and there are limitations to fixation, comfort, and practicality in the field. Coaches and analysts have requested more research advocating improved ease of use, and improved error compensation and analysis procedures to provide informative, concise, and easy-to-interpret metrics (Camomilla et al., 2018).
The XSens wearable full body motion analysis suit has been shown to reliably biomechanically analyze rehabilitation exercises, activities of daily living including walking and stair ambulation, as well as activities such as skiing and snowboarding (Karatsidis et al;, 2019; Konrath et al., 2019; Kruger et al., 2009; Slaipah et al., 2014; Supej et al., 2010). The Xsens inertial measurement suit is an acceptable unit to measure physical demand in workplace assessments such as complex lifting tasks (Poitras et al., 2019).
To date there are no known research papers that have analyzed the baseball pitch using a full body motion analysis suit such as the Xsens for kinematic analysis. This paper has two purposes: First, to present the procedures for a successful application of biomechanical motion analysis of baseball pitching utilizing a wearable sensor body suit. Second, to provide a descriptive analysis of the center-of-mass position of the pitcher’s body as related to the lead foot placement and pitching accuracy.
MATERIALS AND METHODS
Participant
The volunteer participant was a male pitcher (Age 20; Height 1.96 m; Weight 102.1 kg; Throwing Arm; Right) from an NCAA Division III varsity baseball team. The research procedures were reviewed and approved by the Institutional Review Board. The participant was provided an overview of the procedures and provided written informed consent.
PROCEDURES
Set-up
A pitching mound, home plate, pitching target, and batting dummy were set-up in an indoor gymnasium at Eastern Connecticut State University. The distance of the pitching rubber to the back of home plate was placed at the NCAA regulation distance of 60 feet 6 inches (18.44 meters) from each other (Paronto and Woodward, NCAA, 2014). The participant threw from an indoor wooden pitching mound built to regulation height (10 inches/25.4 centimeters) with a gradual slope of 1 inch per foot (0.0254 centimeter per 30.48 centimeters) from a point 15.24 centimeters (6 inches) in front of the pitching rubber (all dimensions based upon NCAA regulations, see Paranto, NCAA).
A target area was designated on the canvas backstop to simulate the strike zone for a 1.75 meter (5-foot 9-inch) tall batter. The pitching target was placed behind home plate and measured 1.52 meters in height by 1.40 meters in width (Muhl Tech Pitching Target, MulTech, Wharton, Texas. See Figure 1).
Figure 1. Example images of pitching accuracy measurements. (Left) Example of a strike while throwing at the Lower Left Quadrant (LLQ). (Right) Example of a ball while throwing at the Right Upper Quadrant (RUQ). The baseball is outlined in for emphasis. Computer generated grid squares are 2″ x 2″.
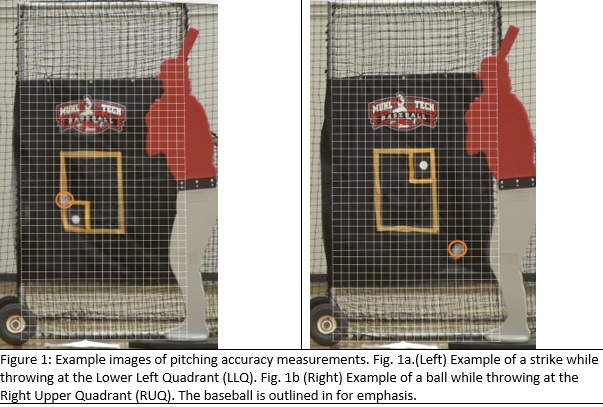
A level and tape measures were utilized to ensure proper placement of the pitching target. The Designated Hitter Pro Model dummy (TAC Companies LLC, National Harbor, MD) was used to provide a more realistic pitching environment. The target area was subdivided into four equal quadrants of the strike zone. The quadrants were designated as Left Upper Quadrant (LUQ), Left Lower Quadrant (LLQ), Right Upper Quadrant (RUQ), and Right Lower Quadrant (RLQ). The pitching target area was 40.64 centimeters (16 inches) tall by 55.88 centimeters wide (22 inches) and each isolated quadrant area was 20.32 centimeters tall (8 inches) by 27.94 centimeters wide (11 inches). A 3-inch diameter circular white target was placed in the center of each quadrant, LUQ, LLQ, RUQ, RLQ. During the trials, only one of the quadrants was visible to the subject. The goal of the participant was to hit the center of the target in each quadrant.
Motion Analysis
The kinematic analysis of the body and center of mass of the subject was measured using an instrumented body suit (MVN Biomechanical Body Suit, Xsens Technologies, Enschede, Netherlands) containing 17 inertial measurement units. The sensors along with the measurements of the various limb segments created the 3-D body model.
The subject wore the Lycra body suit, with pockets allowing placement of the motion tracking sensors in the correct position on the subject’s body and to hold the data logger and battery pack. A headband, gloves, and foot pads were used to secure the motion trackers to the subject’s extremities. The gloves did not affect the ability of the subject to pitch normally. The sensor goes on the back side of the hand, not the palm or the fingers. According to feedback from the participants, the sensor did not affect the performance of throwing. The data from each sensor were recorded at 120 Hz and processed using the Xsens MVN Studio-Pro software package.
After the suit was put on, and the sensors, battery pack, and data logger secured in position, measurements were taken of the body height, shoe length, arm span, ankle height, hip height, hip width, knee height, shoulder width, shoulder height, and shoe sole height. These anthropometric measurements were taken as per XSens standardized protocol. A single-unit battery pack contains 3 Lithium Ion rechargeable cells, and when fully charged, the suit can be operational for continuous recording Z for up to 10 hours. The weight of the battery was 20.74 ounces or 1.3 lbs and placed on the posterior mid-thoracic region of the participant which had very minimal effect on the participant’s center of I gravity and throwing mechanics.
Prior to event recording, a complete and successful calibration phase was performed, following the Xsens calibration procedure. Connection between the recording laptop and Xsens hardware was done with the standard Bluetooth receivers provided with the Xsens system. Real time monitoring of the motion capture was also performed.
The biomechanical model consisted of 23 segments from the 17 sensors which created the accurate 3-D model for each individual participant. The sensors were translated to body segment kinematics using a biomechanical model which assumes the subject’s body includes body segments lined by joints. The Xsens system calculates the position, velocity, acceleration, orientation, angular velocity, and angular acceleration of each body segment and the center of gravity (COG). For each test trial, real-time standard video capture was also recorded at 29.97 frames per second at a resolution of 1920 x 1080 (Canon, EOS 7, Japan) and placement of cards that indicated quadrant and pitch number were utilized for both the high-speed camera and the standard video camera.
A midline was defined as the center of the pitching rubber to the center of home plate. MATLAB software was used to better visualize the location of the lateral distance of the center of mass related to the lead foot placement and midline.
Speed and Accuracy Measurements
A standardized and recently calibrated Stalker Sport 2 radar gun (Applied Concepts, Inc./Stalker Radar, Richardson, Texas) was used to assess pitch speed. The radar gun was placed 2.44 meters behind and 10 degrees to the right of the participant.
A high-speed camera (240 frames/sec) at a resolution of 1920 x 1080 (Sony, NEX SF700, Japan) was utilized to assess accuracy, and the x-, y-position of the ball was analyzed for each pitch relative to the center of the target and the resultant distance was calculated. The high-speed camera was placed orthogonal to the strike zone target and recorded the location of the ball when it hit the target. The camera was placed behind (1.54 meters) and 10 degrees to the left of the pitching subject. Still images of the moment of impact between the baseball and the strike zone target were taken from the high-speed camera and imported into a computer program (Adobe Illustrator, Version 23.0.3, Adobe, San Jose, California) where a 2-inch grid was placed over the strike zone target area (See Figure 1).
The grid was placed over the target area and verified by comparing the grid to physical measurements taken of the strike zone target area. Only the three most accurate and least accurate pitches were analyzed. Accuracy was determined as the resultant distance to the designated quadrant in the strike zone.
Pitching Protocol
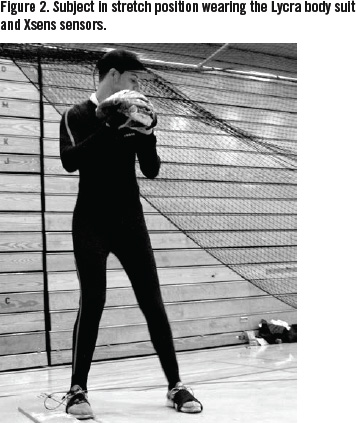
Prior to data collection, the subject completed a 15-minute standardized warm-up throwing procedure that he typically performed before throwing off a mound. Prior to data capture, the participant pitcher threw 3 warm-up fast balls from the indoor mound into target number 1 right upper quadrant (RUQ). The participant then threw 10 times with the goal to hit the target in the center of the quadrant. The instructions were given for the participant to throw as fast and as accurately as he could perform with emphasis on accuracy. This was followed by the same procedure for each of the other three quadrants: Left Upper Quadrant (LUQ), Left Lower Quadrant (LLQ) and Right Lower Quadrant (RLQ). All pitches were performed from the stretch position to standardize the position of the body for each trial, as shown in Figure 2.
Figure 2. Subject in stretch position wearing the Lycra body suit and Xsens sensors.
The subject performed at least 40 pitches into the canvas backstop target, 10 pitches for each of the 4 quadrants. For each test trial, the subject was instructed to throw consecutively at one of the four defined quadrants. Pitches that completely missed the canvas backstop or hit the dummy batter did not count toward the 40-pitch total.
In addition to starting all throws from the stretch position, the participant aligned the middle of his shoe with a mark on the middle of the pitching rubber, which was itself aligned with the middle of home plate, in order to standardize the start position of each throw. The particular quadrant target circle was only visible for each of the conditions. The participant was allowed to rest as needed between pitches. The time between pitches for each quadrant was less than 60 seconds.
Results
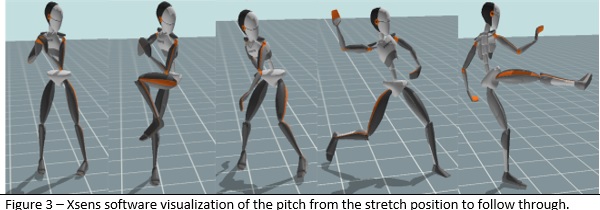
The pitching mechanics were analyzed with visual observation, use of standard video, as well as the Xsens MVN Studio-Pro software package, as shown in Figure 3.
Figure 3. Xsens software visualization of the pitch from the stretch position to follow through.
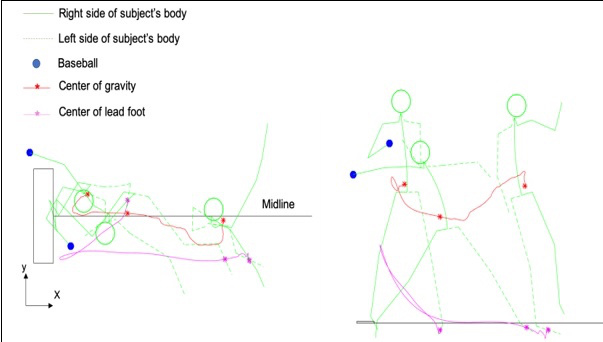
Figure 4. Top view and side view of the center of gravity and fore foot position at the initial stretch position, front foot strike, and follow through.
(Click image to enlarge)
MATLAB was utilized to observe the trace of the center of gravity during the pitching sequence (Figure 4).
Figure 4 shows top view and side view of the center of gravity and fore foot position at the initial stretch position, front foot strike, and follow through. Following ball release for each pitch, the subject’s body fell towards his left side and the back, right foot came across and landed to his left side in order to maintain balance of having the center of gravity (COG) within the base of support of both feet.
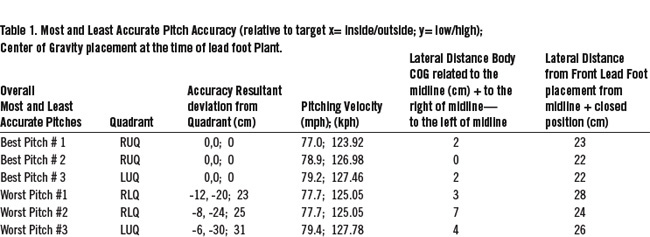
The lateral distance of the center of gravity with respect to the midline and front foot at foot strike was obtained by plotting the position at foot strike, as shown in Figure 4. Table 1 shows for the three most accurate and three least accurate pitches, the pitching velocity, the lateral distance of the center of gravity to the midline, and the lateral distance of the center of gravity to the lead foot.
(Click image to enlarge)
The participant reported that he threw 90% of his full speed for each of his pitches. The participant’s least accurate pitches were low and to the outside relative to the center of the target of the respective quadrant. The combined amount of distance from the center of mass relative to the midline along with the position of the lead foot relative to the midline was 20, 22, and 25 centimeters for the most accurate pitches (Figure 4). The combined amount for the least accurate pitches were 30, 31, and 31 centimeters. The average pitching speed for the most accurate three pitches was 78.37 mph/126.12 kph. The average pitching speed for the least accurate three pitches was 78.27 mph/125.96 kph. The speeds were similar. Two of the most accurate pitches were in the right upper quadrant and two of the least accurate pitches were located in the right lower quadrant.
LIMITATIONS AND BENEFITS OF THE MOTION ANALYSIS SYSTEM SUIT AND HIGH-SPEED CAMERA
- Limitations. Battery life on the high-speed motion camera, sampling frequency low compared to shoulder velocity, time of data processing, place and complexity of data processing (Kosa et al., 2018)
- Benefits: Portability—the motion analysis suit and the high-speed camera can be utilized indoors or outdoors at a pitcher’s own team facility and mounds, ease of analysis—visualization of image following performance of the pitch, and convenience of set-up—the time for set-up for the pitcher may be lower than traditional motion analysis with retroreflective markers.
DISCUSSION
Many studies have investigated factors that could improve pitching accuracy and performance. A recent study (Fleisig, et al., 2017) showed that utilizing biomechanical motion analysis to identify flaws of the pitching motion, followed by instruction and a followup biomechanical analysis, was able to correct 44% of the flaws identified in 46 healthy baseball pitchers from high school, college, minor league, and major league levels. Studies analyzing the foot position on the pitching rubber and variable stride length did not necessarily correct pitching accuracy (Edwards et al, 1963). There also appears to be no significant relationship between shoulder proprioception and throwing accuracy (Freeston et al, 2015). To the authors’ knowledge, there has been little research on the lead foot position and pitching accuracy.
There is a dearth of literature on mechanics and pitching accuracy utilizing biomechanical motion analysis of the pitching motion. Qualitative analysis of baseball pitching technique using standard 60Hz camcorders cannot provide a complete and accurate profile of the mechanics (Nicholls et al., 2003). Our study appears to be the first that has utilized a full-body wearable sensor motion analysis portable suit to analyze the pitching motion related to pitching accuracy. Coordination in pitching involves the timing of various body motions such as trunk rotation, lower limb drive, and non-throwing and throwing limb movements. The ability to drive the body forward over a stabilized front leg was characteristic of fast pitchers (Elliott et al., 1988). This current study is the first we know of that analyzes pitching accuracy using center-of-mass tracking as related to the lead foot position. This is a preliminary proof-of-concept study that in the future can be expanded and improved upon.
CONCLUSION AND PRACTICAL APPLICATIONS
The Xsens motion analysis suit, along with the described procedures within this study, could be used as an assessment process to identify flaws in the pitching motion. These identified flaws can be utilized by the pitcher and pitching coach to develop intervention to improve, reduce, or correct the flaws by being reassessed. The Xsens suit is portable and can be utilized for pitchers in the comfort and convenience of their respective pitching facilities, both indoors and outdoors, unlike many of the prior studies in which wall-mounted cameras and retroreflective markers are needed. This technology has the potential to provide the pitching coach and player with information that is concise, easy to understand and utilize, and allow them to implement interventions to optimize mechanics and to reduce variability. Also, biomechanical reassessment could help determine the efficacy of the interventions. These interventions may improve pitching performance and reduce the risk of injury for the baseball pitcher.
DR. PAUL CANAVAN is an Assistant Professor at Eastern Connecticut State University (ECSU). He is a researcher and rehabilitation specialist with emphasis on injury prevention and sport performance enhancement. He is a SABR member and an accomplished scholar and has presented internationally in China, England, Turkey, Canada and recently at the 2019 National NSCA Conference. He has worked with athletes of all levels including collegiate and professional. Dr. Canavan’s research has been published in many high-quality research journals including Medicine Science in Sport and Exercise, Journal of Strength and Conditioning Research, and Archives of Physical Medicine and Rehabilitation.
Acknowledgments
The authors would also like to thank Guidance Engineering for use of the High-Speed camera and Xsens™ Motion Analysis Suit. We would like to acknowledge the Head Coach Baseball Brian Hamm and Pitching Coach Chris Wojick and the volunteer pitcher participants. We would also like to express our gratitude to Christian Gosselin and Ashley Kennison for their help with data collection.
Funding
Partial funding for this project was provided by Eastern Connecticut State University and Guidance Engineering.
Declaration of Interest
The authors have no conflict of interest related to this study. The authors have no affiliations or involvement with organizations with any financial interest related to this study.
Sources
Atwater, A. E. 1977. “Biomechanical Analysis of Different Pitches from The Windup and Stretch Positions.” Medicine Science in Sports no. 9: 49-50.
Bethel, D. 1967. “Mechanics of Pitching.” Scholastic Coach 36 no.12: 86-88.
Brose D.E., Hanson D.L. 1967. “Effects of overload training on velocity and accuracy of throwing.” Research Quarterly 38 no. 4: 528-33.
Camomilla V., Bergamini E., Fantozzi, Vannozzi G. 2018. “Trends supporting the in-field use of wearable inertial sensors for sport performance evaluation: A systematic review.” Sensors no.18: 1-50.
Camp C.L., Tubbs T.G., Fleisig G.S., Dines J.S., Dines D.M., Altchek D.W., Dowling B. 2017. “The relationship of throwing arm mechanics and elbow varus torque.” American Journal of Sports Medicine 45 no. 13: 3030-35.
Dillman C.J., Fleisig G.S., Andrews J.R. 1993. “Biomechanics of pitching with emphasis upon shoulder kinematics.” Journal of Orthopedic Sports Physical Therapy 18 no. 2: 402-8.
Edwards D.K. 1963. “Effects of stride and position on the pitching rubber on control in baseball pitching.” Research Quarterly, American Association for Health, Physical Education, and Recreation: 9-14.
Elliott B., Grove J.R., Gibson B. 1988. “Timing of the lower limb drive and throwing limb movement in baseball pitching.” International Journal of Sport Biomechanics no. 4: 59-67.
Elliott B., Grove R., Gibson B., Thurston B. 1986. “A three dimensional cinematographic analysis of the fastball and curveball pitches in baseball.” International Journal of Sport Biomechanics no. 2: 20-28.
Escamilla R., Fleisig G., Barrentine S., Andrews J., Moorman C. 2002. “Kinematic and kinetic comparisons between American and Korean professional baseball players.” Sports Biomechanics no. 2: 213-16.
Escamilla R.F, Fleisig G.S., Zheng N., Barrentine S.W., Andrews J.R. 2001. “Kinematic comparisons of 1996 Olympic baseball pitchers.” Journal of Sport Science no 19: 665-76.
Escamilla R.F, Fleisig G.S., Groeschner D., Akizuki K. 2017. “Biomechanical comparisons among fastball, slider, curveball and changeup pitch types and between balls and strikes in Professional baseball players.” American Journal of Sports Medicine 45 no. 14: 3358-66.
Fleisig G.S., Barrentine S.W., Zheng N., Escamilla R.F, Andrews J.R. 1999. “Kinematic and kinetic comparison of baseball pitching among various levels of development.” J Biomech no. 32: 1371-75.
Fleisig G.S., Chu Y., Weber A., Andrew J. 2009. “Variability in baseball pitching biomechanics among various levels of competition.” Sports Biomechanics no. 1: 10-21.
Fleisig G.S., Diffendaffer A.Z., Ivey B., Aune K.T. 2018. “Do baseball pitchers improve mechanics after biomechanical evaluations?” Sports Biomechanics no. 3: 314-21.
Freeston J., Adams R.D., Rooney K.B. 2015. “Shoulder proprioception is not related to throwing speed or accuracy in elite adolescent male baseball players.” Journal of Strength and Conditioning Research 29 no. 1: 181-187.
Hang Y.S., Lippert III F.G., Spolek G.A., Frankel V.H., Harrington R.M. 1979. “Biomechanical study of the pitching elbow.” International Orthopedics 3 no. 3: 217-23.
Hulen J. 1966. “Checklist for Pitchers.” Scholastic Coach 1966; 35.
Kawamura K. Shinya M., Kobayashi H., Obata H., Kuwata M., Nakazawa K. 2017 “Baseball pitching accuracy: an examination of various parameters when evaluating pitch locations.” Sports Biomechanics, 16 no. 3: 399-410.
Karatsidis A., Jung M., Schepers M., Bellusci G., de Zee M., Veltink P.H., Andersen M.S. 2019. “Musculoskeletal model-based inverse dynamic analysis under ambulatory conditions using inertial motion capture.” Medical Engineering Physics no. 65: 68-77.
Koda H., Sagawa K., Kuroshima K., Tsukamoto T., Urita K., Ishibashi Y. 2010. “3D measurement of forearm and upper arm during throwing motion using body mounted sensor.” Journal of Advanced Mechanical Design Systems Manufacturing no. 4: 167-78.
Konrath J.M., Karatsidis A., Schpers H.M., Bellusci G., de Zee M., Andersen M.S. 2019. “Estimation of the knee adduction moment and joint contact force during daily living activities using inertial motion capture.” Sensors no. 19: 1-12.
Kosa A., Weib Y., Tomazi a S, Umeka A. 2018. “The role of science and technology in sport.” Procedia Computer Science no. 129: 489-95.
Kruger A., Edelmann-Nusser J. 2009. “Biomechanical analysis in freestyle snowboarding: application of a full body inertial measurement system and bilateral insole measurement system.” Sports Technology no. 2: 17-23.
Litwhiler Dl., Hamm L. 1973. “Overload: effect on throwing velocity and accuracy.” Athletic Journal no. 53: 64-65 1.
Marsh D.W., Richard L.A., Williams L.A., Lynch K.J. 2004. “The relationship between balance and pitching error in college baseball pitchers.” Journal of Strength and Conditioning Research 18 no. 3: 441-46.
Makhni E.C., Lizzio V.A., Meta F. Stephens J.P, Okoroha K.R., Moutzouros V. 2018 “Assessment of elbow torque and other parameters during the pitching motion: comparison of fastball, curveball and change-up.” Journal of Arthroscopic and Related Surgery 34 no. 3: 816-22.
McGinnis R.S., Perkins N.C. 2012. “A highly miniaturized, wireless inertial measurement unit for characterizing the dynamic of pitched baseballs and softballs,” Sensors no. 12: 11933-45.
Murray N., Black G , Whitely R., Gahan P., Cole M. Utting A., Gabbett T.J. 2017. “Automatic detection of pitching throwing events in baseball with inertial measurement sensors.” International Journal of Sport Physiology Performance 12 no. 4: 533-37.
Muybridge E. 1882, “The horse in motion.” Nature no. 652: 605.
Muybridge E. 1891, “The science of animal locomotion, Zoopraxography: An electro-photographic investigation of consecutive phases of animal movements.” Library of Alexandria.
Nicholls R., Fleisig G., Elliott B., Lyman S., Osinski E. 2003, “Accuracy of qualitative analysis for assessment of skilled baseball pitching technique.” Sports Biomech 2 no. 2: 213-26.
Pappas A.M., Zawack R.M., Sullivan T.J. 1985. “Biomechanics of baseball pitching: a preliminary report.” Am J Sports Med 13 no. 4: 316-222.
Paronto J. & Woodward B. 2014. National Collegiate Athletic Association Baseball 2015 and2016 Rules – italics?, Indianapolis, IN; 12.
Petroff T.W. 1966. “Movie analysis for pitching improvement.” Scholastic Coach 46 no. 10: 64-66.
Poitras I., Bielmann M., Campeau-Lecours A., Mercier C., Bouyer L.J., Roy J.S. 2019 “Validity of wearable sensors at the shoulder joint: Combining wireless electromyography sensors and inertial measurement units to perform physical workplace assessments.” Sensors no. 19: 2-14.
Reiff G.G. 1971. “What research tells the coach about baseball.” American Association of Health Physical Education and Recreation 1-38.
Rondilla L.F. 1929, “Muybridge’s motion pictures.” J Franklin Institute 208 no. 3: 417-20.
Sagawa K., Abo S., Tsukamoto T., Kondo I. “Forearm trajectory measurement during pitching motion using an elbow mounted sensor.” Journal of Advanced Mechanical Design Systems Manufacturing no. 3: 299-311.
Shinyra M., Tsuchiya S., Tamada Y., Nakazawa K., Kudo K., Oda S. 2017. “Pitching form determines probablastic structure of errors in pitching location.” Journal of Sport Science 35 no. 21: 2142-47.
Slajpah S., Kamnik R., Munih M. 2014. “Kinematics based sensory fusion for wearable motion assessment in human walking.” Computer Methods of Program in Biomedicine 116 no. 2: 131-44.
Solomito M.J., Ferreira J.V., Nissen C. W. 2017. “Biomechanical differences between left and right-handed baseball pitchers.” Sports Biomechanics 16 no. 2: 143-51.
Straub W.F 1968. “Effect of overload training procedures upon velocity and accuracy of the overarm throw.” Research Quarterly 39 no. 2: 370-79.
Supej M., 2010. “Wearable motion analysis suits have been utilized for several activities including Alpine skiing.” Journal of Sport Science 28 no. 7: 759-69.
Thurston B. 1984. Coaches checklist for film evaluation. Adelaide: Australian Baseball Federation.