

A Pitcher Shows His Age: The Case Study of Ace Winger
This article was written by Kent von Scheliha
This article was published in 2008 Baseball Research Journal
Ace Winger broke into the big leagues at the tender age of 21 and went on to a productive twenty-year-long pitching career. By the time he hung up his cleats at 40, he had notched 272 victories and logged 4,157 innings. He was known for his command of a bewildering array of pitches as well as for his pranks, some of which are the stuff of legend. In one spring-training game he was called in for relief. He strolled in from the bullpen dressed head to toe in a Frankenstein costume, complete with neck bolts. When the plate umpire told him to go back to the clubhouse and suit up, Ace raised his arms in the air and growled. Blue was not amused; Ace was booted.
Winger’s accomplishments on the field alone are worthy of a retrospective analysis, but there is another reason his pitching record deserves our attention. As luck would have it, Ace’s career trajectory happens to be a very good representation of how we would expect a pitcher’s performance to evolve as he ages. Of all the elite pitchers in major-league history, he put up the numbers that come closest to what could be considered “typical.”
More on the criteria that were used to select Winger for the subject of this study later. First, let’s establish a number of parameters that will help gauge the effects that aging had on his endurance, power, control, and, most importantly, his ability to win games. They are: innings pitched (IP), wins (W), earned run average (ERA), home runs per nine innings (HR/9), strikeouts per nine innings (K/9), walks per nine innings (BB/9), hits per nine innings (H/9), walks + hits per inning pitched (WHIP)
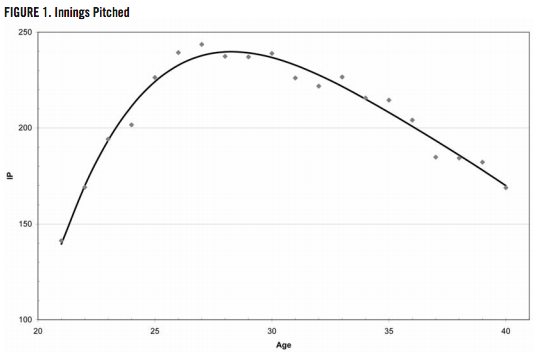
In the series of graphs that follow, each performance parameter is plotted against Ace Winger’s age. Two sets of data are presented in each graph. The points show the actual numbers he logged. The lines are curve fits through the data points. Mathematically, they range from first-order to fourth-order polynomials, depending on what creates the smoothest, or “best,” fit. The point of drawing the curves is to help illustrate the data trends and give a clearer visual representation of how his numbers changed as he got older.
Winger’s number of innings increased steadily in his early years, leveling off in his late twenties, followed by a gradual, almost linear decline. A pitcher’s physical endurance tells only part of the story, though. He is more likely to stay in games longer, and thus log more innings, when he is pitching well and winning.
Ace was no exception, as figure 2 shows.
Conventional baseball wisdom says that a player’s performance peaks around the age of 27. Winger had his highest win total at that very age, and the curve suggests that his best years were in his late twenties. Not surprisingly, the shapes of the curves for innings pitched and for wins are nearly identical. Thus, we should expect a close correlation between wins and ERA, right?
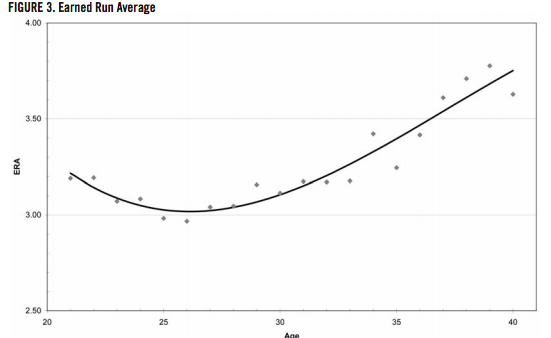
Curiously, Ace notched his best career ERA when he was 26, a year before his winningest season. This presents a conundrum. How could a guy win more games as his ERA started to get worse? For a start, we can speculate that when he was younger he was more likely to get yanked from a game at the first sign of trouble. As he became more “established,” he would be left in the game longer, logging more innings, even though his ERA had begun slowly to rise. Credit the “experience factor.” The longer he stayed in the game, the higher the probability that he would get the decision. Another possible explanation is pacing. The younger Ace may have given it his all early in the game, sometimes making for a quick exit. The more mature Ace was able to pace his effort and keep going into the later innings.
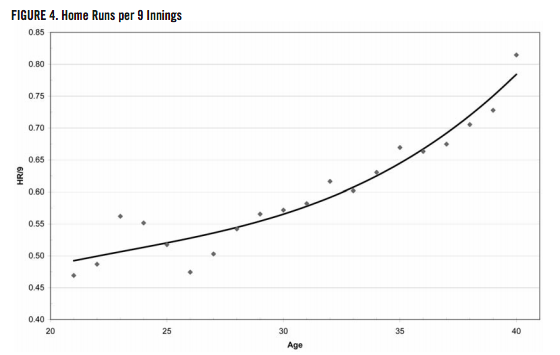
A pitcher’s ERA does not include runs scored owing to fielding errors, yet it is still arguably a statistic that is affected by the general quality of the fielders. A batted ball can fall for a hit or be turned into an out, depending on whether the fielder positions himself correctly or how quickly he reacts. A home run, although impacted by the characteristics of the ballpark, is the pitcher’s fault (neglecting the rarity of the inside-the-park round-tripper). The number of home runs a pitcher gives up per nine innings is a stat that isolates the pitcher’s performance from the quality of his team’s defense.
Winger’s tendency to give up the gopher ball was a bit erratic early in his career, but the general trend line shows it increasing with age. The rate of change is fairly steady in his twenties and then accelerates in his thirties.

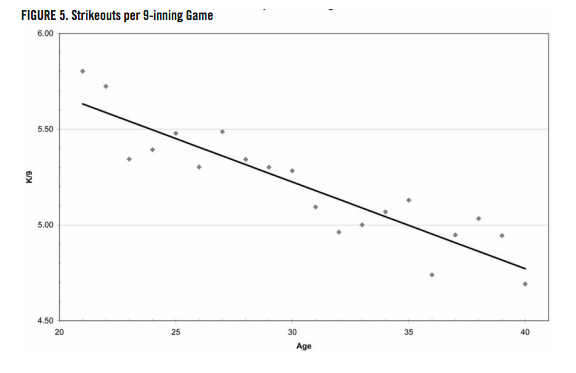
Winger posted his highest strikeout ratio in his rookie year. Although his ability to strike out batters bounced around during his career, the trend is for a straight decline over time. No surprise here. Pitchers who rely on velocity get the most strikeouts, and velocity declines with age as joints and muscles stiffen and wear and tear takes its toll.
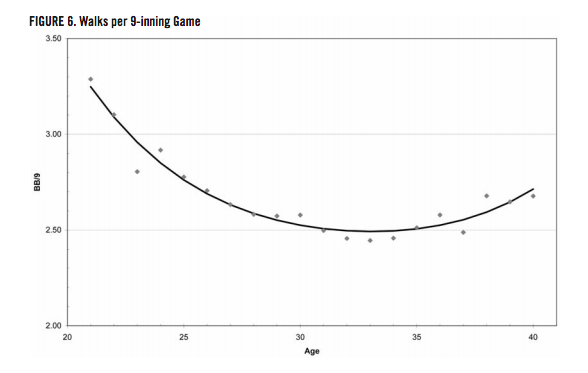
Control, however, is a completely other kettle of fish. Ace Winger had his best walks ratio at the ripe old age of 33. Perhaps to compensate for his decline in velocity, or maybe because of his improving “feel” for the strike zone, his control kept getting better even as his ERA continued to climb. How could that be? As Ace’s numbers show, when you put the ball over the plate, but you’re not blowing batters away with the heater, you give up more hits (and, as we have established, more home runs).
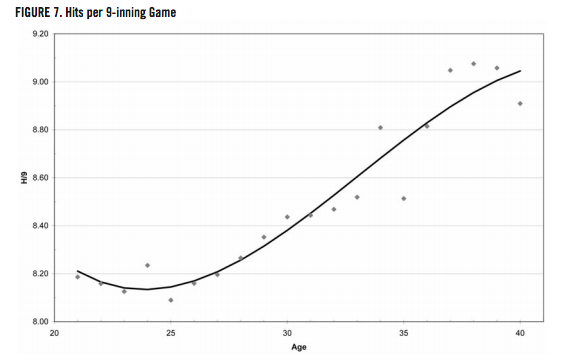
Winger’s hits ratio began climbing in his mid-twenties and never let up. For about a ten-year span, his walks and hits ratios moved in opposite directions, the former going down while the latter increased, which makes intuitive sense. Throwing more strikes will result in fewer walks, but batters will then swing at more pitches, which in turn will lead to more hits. The combined effects of these two parameters are revealed in his WHIP.
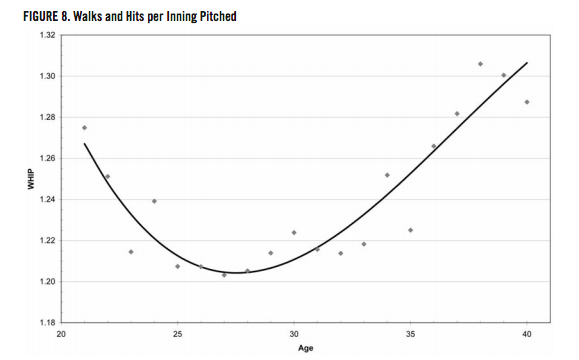
Ace’s curve for walks plus hits per innings pitched looks a lot like his ERA curve. The convergence of his combined ability to restrict hits and walks peaked around age 27.
The readers who have stuck with this study so far may be wondering if their memory is slipping. Why haven’t they ever heard of this Ace Winger guy, they ask? The reason they won’t find Ace in their Baseball Almanacs is that he never existed. He never threw a single pitch. Ace Winger is, in fact, a statistical Frankenstein. He is a composite of the 79 winningest pitchers of the modern era. His numbers as presented here are simply the averages of those from some of the greatest pitchers to play the game. Even though Ace Winger is a fabrication, his statistics are real.
The data sample for this study was taken from the top 100 all-time leaders in wins, minus the 21 who started their careers before 1900 (sorry, Cy Young).
The age range, 21 to 40, was picked because more than half of the 79 in the sample were pitching between those ages. Sticking to numbers compiled during the modern era eliminates a few things that might disrupt the analysis, statistically speaking. Back in the nineteenth century, many of the elite pitchers were putting up really crooked numbers. Check out Will White’s 680 innings of service for the 1879 Cincinnati Reds (he pitched in all but four of their games that year). Or Charley Radbourn’s 59 wins for the 1884 Providence Grays. Numbers like these don’t lend themselves to smooth curve fits.
A couple of arguments can be made against the validity of the data sample used here. Admittedly, 79 is a small number to use when attempting to project future performance, and it is likely the reason for the data scatter seen in the graphs. A more comprehensive data sample will alter the curve shapes somewhat, but the essence of the derived conclusions should hold. Further, the choice of historically “elite” pitchers renders this a nonrandom sample. Fair enough. Selecting highly successful pitchers gives us a group of pitchers who enjoyed long careers, thus providing more information on how they aged. A data sample of “average” pitchers creates difficulties because mediocrities don’t have the luxury of pitching into old age. A guy who is barely major-league material at his theoretical peak of 27 won’t be around much past 30.
No attempt has been made here to differentiate “power” from “control” pitchers. Making such a distinction could be difficult, especially when you consider how many pitchers successfully transitioned from the first type to the second. The only selection criterion for inclusion in the sample was the ability to win games.
It is clear, however, that elite pitchers (and, by extension, all pitchers) tend to hit the peak of their powers somewhere in their late twenties. After age 30, there is a steady decline.
There is one criterion that is not included in this study: salary. In today’s market, premier pitchers (and even mediocre ones) are the beneficiaries of an upward-sloping salary curve as they pitch well into their thirties.
Why, we may ask, would we pay a player more as his performance declines? It could be the seniority factor, or perhaps the notion that a player’s pay is heavily based on his past performance. Regardless, is it better business to sign high-priced free agents in their thirties or to go with cheaper up-and-coming guys in their twenties? I will leave the answer to others..
It seems Ace Winger may have watched his salary grow in his declining years. His agent, Scotty Borax, would have made sure of it.
KENT VON SCHELIHA lives in Kirkland, Washington, and is an engineering manager in the aerospace industry.