

A Probabilistic Investigation of the Major League Baseball Modified Extra Innings Rule
This article was written by David C. Hyland
This article was published in Fall 2022 Baseball Research Journal
Major League Baseball (MLB) has seen the length of games increase and has explored ways to shorten it.1 Because increasing run-scoring disparity should shorten extra-inning games, in 2020 MLB introduced a rule intended to reduce the length of extra-inning games. The rule, which places a runner on second at the beginning of each extra inning, was adopted during the COVID-19 pandemic to reduce the number of pitchers used and to limit player exposure to each other and staff.
After the 2020 season, MLB Commissioner Rob Manfred said, “I think the players like it. I think it’s really good from a safety and health perspective that keeps us from putting players in situations where they’re out there too long or in positions they’re not used to playing.”2 The rule was continued in 2021 and 2022.3
The purpose of this paper is to demonstrate a methodology that shows how a rule change—such as the runner on second to start extra innings—can be analyzed without having to run the experiment in actual games. The modified rule is intended to increase scoring, resulting in fewer ties after each extra inning, thereby ending the game sooner. We use conditional probabilities to predict how many extra innings would have been played under the modified rules in 2019. We also examine how many innings are predicted by our methodology under the new rule and compare our predicted results to what actually occurred in 2021.
We use run-scoring probabilities with the modified rules to analyze the probabilities of the number of innings that would be played out under the pre-2020 rules versus the modified rules. Our methodology predicts that under the modified rules approximately 54% more games would end in 10 innings instead of going longer. Results from 2021 show that actual games played according to the modified rules end in a similar length to what our methodology predicts.
In 2020 and 2021, at the start of an extra inning, the player who precedes the leadoff batter that inning in the batting order starts at second and the inning is played out. In this paper we use the 2019 MLB runscoring environment to predict scoring in extra innings to analyze how quickly games would have ended compared to how long they actual went. We then use the methodology on 2021 data where games were played under the modified rules. Our methodology predicts an outcome similar to what actually occurred.
Proponents of the modified rule argue that fans would be more likely to stay for the end of a game if it was expected to be shorter. Opponents of the rule object to the different rules for an extra inning on purity grounds and argue that part of the fun of the game is that it might go on for a long time. In 2019, approximately 9% of MLB games went to extra innings and the average extra inning game lasted 11.3 innings.4 In 2021, 9% of MLB games also went to extra innings, but they averaged only 10.3 innings.
We will examine how much shorter (or longer) a game would go if the inning starts with a runner on second. This methodology could be used to examine alternative rule proposals as well. If MLB wanted to predict the change in innings played with a runner on third, or first and second with one out, this methodology could also be used.
METHODOLOGY
The methodology of the paper is to use the probabilities from the past season data to investigate the effect of a modified rule without having to actually run the experiment. We can analyze prior season MLB play-by-play data to calculate the probability of scoring 0, 1, 2, and so on runs in an inning. In extra innings, when one team scores a different number than their opponent, the game is over. For example, if the probability of scoring 0 runs is 60%, then the probability of both teams scoring 0 runs is 60% ! 60%=36%. If the probability of scoring 1 run in an inning for both teams is 20%, then the probability of the game continuing because each team scored 1 run is 20% ! 20%=4%. We can add up the probabilities of scoring the same number of runs to determine the probability of the game continuing. This assumes that scoring by the two teams in an inning is independent. We show that it is independent.
The following equation shows the probability of a game continuing after an extra inning:

There are 24 base/out states that can occur in the game of baseball. A typical inning starts with nobody on and nobody out, but as the inning progresses, the state changes. For example, the bases could be loaded with no outs, one out, or two outs. The inning ends when three outs occur. It is common to calculate the number of runs expected based on the base/out state. For example, with a runner on first and nobody out, we can calculate the change in run expectancy for strategies like sacrifice bunting and stealing.
In the modified rules extra inning scenario, we can use the 24 base/out states to determine the probability of scoring different numbers of runs given that a runner starts on second base with no outs. In fact, we can analyze many different modified rules this way (such as runners on first and second with one out, etc.). We can compare the probabilities of the game continuing under the modified rules scenario with the traditional baseball rules to determine the difference in probabilities for the length of the game.
Retrosheet data from 2019 are used to determine how many runs are scored in a typical inning, along with the probability of scoring one run and the probability of scoring additional runs. We also examine whether scoring in an inning by two teams is independent. Using the typical run-scoring environment, we calculate the probabilities of scoring the same number of runs from each extra inning going forward. When the home team scores a different number of runs, the game is deemed to be over. We calculate the probability of the inning ending based on the scoring environment. We compare the probability of an inning ending under modified rules to the probability under traditional rules.
DATA
We used the Retrosheet 2019 and 2021 play-by-play data to get the most recent run-scoring environment for our analysis. We do not show results from the 2020 season, which was shortened to 60 games due to the pandemic, but the results are consistent with our methodology.
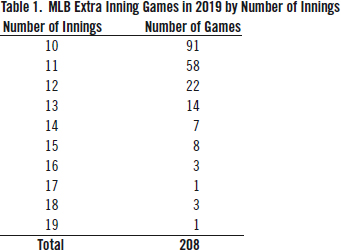
Table 1 lists the number of extra-inning games in 2019 by the number of innings played. The 208 extra inning games in 2019 represented approximately 9% of all games played. Of those games that went extra innings, 91 finished in the tenth inning (approximately 44%). The remaining 117 are the most interesting for the purpose of this study, because we want to study the extent to which the extra inning rule would shorten those games.
In 2021, 216 games went to extra innings. For the purposes of this study, we only count a game as going to extra innings if it went beyond 9 innings and limit our sample to games that went 10 innings or more. In 2021, both games of double headers were only 7 innings, not 9. If they went 8 or 9 innings, they were not counted as “extra innings” in this study.
The 117 games that went beyond 10 innings in 2019 represented about 4 games per team or 5% of a team’s 81 home games. If a fan at one of those games decided to go home because the prospect of a long contest was unappealing, the team would experience an inherent financial impact if that fan was discouraged from attending future games. Additionally, teams have to cover pitching and playing for all the additional innings. A long contest might require a team to burn through a lot of pitchers, which would affect the team for many games to come.
In 2019 the San Francisco Giants played 16 extra-inning games, totaling 54 extra innings during the season (the most in MLB), while the Chicago White Sox played 8 games, for a total of 19 extra innings (the least in MLB).5 Thus, the Giants had to come up with 35 innings-worth of pitching (almost four regular-length games) more than the White Sox, a considerable strain on the Giants’ pitching staff.
In 2021, with modified rules, the Minnesota Twins played the most extra-inning games with 21, whereas the Los Angeles Dodgers played the most extra innings with 30. Half the teams in 2019 played more extra innings with traditional rules than the Dodgers played in 2021 with modified rules.
ANALYSIS
The first step in analyzing the modified extra-inning rule is to examine the current scoring environment. Table 2 lists the pertinent data for the 2019 season. The first two columns list the number of times the visiting team scored 0–11 runs in an inning. The third column lists how many times the home team scored the same number of runs in the same inning as the visiting team, and the fourth column shows how many times the home team scored a different number of runs.

Teams scored the same number of runs in an inning 54% of the time and a different number 46% of the time. For example, if the visiting team scored seven or more runs, the home team never scored the same number of runs as the visiting team. The most common number of runs scored by the visiting team was zero. Seventy-two percent of the time when the visitor scored zero runs, the home team also scored zero runs. However, if the visitor scored one run, the home team responded with one only 14% of the time. Probabilities drop significantly as additional runs are scored by the visitor.
We tested to see if there is a correlation between runs in the same inning. We find that there is a 0.009 correlation in scoring the same number of runs in the same inning by both teams. For the purposes of this paper, we treat scoring within an inning as independent. In other words, the runs scored by the visitor does not affect the number of runs that will be scored by the home team.
According to Table 2, the most common outcome in an inning is for both teams to score zero runs. This occurs 51% of the time. Increasing the probability of scoring by the teams (up to a certain point) is likely to make the teams score a different number of runs, which would end the extra-inning game.
RUN EXPECTANCY
Analytically-inclined baseball analysts commonly view the game as a Markov chain. A normal inning starts with nobody on and nobody out. The game progresses to new states after each batter. If the leadoff batter hits a home run, the state remains at nobody on and no-body out. If the batter strikes out, the state goes to nobody on and one out, while a single changes the state to a runner on first and no outs. The inning continues until the absorbing state of three outs. Table 3 lists the expected number of runs that will score based on each of the 24 base/out states using the Retrosheet play-by-play data.
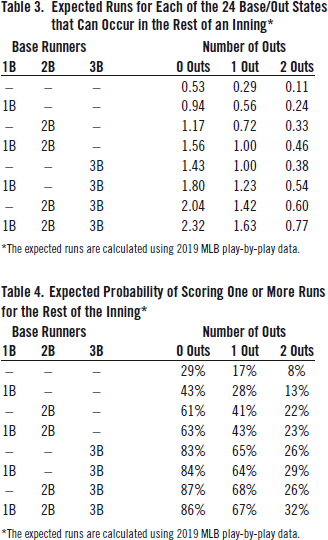
In 2019, in the normal scoring environment of no outs and nobody on base, 0.53 runs are expected to be scored by the batting team. Under the new extra innings scenario, 1.17 runs are expected if a runner starts on second with nobody out. The run expectancy is increased, but it is increased for both teams. We need to find out the probability of scoring a specific number of runs—namely, the probability of scoring 0, 1, 2, and so on runs.
Table 4 lists the expected probability of scoring one or more runs for the rest of the inning based on each of the 24 base/out states. The probability of scoring a run from the traditional nobody on and nobody out state is 0.29, but if the inning starts with a runner on second and nobody out, the probability of scoring one or more runs jumps to 0.61.6
Table 5 compares the probability of scoring 0–7 runs in an inning under traditional baseball rules (i.e., nobody on, nobody out) and the probability of scoring 0–7 runs under the modified rules (i.e., starting with a runner on second base). The probability of scoring more than seven runs in an inning is negligible. The table also lists the probability of the inning continuing, which occurs when both teams score the same number of runs. For example, under traditional rules, each team has a 71% chance of scoring zero runs, and there is a 50.6% chance that they will both score zero runs. Under modified rules, there is a 39.4% chance that each team will score zero runs and only a 15.6 % chance that they will both score zero runs.
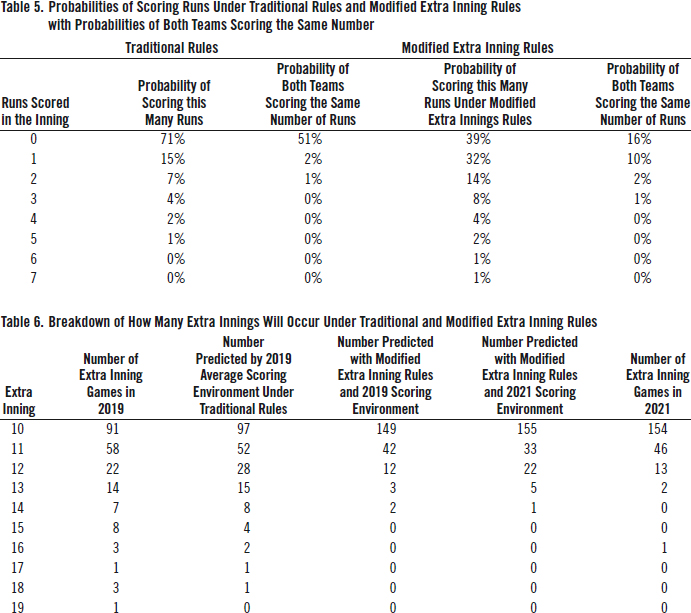
The total probability of both teams scoring the same number of runs under traditional rules is 53.5%, whereas the total probability of both teams scoring the same number of runs under modified rules is 28.3%. This suggests that 53.5% of games will continue after the 10th inning under traditional rules, while only 28.3% will continue under modified rules. We assume that scoring is also independent across innings. This means that 53.5% ! 53.5%=28.6% of extra innings games will go at least 12 innings under traditional rules, while 28.3% x 28.3%=8.0% of extra innings games with modified rules will go at least 12 innings.
Table 6 breaks out the extra innings games in 2019 by innings along with the number predicted from the 2019 scoring environment and the number predicted based on the modified extra innings rules. In 2019, there were 478 extra innings played. Based on the average scoring environment in 2019, we would predict that there should have been 440 extra innings played under traditional rules and 288 extra innings played using modified rules. It is possible that this number is lower than expected because teams make late inning substitutions for defensive purposes, which might make run scoring decrease from the average. Under the modified extra innings rules, we would predict that 53 games or 54% more would end in the 10th inning.
The final two columns of Table 6 list the number of extra innings predicted using our methodology and the actual number of extra inning games played in 2021. We used the 2021 run-scoring environment in our analysis. The average number of runs scored per team per game was 4.53 in 2021 versus 4.83 in 2019. These numbers are statistically significant. The average number of runs scored in the period 2016–19 was 4.60, which is not statistically different from the number of runs scored in 2021.7
The prediction for ending in 10 innings is only off by one game, while the number of games expected to end in 11 innings is lower than actual. The difference isn’t large. It will be interesting to observe if this difference persists going forward. Will teams employ different strategies under the modified extra inning rules (e.g., will teams attempt to advance the runner on second via the bunt?) and will these strategies be optimal? Also of interest was the one 16-inning game in 2021, which can be viewed as an outlier or possibly a limitation of the methodology. The possibility of the extreme outlier might make that game even more special for the lucky fans who were able to see it.
CONCLUSION
In this paper we show how to use conditional probability analysis to examine the effect of changing the rules for extra innings in Major League Baseball. We can use the probability analysis to determine how the modified rules will affect the length of the game without actually having to run the experiment. The modified extra innings rule is expected to reduce innings beyond the 10th by 53%. Additionally, 92% of the extra innings games are expected to end by the 11th inning, and there is almost no chance of going beyond 14 innings. Other potential rules, such as putting runners on first or third or first and second, can be analyzed with this methodology. The results from 2021 show that the methodological results are similar to what teams actually experience with the continuation of extra innings. Our methodology predicts that in the full season of 2021, 61 games would go beyond the 10th inning based on the 2021 run-scoring environment with a runner on second. In actuality 62 games lasted beyond the 10th inning.
DAVID C. HYLAND, PHD, is a finance and sabermetrics professor at Xavier University. He has been a SABR member since 2018. He is a lifelong fan of the Cincinnati Reds. He is also a Xavier baseball fan and a board member for the Florence Y’Alls in the Frontier League.
Sources
Retrosheet MLB Play by Play Data: https://www.retrosheet.org/
Tango, Tom, Michael Lichtman, and Andrew Dolphin. 2006. The Book: Playing the Percentages in Baseball. Lexington, KY: TMA Press.
Notes
1. Liz Roscher, “Commissioner Rob Manfred Really Wants to Shorten Baseball Games,” January 20, 2017, Yahoo! Sports. Accessed September 6, 2022. http://sports.yahoo.com/news/commissioner-robmanfred-really-wants-to-shorten-baseball-games-170119673.html.
2. Associated Press, “MLB Commissioner Rob Manfred Wants to Keep Expanded Playoffs, Extra Innings Rule beyond 2020.” USA TODAY, October 20, 2020, Accessed August 26, 2022. https://www.usatoday.com/story/sports/mlb/2020/10/20/ap-interview-manfred-likes-larger-playoff-runner-inextras/114452370.
3. These types of extra innings rules are used in youth baseball and have been tested in other professional baseball leagues, such as the Korean Baseball Organization (KBO), as well as independent and affiliated minor leagues.
4. In 2021 there were 9 more extra innings games than 2019.
5. The Tampa Bay Rays played 19 extra innings games for the highest number of games but did not play as many extra innings as the Giants.
6. In 2021 the probabilities are very similar. For example, the probability of scoring 1 or more runners with a runner on second base and no outs is also 61%.
7. There is no statistical difference in the proportion of home team wins between 2021 and 2019 and no statistical difference between 2021 and the period 2016–2019.