

An Infield Hit Model From the 2023 MLB Season: ‘Hit ‘Em Where They Ain’t’
This article was written by Donald Slavik
This article was published in Spring 2024 Baseball Research Journal
INTRODUCTION
Major league baseball teams routinely use analytics to position infielders based on hitter tendencies, but these data do not always provide a complete story. If a hitter always pulls the ball, it is difficult to use that data to assess quantitatively the benefits of balls hit into zones that exploit defensive alignment gaps. The purpose of this research was to develop a model that predicted hit trends impacted by infielder positioning. Baseball Savant data were used to establish hit probabilities from 53,075 groundballs, 29,398 line drives, and 8,509 popups from the 2023 season. The model inputs were batter handedness, batted ball type, spray angle, launch speed, and infield defensive alignment.
The model determined hit probabilities for each batted ball and summed them to predict hit totals for individual players and teams. Hit simulations were performed to highlight the quantitative impact of launch speed, batted ball type, and spray angle. These results were then used to define how hit outcomes could be improved for hitters. This study honors the instincts of the great hitter Wee Willie Keeler to “hit ’em where they ain’t.”
RESEARCH MOTIVATION
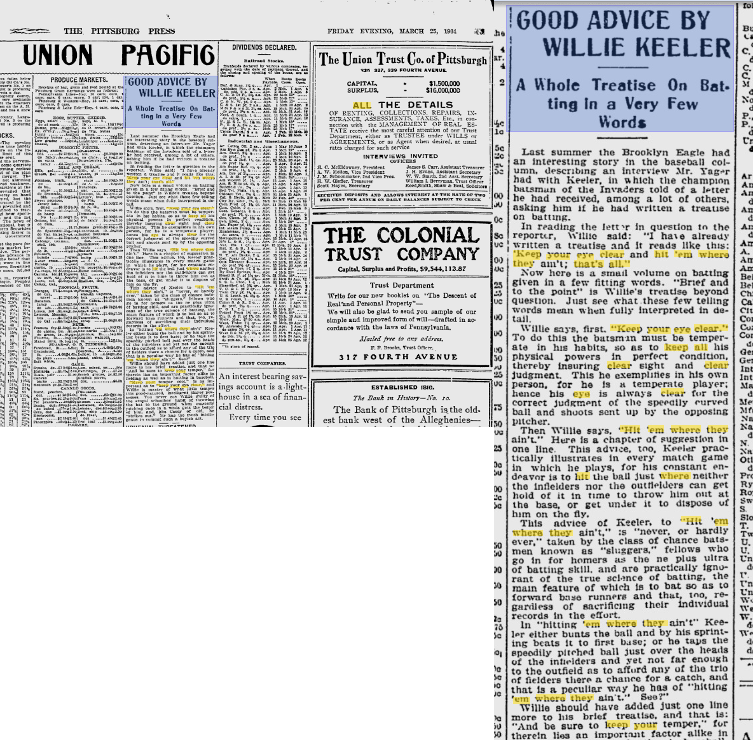
From 1892 to 1910, Wee Willie Keeler played for four teams in the American and National Leagues. He was inducted into the National Baseball Hall of Fame in 1939, and according to his plaque, he was “baseball’s greatest place-hitter; best bunter.”1 Despite the 5-foot-4 frame that inspired his nickname, Keeler could really hit. In 1897, he had a 44-game hit streak and led baseball with a .424 batting average. In 1899, he struck out only twice in 633 plate appearances. Although he played in an era of higher batting averages and lower strikeout rates, Keeler was still an outlier. According to FanGraphs, his .341 career batting average was 24% higher than the league average for the time, making it the 15th-highest league-adjusted mark in AL/NL history among players with at least 600 plate appearances.2 Willie outlined his legendary hitting philosophy to reporter Abe Yager of the Brooklyn Daily Eagle during a rain delay on August 7, 1901: “I have already written a treatise and it reads like this: ‘Keep your eye clear and hit ’em where they ain’t; that’s all.’”3
How does that advice apply to baseball today? Hitters have focused on launch angle and launch speed for home run production. “If you’re 10 years old and your coach says to get on top of the ball, tell them no,” said Josh Donaldson in 2017. “Because in the big leagues these things that they call groundballs are outs. They don’t pay you for groundballs. They pay you for doubles. They pay you for homers.”4 The infield shift further increased the focus on launch angle.
“Batters saw hit probability on grounders reduced by the shift, so they tried to hit over defensive alignments,” wrote Tom Verducci. “From 2015 to ’22, the shift helped take 2,065 ground-ball hits out of the game.”5 So in 2023 MLB banned the infield shift. According to MLB.com’s Anthony Castrovince, “These restrictions are intended to increase the batting averages on balls in play, and to restore more traditional outcomes on batted balls.”6
Every hitter would like to hit home runs or hard line drives into the gap in every at-bat. Since this is not possible, understanding the benefit of different hitting approaches in unique game situations is important. This study developed a model that predicted hit totals for players from the 2023 season. The model was then used for quantitative predictions of additional hits with different sensitivity study assumptions. How many extra hits are expected with increased launch speed? How many extra hits are expected with fewer popups, or more groundballs? And how many extra hits are expected from more favorable spray angles—from hitting ’em where they ain’t?
PREVIOUS WORK
Using hit probabilities from the 2017 season, Jim Albert established a novel iterative approach to determine hit probabilities based on spray angle and launch speed.7 That work did not take defensive alignment into account. More recent work has specifically focused on how infield alignment affects offensive performance. In 2022, Russell Carleton broke down the effect of infield alignment on several offensive statistics for both left-handed and right-handed batters during the 2021 season.8 The shift impacted the rates of strikeouts, walks, balls in play, singles, and other metrics, but no metric saw an increase or decrease of more than four percentage points. Carleton’s study briefly highlighted spray angle as an important parameter, but it did not establish hit probabilities for different spray angles or hit types.

DATA
The goal of this work was to develop a predictive infield hit model. The baseline data were obtained using Baseball Savant’s search feature.9 For each batted ball type, a CSV file was downloaded containing 81 populated data parameters.10 For reference, Figure 2 shows examples of infield alignments, as well as an example of the spray angle (phi). The shade infield alignment tag was introduced in 2023 to denote alignments in which a fielder is positioned outside of his traditional area of responsibility, such as a shortstop playing close to second base or in the hole over by the third baseman. Strategic infield alignment is a catch-all for other alignments, such as an infielder playing in or guarding the line. In Figure 2, the black dots show standard alignment, and the white dots show the infielders shaded toward the pull side. The strategic alignment and spray angle will be discussed more in upcoming sections.
A data scorecard of total at-bats by hit type is provided in Table 1. At-bats with incomplete information, labeled Null At-Bats, were excluded from the model.
MODEL METHOD AND ASSUMPTIONS
Batted Ball Types: The model focused on balls in play impacted by infield alignment. In the first three columns of Table 2, field outs are separated by batted ball type and broken down by whether they were hit to an infielder or an outfielder.11 The batting averages of different batted ball types are broken down in the last four columns of Table 2. The columns on the left were used to understand trends, while the columns on the right were used for model development. Nearly all groundball and popup outs were fielded by infielders, so the infield hit probability model included all groundballs and popups. Most fly ball outs were fielded by outfielders, so fly balls were excluded from the probability model.

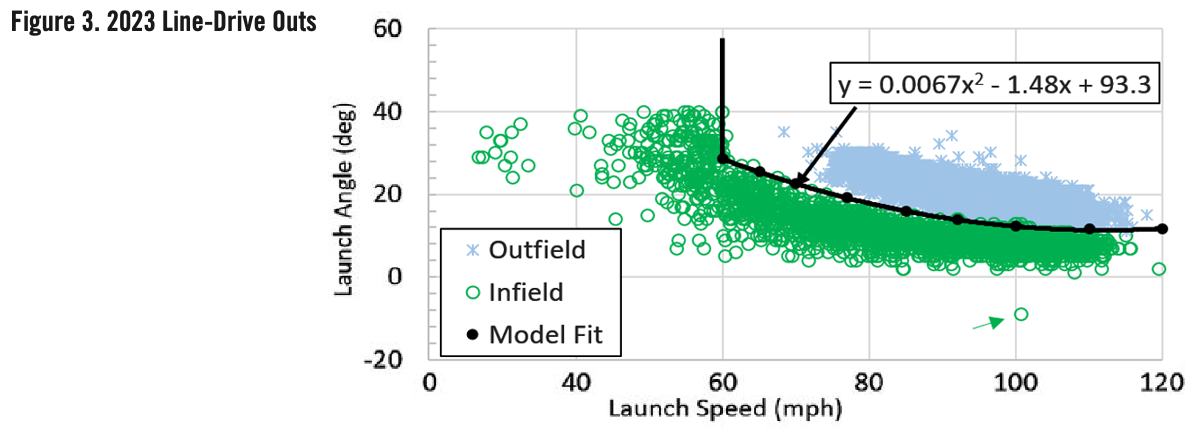
Line drives were more complicated. Infielders caught 29.7% of line drive outs and outfielders caught the other 70.3%. Line drive outs as a function of launch speed and launch angle are shown in Figure 3. If an infielder was in the right position, he made the play on all line drives below 60 mph, as well as harder-hit line drives at launch angles below 12 degrees. The infield line-drive envelope is shown with solid line fits in Figure 3. All line drives within the darker envelope are defined as infield line drives and included in this study.12
Please note that for the purposes of this study, the term “infield balls” does not refer to balls that stay in the infield. It refers to balls that could be fielded by an infielder, were they in position to make the play. Specific model input parameters will be discussed in detail next.
Spray Angle: A ball hit right back to the pitcher would have a phi of 0 degrees, while a ball hit down the third base line would have a phi of 45 and a ball hit down the first base line would have a phi of -45. Unfortunately, spray angle was not directly provided in Baseball Savant. It was calculated using the location where the ball was fielded (variables hc_x and hc_y), according to an equation produced by Jeff and Darrell Zimmerman and published by Bill Petti:13
Equation 1. Spray Angle
Spray Angle = -0.75(180/ π) atan [(hc_x – 125.42)/(198.27 – hc_y)]
The adjusted spray angle from Equation 1 is defined as a positive number for pulled balls, and it is calculated by multiplying the spray angle of left-handed batters by -1.
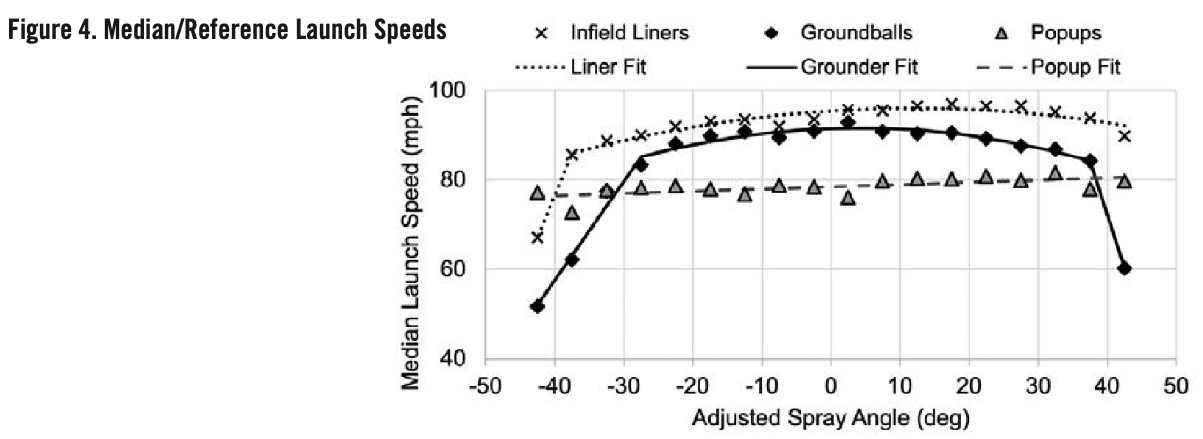
Reference Launch Speed: As the work evolved, it became apparent there was no simple step or equation that could predict hits directly from the adjusted spray angle. But it was possible to break the problem into easily understood steps that gradually led toward the desired result. The first major step focused on hit trends for the most common launch speed, known as the reference launch speed. This was established from the baseline datasets for each batted ball type. Infield line drives were hit hardest, with only a slight decrease for groundballs and a larger decrease for popups. Launch speeds were reasonably uniform between adjusted spray angles of 40 degrees and -30 degrees, with a drop-off at the extremes.14
Reference Hit Probabilities: Reference hit probability, or ref hit prob, is the batting average for each batted ball type within 5 mph of its reference launch speed. The reference hit probabilities of groundballs for left-handed hitters are shown for standard/strategic alignments and shade alignment in Figure 5. For zones with fewer than 10 at-bats, batted balls were grouped across adjoining zones to produce reasonable statistics. These are indicated by an x in subsequent graphs. Reference hit probabilities for standard and strategic infield alignments were similar, so these categories were grouped together. The solid black lines are model input curves, and infielder representative positions are marked by circles on the x-axis. Hit probabilities vary dramatically based on spray angle and infielder positioning, with probability minimums at angles where fielders are positioned. Peaks and minimums differ slightly for shaded and non-shaded alignments. Adjusted spray angles near 2.5 degrees and below -30 degrees were great places for lefties to hit the ball.

Reference hit probabilities of groundballs for right-handed hitters are provided in Figure 6. Between the middle infielders, around 2.5 degrees, was a great place to hit the ball for righties.
Reference hit probabilities for line drives are shown in Figure 7. Line drives have local minimums where infielders are stationed. A right-handed shade hit probability could be considered in the future if larger sample size becomes available. It was not surprising that hit probabilities were good for infield line drives, but it was surprising to the author that the hit probabilities were above .500 for almost all spray angles.

Finally, hit probabilities for popups are provided in Figure 8. Popups resulted in very poor hit outcomes, with no significant correlation with launch speed.

Launch Speed Factors: The author evaluated a number of different approaches to include launch speed effects in the hit model. After a significant amount of trial and error, a relatively simple equation was developed that captured hit trends.
Hit probability, or hit_prob, was calculated using the launch speed, the reference launch speed, the reference hit probability, and the launch speed factor, or m. If the launch speed constant m was zero, launch speed had no impact on hit probabilities. For large m, increased launch speeds increased hit probabilities. The launch speed constants were determined with an iteration algorithm that minimized the difference between observed and predicted total hits in each spray angle zone for high and low launch speeds. Hit probabilities were constrained to physically possible values between 0% and 100%. This check was required at very high and very low launch speeds during the optimization routine and/or for hit predictions.
Groundball launch speed factors at low hit speeds (launch speeds below the reference launch speed) and high hit speeds (launch speeds above the reference launch speed) are shown in Figure 9. Balls hit with high and low launch speeds exhibited different behavior. The launch speed impact on hits was less at low launch speeds, with m typically between 0 and 5. It was more pronounced at high launch speeds, with m up to 11. This was incorporated into the model with a high- and low-speed fit constant. The optimizer initially produced large swings in m for zones with very low reference hit probabilities below .150. These zones were generally found to have much higher hit probabilities at both low and high launch speeds. A modest increase in the very low reference hit probability led to convergence with consistent values across adjacent spray angles for these cases. This was the main step where user judgement was required; it can be thought of as a data-grouping beyond +/-5 mph launch speeds for these special cases. These adjustments are identified with x symbols at the intermediate angles in Figures 5 and 6.
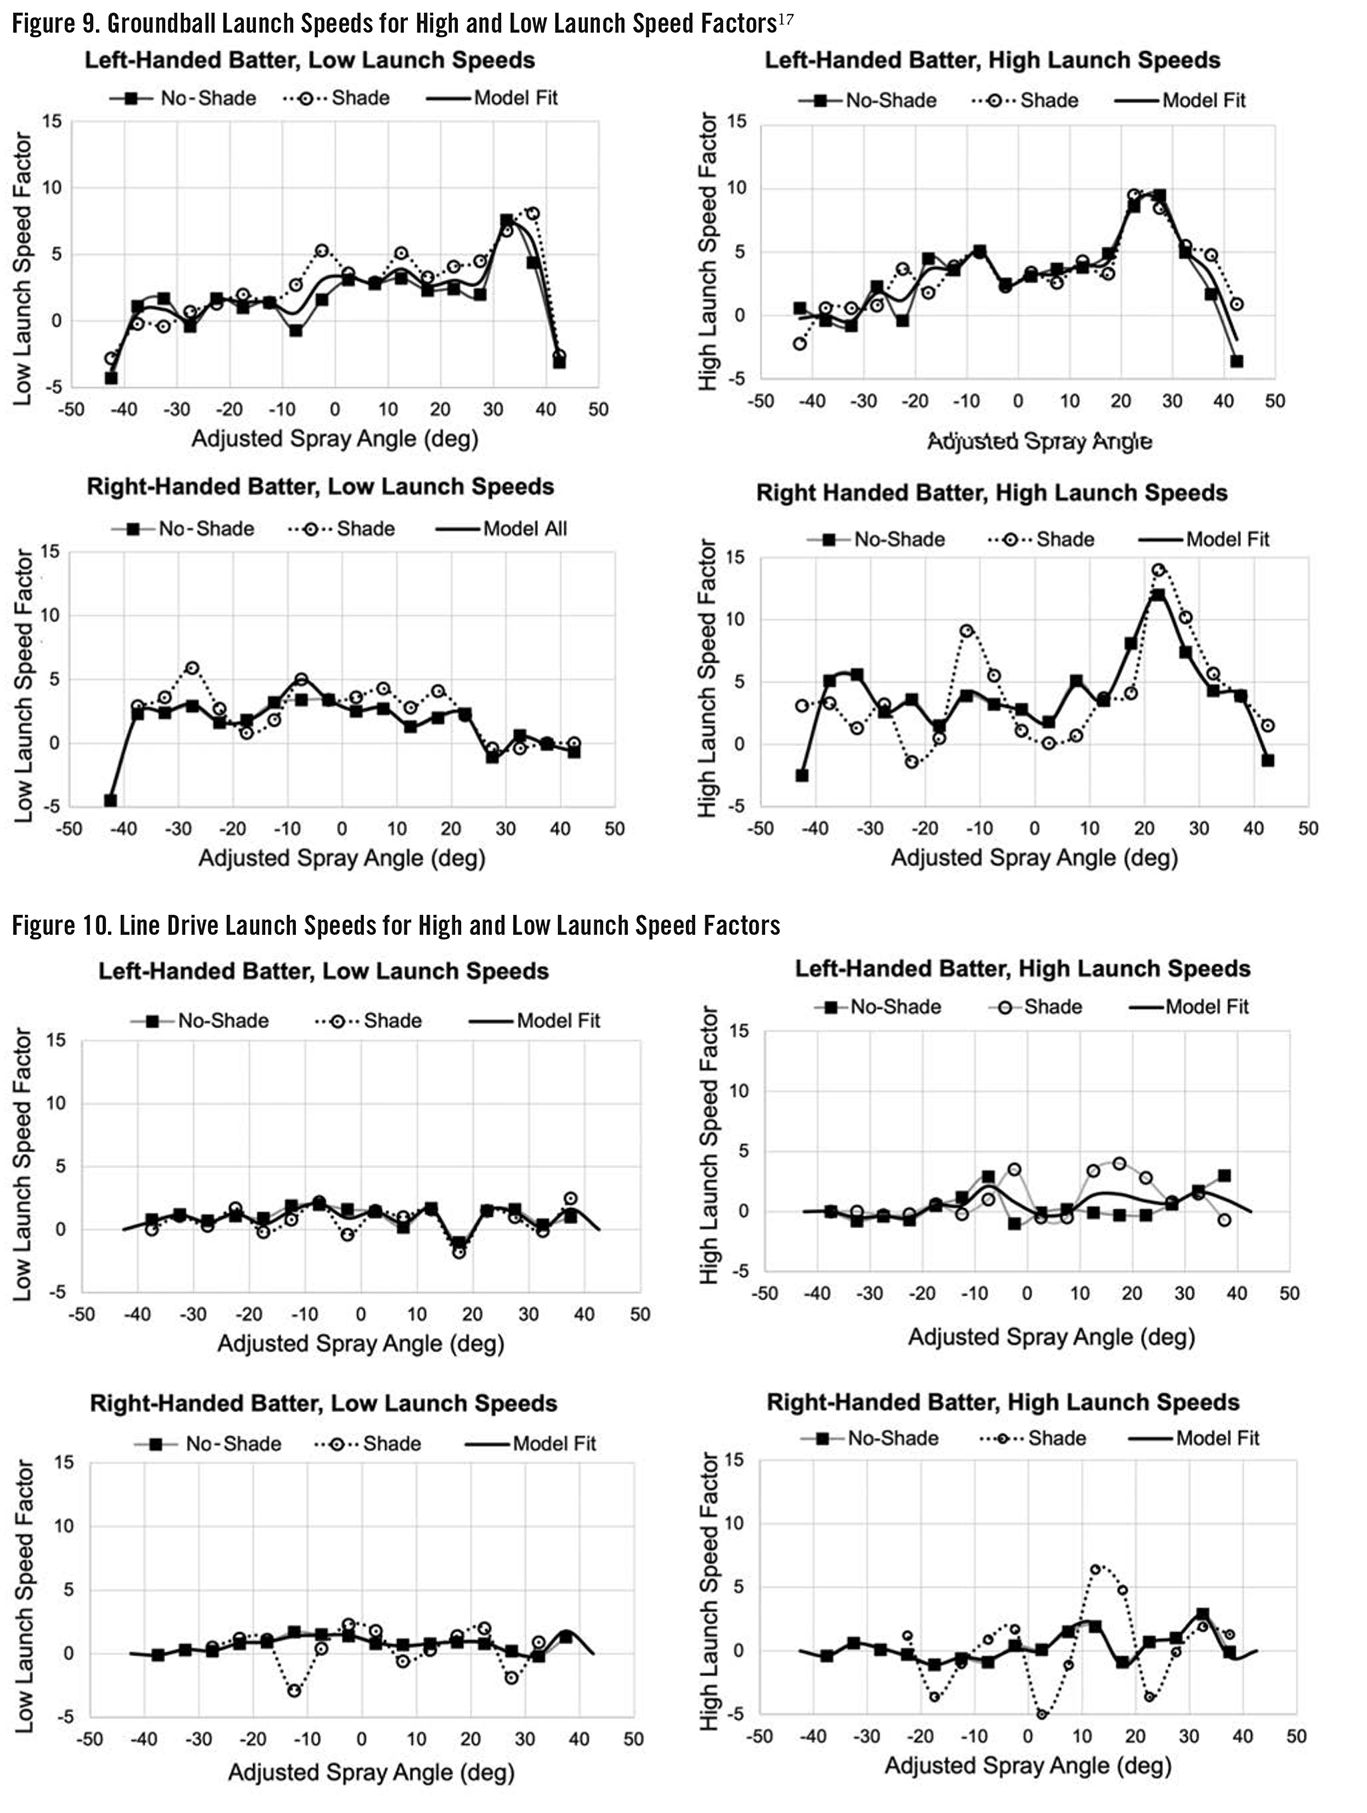
Note that the launch speed constants were negative at some spray angle extremes, indicating a benefit from a reduced launch speed. This would be on poorly hit balls down the line that are a difficult play for the pitcher or corner infielder playing at typical depths.
Speed factors for infield line drives are shown in Figure 10. Launch speed did not have much effect on hit probability.
Finally, there were no hit speed factors for popups in the model. Popup hit probabilities were so low that no attempt was made to further quantify popups. Hitters should simply minimize popups as best they can.
Infield Hit Model: Model constants were the infield line drive envelope (Figure 3), the reference launch speed (Figure 4), the reference hit probabilities (Figures 5 through 8), and the launch speed factors (Figures 9 and 10). Since reference batted ball type probabilities and launch speed curves were highly non-linear, no attempt was made to fit equations across spray angles for these terms. Values for each zone were instead put in lookup tables that were accessed for each at-bat.
The launch angle was not directly included as a model input, but it was indirectly accounted for through unique hit probability fits for each batted ball type. The handedness of the pitcher was not included in the model, as it was shown not to impact hit probabilities early in model development. The pitcher impacts whether and where the ball is put in play, but not whether it will turn into a hit.
MODEL RESULTS
Model equations and constants were first confirmed from hits for subgroups into each hit zone. Python code was written to count observed hits and to predict hits in each spray angle zone. Total predicted hits were determined by adding hit probabilities for each at-bat using Equation 3.
Hit probability for each at-bat was determined using Equation 3, ref hit prob were the hit probabilities established from values in Figures 5 through 8, and hit adder was a hit probability term that reflected launch speed effects. The observed and predicted hits in each zone for each batted ball type are shown in Figure 11. Each symbol represents the total hits in each subgroup and each zone. A solid line is a perfect correlation. The model accurately predicts overall hit behavior in all spray angle zones for all batted ball types.
Hit probabilities were next determined for each player, using Equations 2 and 3. Figure 12 shows predicted and observed hits for each MLB player and each MLB team. On the left, each symbol represents the hit totals for 645 MLB players with 72,302 at-bats. The solid line represents a perfect correlation. Overall, the model works quite well for all players. Luis Arráez, who led MLB in batting average, and Ronald Acuña Jr., who led in total hits, are highlighted. The total number of predicted infield hits, 21,252, was just 0.18% below the observed hits of 21,290.

On the right, each symbol represents the infield hits for one of the 30 teams. Predicted and observed hits with each team name are also provided in Figure 13. The model was representative of the total hits of all MLB teams.
SENSITIVITY STUDIES AND DISCUSSION
The model was next used for sensitivity studies to understand how players and teams can best improve hit outcomes. How many additional hits can be expected with: a) 10 mph increase in launch speed for popups (PU); b) 10 mph increase in launch speeds for groundballs (GB); c) slightly reduced launch angle contact, converting popups into line drives (PU to LD); d) slightly increased launch angle contact, converting groundballs into line drives (GB to LD); or e) groundballs hit at more favorable spray angles (GB Spray Angle)? Sensitivity studies assumed 10% of baseline events would be converted to the new hitter-friendly condition. Sensitivity study results are summarized as extra predicted hits in Figure 14 and the Table 3.
Increase in Popup Launch Speed: Popups hit harder just go up higher before they are caught. No attempt was made to model small changes in hit probabilities for popups at different launch speed, so the model predicts no extra hits for popups. In reality, launch speed could be a small benefit for a few popups that turn from popups to fly ball bloop singles.
Increase in Groundball Launch Speed: Groundballs hit harder were more likely to reach the outfield as hits. Figure 15 shows the hit probabilities for groundballs hit both 10 mph harder and 10 softer when the infield is not shaded. An increase of 10 mph raises hit probabilities in a few spray angle zones. If 10% of groundballs were hit 10 mph harder, this would lead to 443 extra hits per season, or 14.8 per team. This was only the second-best strategy to achieve extra hits, according to the sensitivity studies.

Popups Converted to Groundballs: Popups have the worst hit probability of all batted ball types (Table 2). Any reduction of the worst thing is a good thing. Converting 10% of the 8,490 popups, which have an average hit probability of .014, to infield line-drives which have an average hit probability of .724, would lead to 581 extra hits per season.
Groundballs Converted to Infield Line Drives: Since the vast majority of infield balls in play were ground balls—72.7%, as shown in Table 2—this option produced a significant jump in extra hits. The model predicted 2,407 extra hits per season. Line drives are a lovely path toward getting on base.
Groundballs Hit at More Favorable Spray Angles: We have finally come around to the “hit ’em where they ain’t” option. This option assumes the groundballs were hit at the median speed. The assumed favorable hit probability was .759 for left-handed hitters (balls hit at spray angles below -30 degrees), and .579 for right-handed hitters (balls hit at a spray angle zone of 2.5 degrees, between the middle infielders). The model predicted 2,039 extra hits per season. But is this path possible for MLB hitters today? Hit probabilities and groundball counts in each hit zone are provided in Figure 16. Lefties in particular pull most balls to spray angles greater than 15 degrees, where hit probabilities are terrible (the dashed box in Figure 16). Lefties hit relatively few balls the other way at spray angles below -30 degrees, where hit probabilities are great. For left-handers, the 6x benefit of hitting balls the other way comes not from hitting the ball exceptionally hard or into a precise zone, but hitting it to the left side avoiding only the lonely third baseman covering that side of the infield. The benefit for right-handed hitters is less obvious, but shifting any balls out of the poor hitting zone between 10 degrees and 35 degrees would produce more hits. The author knows hitting the ball the other way is difficult. But is it more difficult than hitting balls harder or turning popups and grounders into line drives? I expect Wee Willie would have a clear and concise answer to this question.

CASE STUDIES FOR ELITE MLB LEFT-HANDED HITTERS
Given a quantitative understanding of how batted ball type influences infield hit probabilities, the study now turns to individual hitters to assess how batted ball type and spray angle impact their predicted hits. I chose four elite left-handed hitters, but the study can be easily applied to other players, including right-handers. In 2023, Luis Arráez won the National League batting title with a .354 batting average, Freddie Freeman set a Dodgers record with 59 doubles, Matt Olson led all of MLB with 54 home runs, and Kyle Schwarber hit the longest home run of any player in the NL at 483 feet. Standard batting statistics and a breakdown of infield batted ball types are provided in Table 4.

Groundball distribution for different spray angle zones is provided in Figure 17. All hitters put a similar number of balls into the poor hitting zone above 15 degrees. Arráez was best at sending grounders up the middle and the other way.
A summary of groundball hits and groundballs in play for each batter is shown in Table 5. Grounders hit to the opposite field had a batting average of .407, compared to .310 for grounders up the middle and .141 for pulled grounders. This confirms again the benefit of hitting the ball toward favorable zones. The far-right column focuses only on grounders hit at a spray angle below -30 degrees, which have a batting average of .824. Though this is a small sample size and not an easy spot to put the ball, the rewards are considerable.
CONCLUSION
The obvious challenge is to hit line drives or grounders to more favorable spray angles without a significant reduction in power or an increase in strikeouts or popups. The author does not expect that any of these adjustments will be easy. Infielders will react to balls placed more frequently into favorable zones. So the hitter approach will need to evolve continually. But if a hitter better understands his own tendencies, how infielders defend against his tendencies, and the quantitative benefits of balls hit into favorable zones, he could end up with more hits. Even for exceptional hitters, directing more balls toward the most favorable hitting zones would be a path to extra hits; a strategy Wee Willie Keeler would have embraced.
DONALD SLAVIK is employed on an MLB grounds crew, where he brooms infield dirt, rakes/chalks baselines, prepares bullpens, and fluffs up the grass. He is happy he got past a rocky first practice tarp pull that rolled up his iPhone. Don grew up in Chicago and now lives in Cincinnati. He is an avid fan of the Chicago White Sox and Cincinnati Reds.
Acknowledgments
The author thanks reviewers Cindy Slavik, Jay Kelly, and the anonymous peer reviewers for invaluable feedback that made this a much better paper. The author also appreciates the helpful edits suggested by the BRJ editors. The author is also grateful to Professor Mehdi Norouzi’s class at the University of Cincinnati, Intro to Programing Python and R.
Notes
1 “Willie Keeler,” National Baseball Hall of Fame, accessed January 29, 2024, https://baseballhall.org/hall-of-famers/keeler-willie
2 “Major League Leaders,” FanGraphs, accessed January 29, 2024, https://www.fangraphs.com/leaders/major-league?pos=all&stats=bat&lg=al%2Cnl&type=23&season=2023&month=0&season1=1871&ind=0&team=0&rost=0&players=0&sortcol=5&sortdir=default&qual=1000&pageitems=50
3 “Good Advice by Willie Keeler,” Pittsburgh Press, March 25, 1904, 24, https://news.google.com/newspapers?id=7ggbAAAAIBAJ&sjid=rkgEAAAAIBAJ&pg=4433%2C1761576&dq=keep+your+eye+clear+hit+em+where+they+that%27s+all
4 Dave Sheinin, “These days in baseball, every batter is trying to find an angle,” Washington Post, June 1, 2017, https://www.washingtonpost.com/graphics/sports/mlb-launch-angles-story/
5 Tom Verducci, “How Banning Infield Shifts Will Change MLB,” Sports Illustrated, November 21, 2022, https://www.si.com/mlb/2022/11/21/banning-infield-shifts-impact
6 Anthony Castrovince, “Pitch timer, shift restrictions among the announced rule changes for 2023,” MLB.com, February 1, 2023, https://www.mlb.com/news/mlb-2023-rule-changes-pitch-timer-larger-bases-shifts
7 Jim Albert, “Chance of Hit as Function of Launch Angle, Exit Velocity, and Spray Angle,” Exploring Baseball Data with R, Jan 15, 2018, https://baseballwithr.wordpress.com/2018/01/15/chance-of-hit-as-function-of-launch-angle-exit-velocity-and-spray-angle/
8 Russell A. Carleton, “So You’ve Decided to Ban the Shift,” Baseball Prospectus, March 9, 2022, https://www.baseballprospectus.com/news/article/73029/baseball-therapy-so-youve-decided-to-ban-the-shift/
9 The search selections were: A) Player Type = Batter; B) IF Alignment = Standard, Strategic, and Shade; C) Season = 2023 Regular Season; and D) PA Result = Base Hit and all balls in-play except for sacrifices. This study focused on balls in play directly impacted by the infield alignment: hits, errors, and outs in the field. Although walks, strikeouts, and sacrifice outs could be indirectly impacted a small amount by the defensive alignment, they were not considered.
10 Baseball Savant limits output files to approximately 25,000 rows. Files were downloaded for each hit type to keep each file below the maximum limit. Individual files were then concatenated with Python code written by the author.
11 In this case the pitcher and catcher are considered infielders.
12 Figure 3 includes a single line drive out at 100.6 mph and -9 degrees. This was a groundball incorrectly tagged as a line drive. It was difficult to fully assess all points for data quality, but a total of one poorly tagged point out of 10,409 line-drive outs was representative of a very good system with few data errors.
13 Bill Petti, “Research Notebook: New Format for Statcast Data Export at Baseball Savant,” The Hardball Times, April 28, 2017, https://tht.fan-graphs.com/research-notebook-new-format-for-statcast-data-export-at-baseball-savant/
14 Separate median launch speeds were considered for left-handed and right-handed hitters, but this was a small effect and therefore not included in this evaluation.
15 Since the shade infield alignment was employed infrequently for righties, the approximate infielder position was not included in that plot.
16 Given there were very few line drives hit into the shade infield alignment for right-handed batters, a single model fit was derived for all infield configurations.
17 The infield alignment was a minor factor on the launch speed constant, so a single model fit line was developed for each case. The variation for right-handed hitters on grounders (Figure 9) and line drives (Figure 10) with the shade alignment is due to a small sample size.
APPENDICES
APPENDIX 1. WILLIE KEELER ORIGINAL SOURCE MATERIAL
APPENDIX 2. MODEL FIT CONSTANTS
Table A-1. Reference Launch Speeds (mph)

Table A-2. Popup Hit Average

Table A-3. Groundball References and Constants

Table A-4. Line Drive References and Constants
