

Assessing Hall of Fame Worthiness: Flaws in JAWS
This article was written by Benjamin Alter
This article was published in Fall 2022 Baseball Research Journal
This paper explores potential areas of improvement in the JAWS statistic and proposes an alternative for evaluating candidates for the Hall of Fame. In 2004, Jay Jaffe created the Jaffe WAR Score system (JAWS) based on Baseball Reference’s bWAR.1 Its stated purpose is “to improve the Hall of Fame’s standards, or at least to maintain them rather than erode them, by admitting players who are at least as good as the average Hall of Famer at the position.” JAWS averages a player’s career bWAR with the sum of the bWARs from his best seven seasons. This “peak” factor provides a counterbalance to the accumulation of statistics; players who only accumulated statistics through long careers have lower JAWS than similar players who dominated during their peak seasons. Players are grouped by position, enabling direct comparisons between a player and the average Hall of Famer at that position.2 Players are considered Hall-worthy if their JAWS exceeds that of the average Hall of Famer at that position.
While JAWS works very well in indicating who should be enshrined, it can be improved.
THE PROBLEM WITH DEFENSIVE WAR
Like bWAR, JAWS includes both oWAR and dWAR. How important is dWAR in determining Hall-worthiness?
Because some positions are more challenging than others, Baseball Reference assigns positional adjustments in its calculation of dWAR. Positions where good defensive skills can have a more-than-average effect on the outcome of a game have positive adjustments, and positions where good defensive skills have less of an effect on the outcome of a game have negative adjustments. By definition, these adjustments must add up to zero for a given season.
Positional adjustments vary over time. For the last several decades, shortstop and catcher have had big positive adjustments, while left field, right field, and first base have had big negative adjustments, with second base, third base, and center field somewhere in the middle.
To assess whether defensive metrics correlate with the likelihood of getting into the Hall of Fame, the author collected the dWARs and oWARS of all players with a minimum of 5,000 plate appearances (the de facto minimum for viable Hall of Fame candidates outside of the Negro Leagues), sorted them by position, and then divided them into quintiles. If better fielders preferentially get into the Hall of Fame, they would be prominently represented in the upper quintiles for dWAR, especially for the higher-valued defensive positions. Similarly, the better offensive players would be represented in the upper quintiles for oWAR, which does not have a positional adjustment. Let’s evaluate the data position-by-position, starting with catchers.
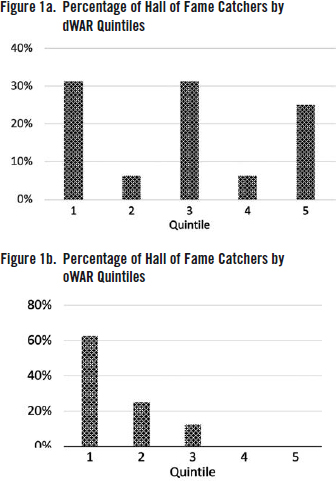
As shown in Figure 1a, the dWAR quintiles of catchers have no discernable pattern, with almost one-third of the Hall of Famers in the bottom two quintiles. On the other hand, there is a clear preference for offense among catchers, as shown in Figure 1b. Almost 90% of the Hall of Fame catchers are in the upper two quintiles, and none of them are in the bottom two quintiles. This implies that either no consideration is given to a catcher’s defensive performance when evaluating that player’s HOF candidacy, or defensive performance by catchers isn’t well measured by dWAR.
The quintiles for shortstops and second basemen tell a more nuanced story. As shown on Figure 2a, the dWAR quintiles for HOFers at these two positions are very similar, with more than half of the plaques going to top-fielding shortstops and second basemen, and less than one-quarter of the plaques going to shortstops and second basemen in the bottom two quintiles. While these results may suggest a consideration to defensive prowess for these two highly-valued positions, there is an even greater emphasis on offensive prowess at these two positions, as shown in Figure 2b. The top quintiles are occupied by 70% of the Hall of Famers at each position, with Bill Mazeroski being the only Hall of Famer in the fourth quintile and none in the lowest quintile. These results suggest that, while there is interest in the gloves of shortstops and second basemen, they also need to hit to make it into Cooperstown.
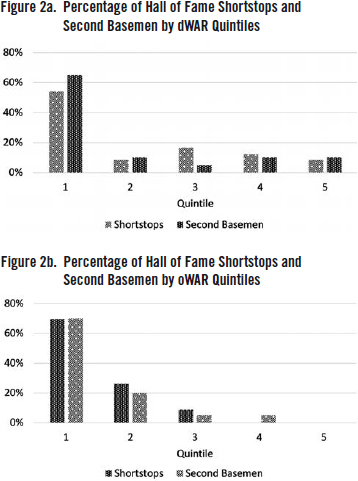
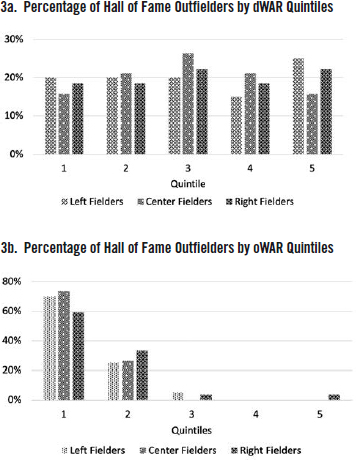
Figure 3a shows the dWAR quintiles for HOFers who were outfielders. It shows highly random distributions in dWAR for all three outfield positions, including center field, which has a positive positional adjustment. Therefore, there is no correlation at all between defensive metrics and being inducted into Cooperstown. As shown in Figure 3b, it’s pretty much all about the offense for outfielders, with all but four outfielders placing in the upper two quintiles.
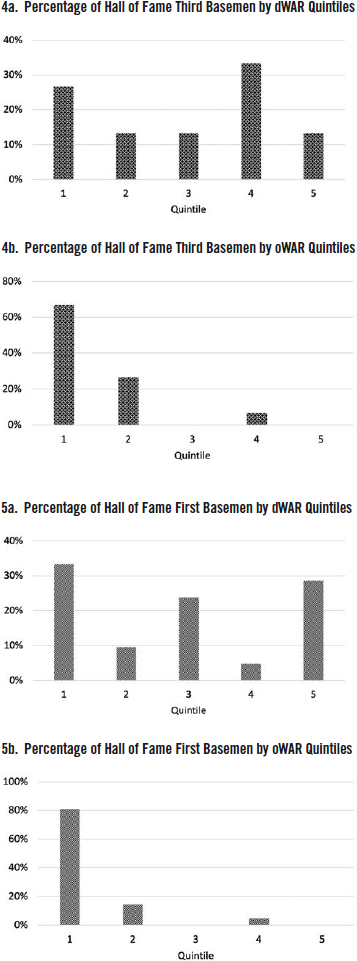
As shown in Figure 4a, not only do the dWAR quintiles for HOF third basemen have no discernable patterns, there are more Hall of Famers in the bottom two quintiles than in the top two quintiles. In contrast, except for Freddie Lindstrom, all third basemen enshrined in Cooperstown were top batsmen, as shown in Figure 4b.
As shown in Figure 5a, the dWAR quintiles for first basemen also show no preference towards defensive metrics, with close to 30% of Hall of Fame first basemen in the bottom quintile. In contrast, with just one exception (High Pockets Kelly), all first basemen in the Hall are in the upper two quintiles, as shown in Figure 5b. Only great-hitting first basemen get a plaque.
In summary, with the possible exceptions of shortstop and second base, and some individual exceptions, dWAR is a poor predictor of a player landing in Cooperstown. And since dWAR is an element of JAWS, this in turn casts doubt on the validity of JAWS as a predicting tool.
THE DIFFERENCE BETWEEN PRE-EXPANSION ERA AND EXPANSION ERA PLAYERS
DWAR is not the only problem with JAWS. There also is a problem with players from a wide range of eras being homogenized into a single statistic.
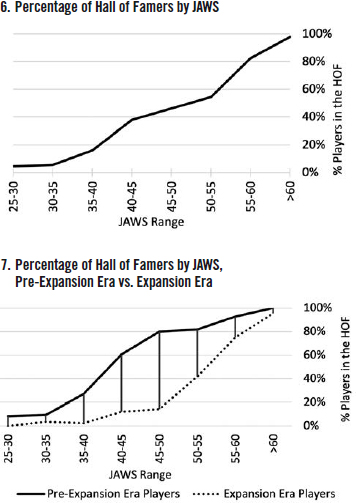
Figure 6 shows that there is a more or less linear relationship between increasing JAWS and increasing odds that the player is in the Hall of Fame. Players with JAWS below 40 have a less than 20% chance of being enshrined and therefore are “unlikely” candidates. Players with JAWS above 60 have a better than 80% chance of being enshrined and therefore are “likely” candidates. Players with JAWS between 40 and 60 are “uncertain” candidates. This is a very broad range. It is very broad because there is at least one other factor at work—the difference between playing before the Expansion Era and during the Expansion Era.
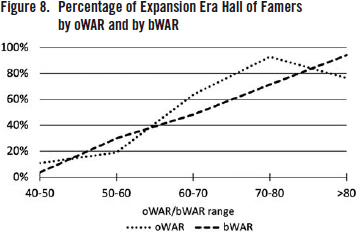
In Figure 7, the data from Figure 6 are separated into two categories: Pre-Expansion Era players and Expansion Era players.3 The JAWS distributions for these two sets of players are quite different, especially in the 40 to 55 JAWS range. Whereas pre-Expansion Era players become likely HOF candidates at 45 JAWS and virtual locks above 55 JAWS, Expansion Era players must have a JAWS at least in the high 50s to be likely candidates for Cooperstown.
The bifurcation between Pre-Expansion and Expansion Eras has many causes. While the 162-game season is 5% longer than the 154-game season, this difference is too small to be meaningful here. The even shorter seasons prior to 1904 also play a minor role, since there are comparatively few Hall of Famers from those early days. The careers of Pre-Expansion Era HOFers were, on the average, 0.8 years shorter than Expansion Era HOFers, and Pre-Expansion Era players had, on the average, 27% fewer plate appearances than their fellow HOF denizens from the Expansion Era. This factor seems to contribute to the bifurcation. That said, the most probable and significant cause for this bifurcation is that many pre-Expansion Era HOFers simply don’t have the same playing skill or merits as others in the Hall of Fame, but they are in the Hall nonetheless. (See Jaffe, The Cooperstown Casebook.)
Mixing pre-Expansion Era players with Expansion Era players lowers the bar for the Expansion Era players to an unrealistic level, a level not supported by the history of HOF enshrinement. JAWS would be a more useful barometer for its stated purpose if it had two averages per position —one for pre-Expansion Era players and one for Expansion Era players.
CAREER OWAR AS A BAROMETER OF HALL-WORTHINESS
Since dWAR is an unreliable barometer of Hall-worthiness, let’s ask the question: is oWAR by itself a reliable barometer for Cooperstown? What follows is an analysis of the Expansion Era dataset.
Figure 8 shows the trendlines for oWAR and bWAR among Expansion Era players. Defining 20% or less as an “unlikely” Hall of Fame candidate and 80% or more as a “likely” HOF candidate (excluding players whose candidacies are besmirched by PED accusations), the trendline for bWAR, which includes dWAR, has an uncertain range between 50 and 80, whereas the oWAR trendline has a much tighter uncertain range, between 60 and 70. This suggests that oWAR is a much better diagnostic tool than bWAR. Consequently, JAWS would be a better diagnostic tool for Expansion Era players if it was based only on oWAR for Expansion Era players.
In a play on words, let’s call the new metric “JoWLS”, the “Jaffe Offensive WAR Ledger System.” It would work similarly to JAWS in that a player’s JoWLS would entail averaging his career oWAR with the sum of his best seven oWARs. As with JAWS, the players would then be sorted by position and the average JoWLS for each position calculated for both eras. Let’s see what JoWLS would look like for Expansion Era players.
For this paper, JoWLS were calculated for all HOF-eligible (as of 2020), Expansion Era position players who had more than 5,000 plate appearances. The top 20 players in JAWS and in JoWLS have been identified and tabulated, and the two lists compared to each other.
There were only minor differences in the two lists for catchers, first basemen, left fielders, and right fielders, which is consistent with the oWAR and dWAR analysis for all players that was presented earlier in the paper. Tables 1 through 4 show the top 20 players in JAWS and JoWLS at the other four positions, with the Hall of Famers shaded in each table.
Table 1 lists the top 20 shortstops from the Expansion Era in both JAWS and JoWLS. One big difference between the two lists is Derek Jeter, who is at the top of the JoWLS list but is behind five other HOFers on the JAWS list due to his inferior fielding sabermetrics. His place on the JoWLS list is more consistent with his first-ballot induction into Cooperstown. In contrast, Ozzie Smith and Luis Aparicio fare far better in JAWS than JoWLS, which suggests that that their defense played a big part in their induction into the Hall. It is unlikely that they would have gotten into the Hall on their offensive stats alone. Cal Ripken, Jr. is a good example of a player who fares much better under JAWS than JoWLS but would still have gotten into the Hall on his offensive stats alone.
The JAWS and JoWLS rankings for second basemen have some significant differences. As shown in Table 2, Bobby Grich and Lou Whitaker, who received little or no support in their first year of HOF eligibility, are in the middle of the five HOFers on the JAWS table, but are just below them on the JoWLS table. Both players were excellent fielders: Grich with four Gold Gloves and the 8th highest dWAR among Expansion Era second basemen, and Whitaker with three Gold Gloves and the 9th highest dWAR among Expansion Era second basemen. Apparently, their defensive achievements did not sway the HOF voters. Conversely, Craig Biggio’s 3,000 hits appeared to have swayed the HOF voters despite his tepid defensive metrics (which do not jibe with his four Gold Glove awards).
In summary, there are some significant differences in JAWS and JoWLS for Expansion Era shortstops and second basemen. This result is consistent with the earlier analysis of oWAR and dWAR.
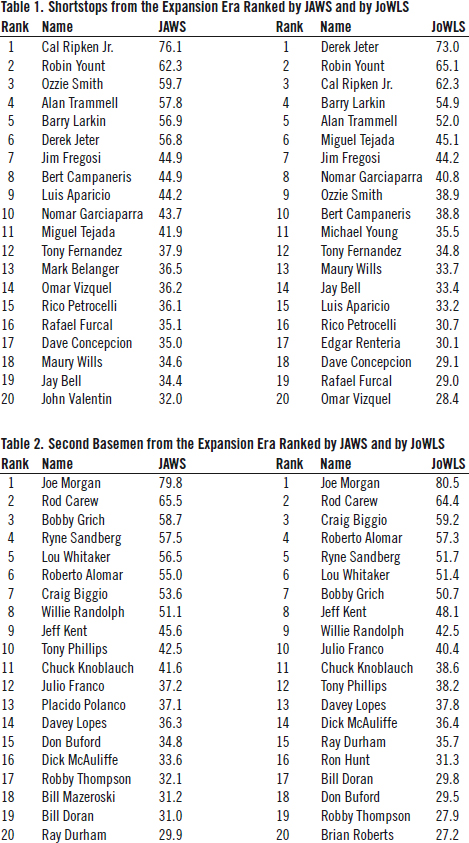
Table 3 lists the top 20 center fielders from the Expansion Era in JAWS and in JoWLS. Defensive prowess does not appear to have been an important consideration when evaluating center fielders for the Hall of Fame, with the possible exception of Andre Dawson, whose JAWS is much higher than his JoWLS. This may be changing, as evidenced by the candidacy of Andruw Jones, which has gained traction in recent voting. Jones has the highest dWAR in history for an outfielder, which may make him an outlier rather than a trendsetter. Nevertheless, if he gets into the Hall, he will be the first outfielder from the Expansion Era whose defensive prowess clearly played a major factor.
Table 4 shows the top 20 Expansion Era third basemen by JAWS and JoWLS. There are two major differences between the two tables: Brooks Robinson and Dick Allen. Unsurprisingly, Robinson fares well in JAWS, having by far the highest dWAR for a third baseman in baseball history. However, he is a weak candidate for the Hall without his defense in the equation. Poor defensive metrics may be keeping Dick Allen (dWAR of -16.3) out of Cooperstown. However, defensive metrics have not helped draw attention for Graig Nettles, whose JAWS is a hair below 55.7, which is the current JAWS average for third basemen. Defensive metrics may, however, be aiding the candidacy of Scott Rolen, the eight-time Gold Glove winner, who garnered 63.2% of the vote in 2022. Rolen would not be a serious candidate for the Hall based on his JoWLS.
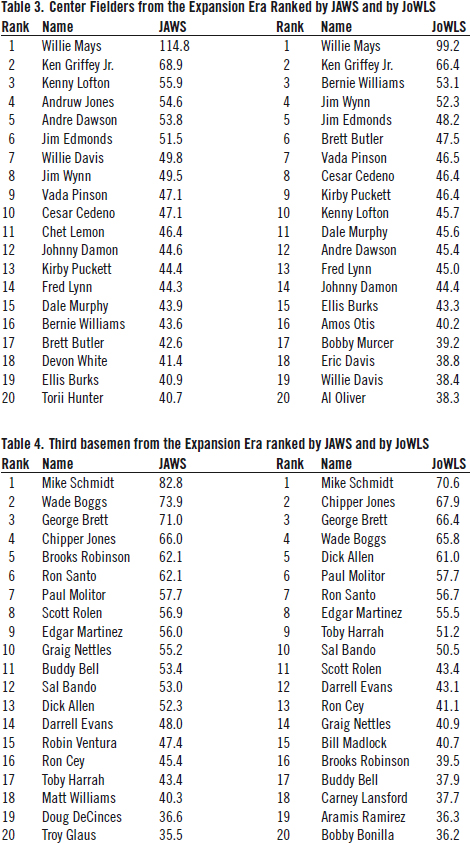
In conclusion, defensive metrics in HOF consideration appear to be important for third basemen, but the data are not consistent across the board.
CONCLUSIONS
To be a more reliable prognosticator of Hall-worthiness, JAWS should generate two averages per position: one for pre-Expansion Era players and one for Expansion Era players. While JAWS appropriately utilizes both offensive and defensive statistics, HOF voters generally do not, with but four or five exceptions (Ozzie Smith, Luis Aparicio, Brooks Robinson, and maybe Andre Dawson) from the Expansion Era.
Recent BBWAA votes have shown increased interest in players known for their superior defensive abilities whose offensive metrics may fall short of HOF consideration, including Andruw Jones and Scott Rolen. Inducting some or all of these players into Cooperstown would be a sign that the HOF voters are placing the appropriate value on defensive achievements, negating the need to use JoWLS in assessing the Hall-worthiness.
BENJAMIN ALTER is a life-long baseball fan and a long-suffering Mets fan who joined SABR in 2019. He is a member of the Negro Leagues committee and co-delivered a paper at the committee’s annual meeting in June 2022. He recently retired from a career as an environmental consultant and professional geologist. Mr. Alter authored a textbook on environmental consulting and was an adjunct professor in New York City for over a decade. He also is an avid amateur musician.
Sources
Baseball-Reference.com. Statistics last accessed on September 1, 2021.
Baseball-Reference.com. Position Player WAR Calculations and Details. https://www.baseball-reference.com/about/war_explained_position.shtml
Baseball-Reference.com. WAR Comparison Chart. https://www.baseball-reference.com/about/war_explained_position.shtml.
Baseball-Reference.com. WAR Explained. https://www.baseballreference.com/about/war_explained.shtml.
Jaffe, Jay, 2012. Jaffe WAR Score system (JAWS). Baseball-Reference.com.
Jaffe, Jay, 2017. The Cooperstown Casebook. St. Martin’s Press
Notes
1. Wins Above Replacement (WAR) is widely recognized as a useful metric for assessing a ballplayer’s overall performance. It allows each player’s performance to be compared to others’ around the playing field, across the years, and even across eras. Baseball Reference and FanGraphs have similar but different versions of WAR (bWAR and fWAR, respectively).
2. JAWS assigns players who played multiple positions to the position at which they earned the most bWAR over their careers, which sometimes is different from their most often-played position.
3. Players whose careers straddle the 1961–62 border were assigned to the era in which they earned more bWAR. Fifty-seven Hall of Famers are defined as Expansion Era players for the purpose of this paper.
4. HOFer Mazeroski occupies 18th place on the JAWS table and is not even on the JoWLS table, consistent with the evidence presented earlier in this paper that Maz should not be in the Hall of Fame. But note that Mazeroski was voted in by the Veterans Committee, not the BBWAA.
5. The difference between Dawson’s JAWS and his JoWLS suggests a strong defense component, but anecdotal evidence from his Hall of Fame plaque and other resources suggests that he was inducted primarily because of his offensive achievements.