
Astrodome Proves to Be No Hitters Park
This article was written by Paul Geisler Jr.
This article was published in The National Pastime: Baseball in the Space Age (Houston, 2014)
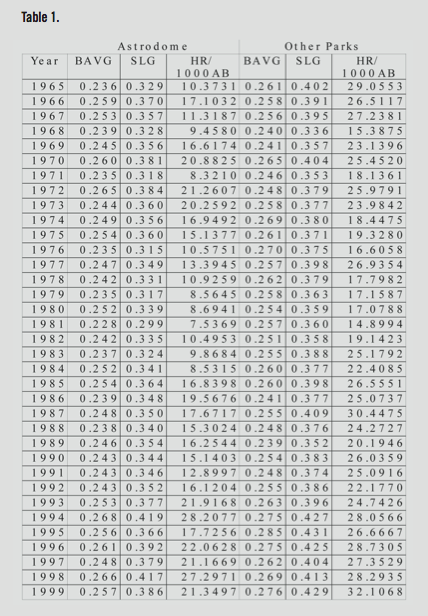
Long fences and “dead” indoor air gave Astrodome a reputation for being unfriendly to hitters. This analysis compares batting average, slugging percentage, and home run rate (home runs per 1,000 at-bats) for all Astros games at home (in the Dome) and on the road.Long fences and “dead” indoor air gave Astrodome a reputation for being unfriendly to hitters. This analysis compares batting average, slugging percentage, and home run rate (home runs per 1,000 at-bats) for all Astros games at home (in the Dome) and on the road. The Astros played the same teams at home as they did on the road, and the same players were involved in all of the games, in a roughly equal spread of home and road games.1 (See Table 1.)
Table 1

(Click image to enlarge.)
We begin with the null hypotheses that batting average, slugging percentages, and home run rates have equal means, and seek to determine in each case if the category proves to be significantly lower at the Astrodome than at other parks.
A two-sample t-test of batting average, assuming unequal variances, produces a “p” value of 4.8E-05— indicating at well over the 99% level that batting averages prove significantly lower in the Astrodome.
A two-sample t-test of slugging percentage, assuming unequal variances, produces a “p” value of 1.22E-06—indicating at well over the 99% level that slugging percentages prove significantly lower in the Astrodome.
A two-sample t-test of home run rate, assuming unequal variances, produces a “p” value of 4.17E-09— indicating at well over the 99% level that the home run rate proves significantly lower in the Astrodome.
All three categories show strongly significantly lower numbers for the games played in the Astrodome, compared to games on the road in other National League ballparks.
The Astros moved the outfield fences several times. During “shorter” years (1972–76 and 1985–99), foul lines (left and right, symmetrical) were 325 to 330 feet, “power” alleys (left and right, symmetrical) 375 to 380 feet, and center field 400 feet. During “longer” years (1965–71 and 1977–84), foul lines were 340 feet, power alleys 390 feet, and center field 406 feet.2 (See Table 2.)
Table 2
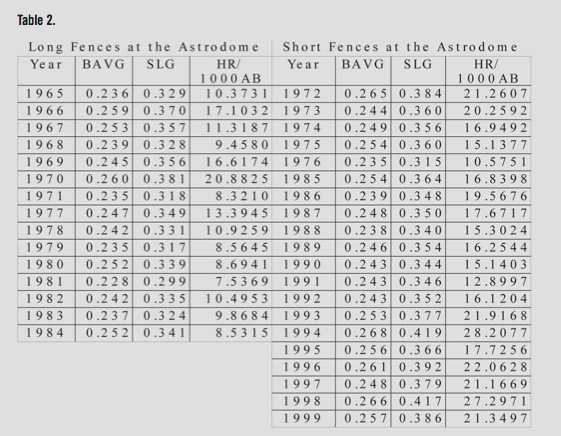
(Click image to enlarge.)
The difference of ten feet at the foul lines and power alleys and six feet in center field made a significant difference in batting production. A comparison of shorter and longer years in a manner similar to that above (t-test, assuming unequal variances) shows home run rate to be strongly significantly lower during the long-fence years, with a “p” value of 6.47E-06. Slugging percentage was also significantly lower, but not as strongly, with a “p” value of 0.011. Batting average was also lower, but not as significantly, with a “p” value of only 0.03.
When compared with other parks in the league, even the shorter-fence version of the Dome still was significantly worse for hitters when compared with the other parks, “p” values of 0.0034 for batting average, 0.00094 for slugging percentage, and 1.43E-05 for home run rate. And in every case, the home run rate showed the most significant difference between the Astrodome and other ballparks.
PAUL GEISLER JR. grew up in San Antonio, Texas, and has been a Lutheran pastor for over 35 years. He lives in Lake Jackson, Texas, with his wife Susan and their three children: Sarah, Brydon, and Johanna. He loves anything baseball—playing, watching, coaching, researching, and writing.
Notes
1 Statistics gleaned from http://www.retrosheet.org/boxesetc/H/PK_HOU02.htm. NOTE: 1997–99 includes an uneven number of games involving AL clubs.
2 http://www.baseball-almanac.com/stadium/astrodome.shtml.