

Calculating the Odds: Joe DiMaggio’s 56-Game Hitting Streak
This article was written by Peter Goodrich - Bob Brown
This article was published in 2003 Baseball Research Journal
A certain ballplayer, with a lifetime batting average of .280, is about to begin a 10-game road trip. What are the chances that, sometime during the 10-game span, he will “hit safely” in seven straight games? You probably haven’t given this question too much thought over the years.
Now, here’s one you have thought about (perhaps even lost a little sleep over): A lifetime .343 hitter, averaging 4.5 plate appearances a game (Joe DiMaggio’s career statistics through 1940), is about to begin a season in which he will play 139 games. What are the chances that, sometime during the season, he will “hit safely” in 56 straight games?
Hitting safely in 56 straight games is a lot like tossing 56 “heads” in a row. Since there’s only one way it can happen, the probability is easy to compute (in the case of the latter, 1/2 raised to the 56th power). A far more interesting question is this: If a fair coin is tossed 139 times, what are the chances that, sometime during the experiment, ”heads” will turn up 56 times in a row? How many ways can this happen? We really couldn’t tell you, but here’s one:
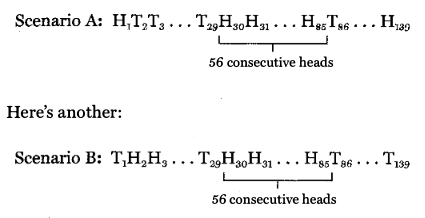
Notice that in both scenarios, the “run” of 56 heads begins at the same point, flip #30, but the two are not alike. For one thing, scenario A begins with a head, while scenario B begins with a tail. They end differently, too. There are so many different scenarios, in fact, we couldn’t begin to write them all down. And so it is with the “streak.” No one yet has been able to figure out how many different ways it could happen. And until someone does, we’ll never know how improbable it really was. (In case you’re wondering, DiMaggio’s 1941 season could have turned out in any one of 2139 totally different ways. That’s a 7 followed by 41 zeroes!)
Imagine our excitement, then, when not too long ago we ran across an article by Charles Blahous entitled “The DiMaggio Streak: How Big a Deal Was It?” (BRJ, 1994, pp. 41-43), where, in the space of a few paragraphs, the question seemed to have been answered once and for all.
Using a combination of probability theory and intuitive reasoning, he estimated the chances to be around .00134 (or, once every 746 years). Right away we knew something must be wrong. As proof, take a look at a normal distribution table and check out how much area falls under the curve to the right ofμ + 30, for all intents and purposes, the largest number in the distribution. It’s .00135.
So what Mr. Blahous is saying, essentially, is that DiMaggio’s streak has roughly the same chance of happening as an American-born male has of reaching a height of 6’4″ (tall, to be sure, but obviously, not one-of-a-kind tall). If it were really this likely, then it almost certainly should have happened, at the very least, a couple of more times, perhaps as many as four or five times total, in the past 100 years.
But it hasn’t. Know why? Because the streak is about as likely as seeing someone 7’4″ tall on the mound (as opposed to, say, Roger Clemens, who, though very tall at 6’4″, is fully one foot shorter). Any bets, now, on how long before it happens again? As a result of all this, we decided to take a look at how Mr. Blahous arrived at this figure. Let’s review it together.
How Big A Deal Was The Streak?
In figuring the odds, he turned his attention to the following:
1. When DiMaggio stepped up to the plate, what were his chances of getting a hit? Of not getting one?
Mr.Blahous used Joe’s 1941 batting average of .357 (though he probably should have used his lifetime mark of .325-or better yet, his ratio of hits to plate appearances, H+(AB+W) = 193+(541+76)=.313. After all, a walk is really no different than a flyout, a groundout, or a strikeout. It’s a wasted opportunity). His chances of not getting a hit are then 1-.357 = .643.
2. What constituted a “typical” game for DiMaggio in 1941?
Since Joe played in 139 games and had 541 “official” at-bats, a typical game for him that year would have been a game in which he got up to bat 3.89 times officially.
3. In a typical game, what were his chances of not getting any hits? Of getting at least one?
He handled this one by raising .643 to the 3.89 power (.179). He then subtracted this figure from 1 to get Joe’s chances of hitting safely in any game he played (.821).
4. What were his chances of hitting safely in 56 straight games?
.82156, or about .000016
5. How many opportunities did he have during the season to initiate a 56-game hitting streak?
The streak could have started on Opening Day, or the next day, or even as late as the 84th game. He then reasoned that since there were 84 ways to fit the streak into the season, the final probability must be .000016 times 84, or .00134.
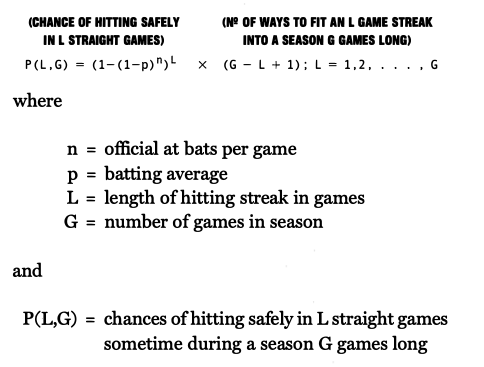
Now, all this seems reasonable (after all, .00134 is fairly small), but if Mr. Blahous had made just a few more calculations, he would have realized something was terribly wrong. To show this, we’ve taken the liberty of writing down a general formula for the procedure described above using the symbols n, p, L, and G (something Mr. Blahous should have done). The formula is:
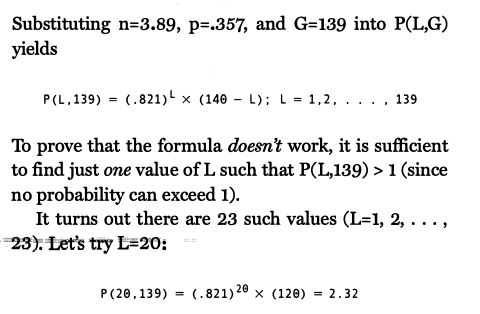
That’s 232%! Well, you know what they say. Nothing difficult is ever easy. But don’t take it so hard, Mr. Blahous. After all, you’re in good company. Nobody else has been able to solve the problem, either.
What Makes The Problem So Difficult?
The truth is, and there’s absolutely no way of getting around it, the only way to figure the chances that a ball player will hit safely in L straight games sometime during a season G games long is to (1) write down, literally, every possible way the hitting streak could come about (a formidable task even for relatively small values of G), (2) work out the chances that each of them will actually happen (easy, but time-consuming), and (3) add them all up.
As an example of what’s involved here, imagine that a season consists of merely G=10 games and that, at some point during the season, a certain player manages to hit safely in L=7 of them in a row. What are the odds? Well, on any given day, the player either gets a hit (or perhaps, more than one) — that is, he “succeeds” — or he does not — he “fails.”
Now, keep in mind that in a 10-game season, any one of 11 possible hitting streak lengths can happen. Even in a season this short, there are 1,024 totally different ways the season could turn out (2 raised to the 10th power), only 12 of which will result in a 7-game hitting streak. Imagine trying to write down all 1024 of them on paper. Unless you had a lot of time on your hands, you probably couldn’t do it. Table 1 shows the 12 possible ways the player could have put his seven-game streak together.
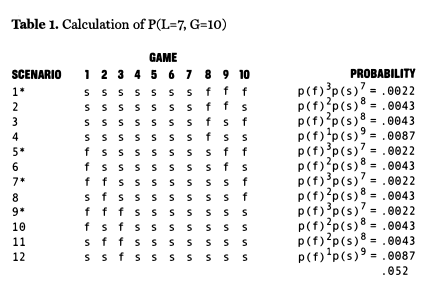
Assuming this player has some constant chance, say p(f), of going hitless in any one of these 10 games and, thus, some chance 1-p(f) = p(s) of coming away with at least one safely, then, by using what is known as the “multiplication rule for independent events,” we get the probabilities shown in the far right column.
To illustrate, let’s return for a moment to our hypothetical .280 hitter. Suppose his lifetime statistics are:
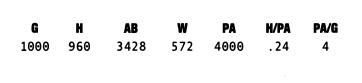
Each time he comes to bat (walks included), he has a 24% chance (960/4000) of getting a hit (or, equivalently, a 76% chance of not getting one). His chances, then, of going hitless in a typical 4-at-bat game? About 1 in 3 (.76 raised to the 4th). This leaves him with 2 chances in 3 of getting at least one hit (thus keeping the streak alive).
Making these two substitutions (that is, p(f) = 1/3 and p(s) = 2/3), we see that a .280 hitter has a bit more than 1 chance in 20 (.052) of hitting safely in 7 straight games sometime during a 10-game season. The 10 other hitting streak lengths, L=0, 1, 2, …, 6, 8, 9, 10, would account for the remaining 95%, or so, of the probability in the distribution. Not exactly easy, is it? And there’s no other way to do it.
The four scenarios in Table 1 that are marked with asterisks (nos. 1, 5, 7, and 9) are, according to Mr. Blahous, the only four ways a seven-game hitting streak can come about in a 10-game season. What he fails to realize, of course (and this is where he runs into trouble), is that what happens on either side of the streak, both before it ever begins as well as after it eventually ends, is every bit as important in figuring the overall probability as the length of the streak itself. In short, every game matters. Every single one of them.
But ignore them he does. Not to mention scenarios 2, 3, 4, 6, 8, 10, 11, and 12. How would Mr. Blahouse have figured the chances of such a streak? Using his (incorrect) methodology, he likely would have raised .6757 to the 7th power, then multiplied by 4:
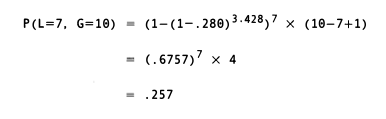
resulting in an answer about five times larger than the true probability.
Think about it logically for a minute. No math. Just plain, ordinary common sense. Could a .280 hitter have this much of a chance, better than one chance in four, of hitting safely in seven straight games sometime during a season only IO games long? With the available supply of probability limited to 100% (a supply that must be sufficient to cover all the outcomes possible, 11 in this case), how would so much of it be concentrated at one single point, a point that one would not ordinarily associate with having much of a chance to happen in the first place. Well, it couldn’t.
To begin with, he’ll probably only get hits in 7 games total, and it’s fairly unlikely that all 7 will come in a row. If he gets hits in 8 or 9 games, he’s got a better chance of hitting in 7 straight. Of course, if he gets hits in 6 games or less (or all 10), he’s got no chance whatsoever of accomplishing the feat. Where does this leave us? Hitting safely in seven straight games, particularly in a season this short, sounds awfully hard to do. Don’t you think? But if you’re still not convinced, there’s one more thing we can do.
A Simple Experiment: 1,000 Seasons With A Die
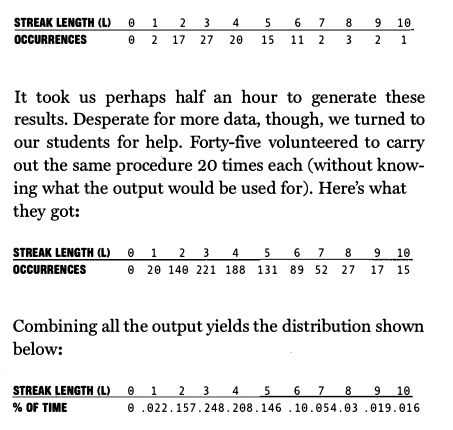
How about an experiment to settle the issue once and for all? Get a six-sided die. Toss it. If it turns up 1, 2, 3, or 4 (which it will 2/3 of the time), write down an s (for success). If it turns up 5 or 6, write down an f (for failure). Repeat 9 more times. Each 10-toss sequence (the equivalent of a 10-game season) will produce an L-value. Carry out the experiment 100 times. Keep track of how often L=0, 1, 2, …, 10. Here’s what we got:
Notice that:
- In 54 of the 1,000 seasons, his longest hitting streak was 7 games, within 2 of what we expected (and nowhere near the 250 or so Mr. Blahous would have predicted).
- He hit in every game 16 games, just one short of what we expected (found by raising 2/3 to the 10th power).
- He never had a hitless 10-game season (the chance of which .000017, is found by raising 1/3 to the 10th).
- Most of the time (in 248 seasons), the best he could manage was a 3-game hitting streak.
The most important thing we learned, however, was that the more we simulated, the closer the actual and theoretical results tended to be.
For example, after 100 seasons our .280 hitter had just two 7-game hitting streaks (about half of what we anticipated). He ended up, though with 54 such streaks in 1,000 seasons (a virtual bull’s-eye). This gave us an idea. Since we have no way of figuring out mathematically just how likely a 56-game hitting streak is, why not simulate a whole bunch of 139-game seasons, and keep track of how often it happens (just like we did above). That’s exactly what we decided to do.
Two problems immediately arose. First, we couldn’t possibly carry out the simulation by hand (a 10-game season is one thing; a 139-game season is quite another). Clearly, we would need the assistance of a computer. Second, since the probability of a hitting streak this long is so small, we’re obviously going to have to carry out the experiment a fairly large number of times in order to avoid making the kind of mistake that could easily ruin the investigation, namely, concluding that it can’t possibly happen simply because we never saw it happen. We know it’s going to. Eventually. On some kind of regular basis, too.
But how long before this happens? 5,000 runs? 10,000? 50,000? To be on the safe side (that is, in order to be absolutely certain we wouldn’t over- or underestimate the chances of such a streak), we decided to run the experiment a million times (10 trials of 100,000 runs each). Yes, that’s an awful lot, but we wanted to be sure.
The Simulation
In order to run the simulation, we only need to know one thing: Joe’s chances of hitting safely in any one of those 139 games. Rather than use his career statistics or his 1941 batting data alone, we decided to base our estimate on his performance covering the first five years of his career, 1936-1940.
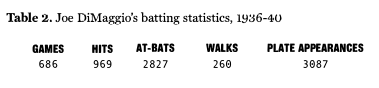
Though he averaged .343 over this period, his chances of getting a hit each time he came to the plate were only .314 (969/3087). Dividing 3,087 by 686, we see that he averaged exactly 4.5 plate appearances per game. Now, if we raise .686 (Joe’s chances of going ”hitless” each time he came to the plate) to the 4.5 power, we get his chances of going ”hitless” in a typical game. This yields .183. Thus, we estimate his chances of getting at least one hit in any one of those 139 games at around .817.
‘The simulation is straightforward and easy to carry out. It works like this: For each game, a three-digit number is drawn from a random numbers table (computer generated). If it falls anywhere between 000 and 816, this means DiMaggio “hit safely” in that day’s game (he gets an s). If it falls between 817 and 999, he went ”hitless” that day and gets an f.
On the first run (season #1), DiMaggio’s longest hitting streak was 17 games (games 65 through 81). After 13 runs (the actual length of Joe’s career), nothing longer than 23 straight. After 1,000 runs, still no streaks of any real co11sequence. After 5,000 runs, the longest streak we observed was 36 games (season #3,932). We were beginning to think it would never happen. Then on run 7,693, it finally did. A 59-game marvel covering games 29 through 87. If we had stopped simulating at this point, we would have given Joe one chance in 7,693 of hitting in 56 games or more consecutively. We kept going. After 10,000 runs, he had done it twice. After 50,000 runs, 15 times. After 100,000 runs, 23 times total, or once every 4,348 seasons. All the results are summarized below.
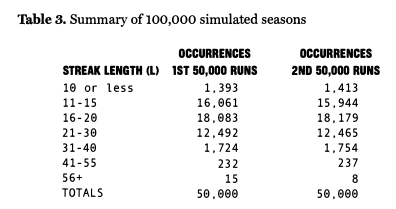
He hit in 56 straight just six times (Mr. Blahous would have predicted 134 such streaks). His shortest streak was seven games (achieved 25 times); his longest, a mind-boggling 70. About two out of every three streaks fell between 11 and 20 games in length-better than 93% between 11 and 30. The entire batch averaged out to 18.70 with a standard deviation (sd) of 4.77, meaning what happened in 1941 is equivalent, more or less, or reaching into the adult American male population and pulling out someone 3″ taller than “Shaq” (not someone merely 6’4″, which would have put him in the extreme right-hand tail of a normal distribution, but someone fully 8 sd’s taller than the average man). It shouldn’t have happened. And probably won’t ever again. No matter how many times you repeat the experiment.
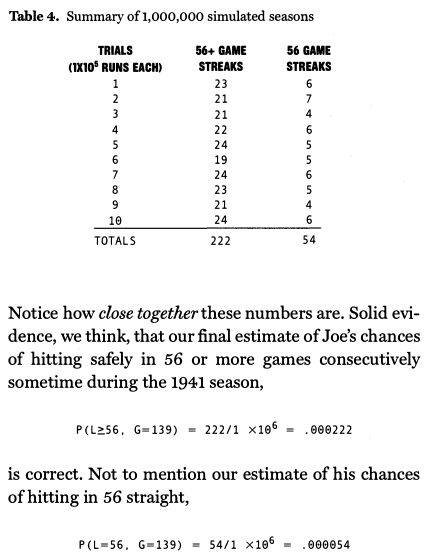
Thrilled with our results, but wondering whether 23 “successes” in 100,000 runs was typical or not, we decided to repeat the experiment. Not surprisingly, we didn’t get 23 the second time around. We got only 21. Since there was some variation, we thought, what the hell, let’s keep going and see what happens. So we tacked on 800,000 more runs (bringing the grand total to one million 139-game seasons). Don’t laugh. It took a long time. Here are the results:
Summary
Mr. Blahous sums up by saying, “What all this means is that DiMaggio, given his .357 batting average and the at-bat chances that he received, did something that he shouldn’t have been expected to do unless he hit that way for 1,038 years.”
Well, we’re not sure where this figure comes from (it’s actually closer to once every 18,519 years), but we are sure of this: what DiMaggio did in 1941 has no chance, realistic or otherwise, of ever happening again. No one’s seriously approached the record in 60 years (not even Rose).
Want a comparison? In 1884, “Old Hoss” Radboum (playing for Providence, who else?) started 73 games, completed all 73, and won 60 of them. In his career, he started 503 games and failed to go the distance only 14 times. Must have been a real “horse,” huh? Weighed 168, 15 pounds less than Gene “Stick” Michael.
But the point we want to leave you with is this: there isn’t one person on the face of the earth who thinks these records will ever be broken. It’s the same thing with DiMaggio’s 56-game hitting streak. It’s here to stay.
PETER GOODRICH, a 1957 New York Giants batboy, and BOB BROWN, a lifelong Giants fan, who grew up just blocks from the Polo Grounds, now teach courses in statistics and strategic management at Providence College.