Caught Looking: How Responsible Are Pitchers For Called Strikes?
This article was written by Connelly Doan
This article was published in Spring 2022 Baseball Research Journal
The strikeout is one of the few outcomes ascribed to a pitcher’s control, as indicated by metrics such as Fielding Independent Pitching (FIP) and Skill-Interactive Earned Run Average (SIERA). However, overall pitcher success is typically attributed to generating swinging strikes1—without considering the ability to induce called strikes. Although discussions around called strikes from the pitcher’s perspective are infrequent, discussions about other actors’ perspectives, including the umpire and catcher, are abundant within the baseball community. Technology has been working its way into baseball over recent years, and one feature that has been debated and tested has been introducing an electronic strike zone to reduce human error in called balls and strikes.2 Further, general conversations and specific metrics have advanced around called strikes from the catcher’s perspective in the form of pitch framing, implying that the catcher holds an important role in inducing a called strike.3,4
While a large proportion of called-strike analyses have been from perspectives other than the pitcher, there have been several useful developments directed towards understanding pitchers’ contributions. A Called Strike Above Average (CSAA) metric now exists on Baseball Prospectus, which identifies the additional called strikes created by a particular pitcher in relation to the average among all pitchers.5 Additionally, Alex Fast and Nick Pollack of Pitcher List developed a Called Strikes + Whiffs (CSW) metric in an attempt to understand a pitcher’s value beyond the proportion of swinging strikes they generate.6
These more nuanced metrics can help us understand called strikes from beyond the outcome seen from a singular, non-pitcher perspective. Relatively little has been done in terms of attempting to isolate how much each actor (pitcher, catcher, umpire) contributes to a called strike.7 This paper will add to these analyses by studying pitch-level data from 2015 through 2019. Using logistic regression, the effect of the pitcher, catcher, and umpire on a given taken pitch will be measured in relation to the probability of that pitch being called a strike. Not only will this analysis help create a more complete understanding of how each party influences a called strike, but it will also shed light specifically on how a pitcher affects the generation of a called strike.
DATA OVERVIEW
The raw pitch-by-pitch data for this article were scraped from MLB’s BaseballSavant.com using RStudio code and packages based on Bill Petti’s BaseballR.8 Specifically, the raw data comprised pitch-level events from every game of the 2015 season through the 2019 season where the pitch outcome was either a ball or a called strike. Each pitch outcome also included the pitcher who threw the pitch, the catcher behind the plate, and the home-plate umpire, along with other descriptive features. Pitcher and catcher CSAA data were taken from Baseball Prospectus.9
The data were then filtered for adequate sample sizes. Data were only included for: catchers with at least 500 framing chances in a given season, umpires with at least 500 called-strike chances in a given season, and pitchers who pitched at least 100 innings in a given season. The decision to limit the data to pitchers who threw at least 100 innings in a given season was determined considering the varying overall strike rates for starters and relievers; the standard for a strong strike rate for a starting pitcher is different from that of a relief pitcher.10 The role and definition of a starting pitcher has changed over recent years with the introduction of openers and nominal starters being used as long-relief pitchers,11 hence the decision to use 100 innings pitched as the cutoff, rather than a slightly higher mark.
VARIABLES AND DATA MODEL
Because the goal of this analysis was to understand how each actor individually impacts the probability of a called strike, a fixed-effects logistic regression model was implemented. The dependent variable was measured as a dichotomous variable, whether or not the taken pitch was called a strike. Several control variables were also included. The count of the particular pitch was included, as research has shown that the general probability of called strikes varies in different counts.12 Same pitcher-batter handedness was included to account for potential relative obscurity of the umpire’s view of a pitch. An umpire may be able to see a pitch more clearly depending on the handedness of the pitcher in relation to the batter, which could give the umpire more confidence in calling the pitch a strike.13
The pitcher’s and catcher’s individual impact was measured using Baseball Prospectus’s respective CSAA metrics. Practically, the catcher CSAA metric captures a catcher’s pitch-framing ability, while the pitcher CSAA metric captures a pitcher’s level of command, or the ability to precisely locate pitches, in or out of the strike zone, with the goal of keeping pitches out of the middle of the plate.14 These CSAA metrics were calculated using a mixed-effects model in order to isolate the most likely individual contributions of each actor, while controlling for their relative effects on each other.15 The home-plate umpire’s individual impact was measured using each umpire’s called-strike percentage on eligible pitches in a particular season. If the umpire’s called-strike percentage fell above the third quartile of data, they were labeled a generous umpire; if the umpire’s called-strike percentage fell below the first quartile of data, they were labeled a tough umpire.
The model used can be represented by the formula:
Y= β0 +σ βkXk+ β1X1 + β2X2 + β3U1 + β4U2
where Y is the probability of an eligible pitch being called a strike. β0 is the constant intercept, in this case the log odds of an eligible pitch being called a strike in a different-handed pitcher-batter matchup in a 0-0 count with a league-average pitcher, catcher, and home-plate umpire. Effects of k control variables are denoted by σ βk. β1 is the coefficient of a pitcher with a CSAA of X1, and β2 is the coefficient of a catcher with a CSAA of X2. β3 is the coefficient of having a tough umpire behind the plate, and β4 is the coefficient of having a generous umpire behind the plate.
RESULTS
Descriptive Statistics
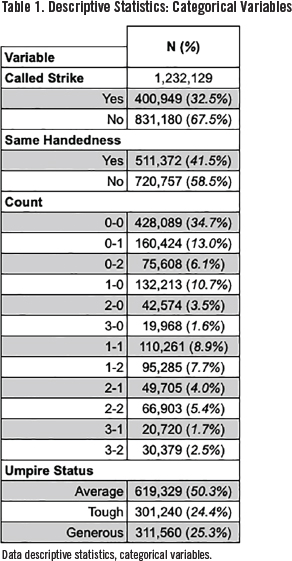
Tables 1 and 2 present descriptive statistics for the categorical and continuous variables in this analysis.
(Click images to enlarge)
Approximately one-third of the 1.2 million pitches in this dataset were called strikes, with 41.5% of those pitches occurring in same-handed pitcher-batter matchups. Approximately one-third of the pitches occurred in a 0-0 count, with an overall larger percentage of called-strike-eligible pitches occurring in earlier counts. Umpire called-strike data were normally distributed; as such, roughly one-quarter of the pitches occurred with a generous home-plate umpire, one-quarter with tough umpires, and half with average umpires.
Both pitcher and catcher CSAA showed similar distributions; the average pitcher CSAA was 0.003196 with a standard deviation of 0.010191, while the average catcher CSAA was 0.003028 with a standard deviation of 0.012168.
Model Results
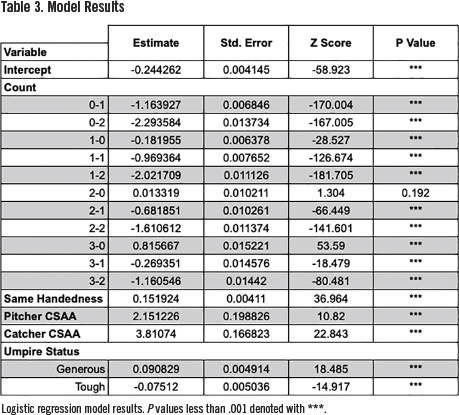
Table 3 presents the intercepts, standard errors, Z scores, and P values for the logistic regression model. Logistic regression centers around log odds, as using log-odds results in symmetry around zero.
(Click image to enlarge)
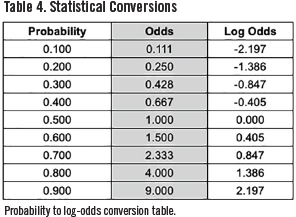
Table 4 shows some conversions of probabilities to log odds for reference.16
(Click image to enlarge)
The constant intercept value of -0.244 is the log odds of an eligible pitch being called a strike in a different-handed pitcher-batter matchup in a 0-0 count with a league-average pitcher, catcher, and home-plate umpire. All counts except 2-0 had statistically significant log-odd coefficients; indicating that, controlling for all other variables, all counts other than 2-0 affected the probability of a taken pitch being called a strike. The count with the largest impact on increasing the log odds of a called strike was 3-0. Counts with the largest impact on decreasing the log odds of a called strike were 0-2, 1-2, and 2-2. While other research has been done on the size of the strike zone in different counts or for particular types of pitches, this article focused on the impact of each actor in the generation of a called strike; the impact of the count simply groups the recorded outcome of each pitch in general (ball or called strike).17
The log-odds coefficient for same-handedness (0.152) was statistically significant, indicating that, controlling for all other variables, having a same-handed pitcher-batter matchup slightly increased the probability of a taken pitch being called a strike.
The log-odds coefficients for pitchers (2.151) and catchers (3.811) were both statistically significant. This indicates that, controlling for all other variables, each one-unit increase in pitcher CSAA increased the log-odds of a taken pitch being called a strike by 2.151. Likewise, controlling for all other variables, each one-unit increase in catcher CSAA increased the log-odds of a taken pitch being called a strike by 3.811.
The log-odds coefficients for having a tough umpire behind the plate (-0.0751) and a generous umpire behind home plate (0.0908) were both statistically significant. This indicates that, controlling for all other variables, having a tough umpire slightly decreased the probability of a taken pitch being called a strike. Likewise, controlling for all other variables, having a generous umpire slightly increased the probability of a taken pitch being called a strike.
DISCUSSION
Overview
A logistic regression model was run using data from roughly 1.2 million taken pitches from the 2015 through 2019 seasons to understand how various factors and actors impact the probability of a pitch being called a strike. All counts except 2-0 had a statistically significant impact on the probability of a taken pitch being called a strike. The probability of a called strike increased in 3-0 counts, while all other counts exhibited a decrease in the probability. These results match previous research on the changing of called strike zones in different counts.18 Additionally, taken pitches in same-handed pitcher-batter circumstances had a higher probability of being called a strike compared to different-handed matchups. This suggests that umpires may be more comfortable viewing the delivery of a pitch if the pitcher is releasing the ball on the same side of the plate as the batter. The result aligns with research that suggests a bias is held towards calling outside pitches strikes given how umpires set up behind the plate, particularly in same-handed pitcher-batter matchups.19
Regarding the actors involved, catchers had the most influence over the probability of a taken pitch being called a strike. Specifically, the log-odds coefficient for catcher CSAA was roughly 75% greater than that of pitcher CSAA. However, pitchers also had a sizable influence over the probability of a taken pitch being called a strike. While this result may not be surprising to some, it supports the assertion that pitch framing alone is not the sole factor in generating called strikes; a pitcher’s command plays a non-trivial role as well. Further investigation and discussion around pitchers’ contributions to generating called strikes should continue. As for umpires, having either a tough umpire or generous umpire (based on called-strike percentages) behind the plate affected the probability of a taken pitch being called a strike, with tough umpires decreasing the probability and generous umpires increasing the probability. The relative effect of generous umpires was slightly more than tough umpires; meaning that the increase in probability of a called strike with a generous umpire was greater than the decrease in probability of a called strike with a tough umpire.
Limitations
Several limitations exist in this analysis. First, batters were not considered in this model. It is clear that the batter is an actor in the generation (or not) of a called strike, and some research has been conducted in terms of showing the effect the batter may have.20 However, data capturing a batter’s independent impact on a taken pitch being called a strike are not currently publicly available. Further, a clear explanation for how a batter impacts such an outcome is not as obvious as that of a pitcher, catcher, or umpire. The pitcher’s impact can be attributed to their command, the catcher to their pitch framing, and the umpire to the fact that they are in charge of making the call. A number of possible explanations could be attributed to the batter, such as stance or location to home plate, their height, individual swing mechanics, general reputation as a player, and plate discipline, etc.21 It would make sense to attempt to capture the batter’s effect in a model only if said effect could be fully understood and explained.
The second limitation was the level of nuance of the metric used to represent the effect of the umpire. Ideally, an umpire CSAA metric (similar to the pitcher CSAA and catcher CSAA metrics used)22 would be publicly available for usage. However, such a metric is not present on Baseball Prospectus. That being said, the effect of the umpire was still captured adequately in the model for the purposes of this analysis.
NEXT STEPS
This article provides support that pitchers are an important actor in the generation of called strikes, and that further investigation, much like that of understanding pitch framing for catchers, would provide valuable insight. In that vein, there are several logical avenues of study that could follow this article.
The first could be a deep dive into better understanding why pitchers have the level of command that they do. In other words, it would make sense to attempt to understand what characteristics pitchers with high CSAA possess and the same for pitchers with low CSAA. Characteristics of interest could include velocity, pitch spin rate, handedness, and arm angle or delivery mechanics.23 Analyzing which aspects of pitching a pitcher can improve upon to maximize their effectiveness—beyond swinging strikes or “raw stuff”24—would allow for better theoretical understanding and practical results.
The second could be the investigation of the relationship between a pitcher’s ability to generate swinging strikes and their ability to generate called strikes. Little has been done in terms of analyzing a pitcher’s overall value in terms of generating both called and swinging strikes, other than the recent introduction of the CSW metric.25 This is not surprising, as pitchers who have the ability to make batters miss with high velocity or devastating breaking pitches (such as Randy Johnson, Clayton Kershaw, Aroldis Chapman, etc.) make a greater impression than those who have the ability to pitch around batters with strong command (such as Jamie Moyer, Kyle Hendricks, etc.). The relative lack of analyses on pitchers impacting called strikes was the motivation behind this article, so it would make sense to attempt to understand how valuable that aspect of a pitcher’s game is in relation to other aspects.
CONNELLY DOAN, MA is a data analyst in Las Vegas who has applied his professional skills to the game of baseball, both personally and for RotoBaller.com. He has been a SABR member since 2018. He can be reached on Twitter (@ConnellyDoan) and through email (doanco01@gmail.com).
Notes
1. Jarad Evans, “Sabermetrics Glossary: Swinging Strike Rate,” FantasyPros, February 4, 2020, accessed February 27, 2022. https://www.fantasypros.com/2020/02/sabermetrics-glossary-swinging-strike-rate.
2. Mark T. Williams, “MLB Umpires Missed 34,294 Ball-Strike Calls in 2018: Bring on Robo-umps?” BU Today, April 8, 2019, accessed February 27, 2022. https://www.bu.edu/articles/2019/mlb-umpires-strike-zone-accuracy; and Mhatter106, “Out of the Frame: The Effect of an Electronic Strike Zone on Catching,” Crawfish Boxes, SB Nation, November 19, 2019, accessed February 27, 2022. https://www.crawfishboxes.com/2019/11/19/20960632/out-of-the-frame-the-effect-of-an-electronic-strike-zone-on-catching-framing-robo-umps-robot-umpires.
3. Harry Pavlidis, “You Got Framed: A New Metric Reveals Just How Valuable an Artful Catcher Who Can Turn a Borderline Pitch into a Called Strike Can Be,” ESPN: The Magazine, June 27, 2014, accessed Februray 27, 2022. http://www.espn.com/espn/feature/story/_/id/11127248/how-catcher-framing-becoming-great-skill-smart-teams-new-york-yankees-espn-magazine; and Mike Axisa, “Pitch-Framing Might Soon be a Los MLB Art: But it Could Still Matter for These Pitchers and New Battery Mates,” CBS Sports, May 20, 2020, accessed February 27, 2022. https://www.cbssports.com/mlb/news/pitch-framing-might-soon-be-a-lost-mlb-art-but-it-could-still-matter-for-these-pitchers-and-new-battery-mates.
4. Jared Cross, “FanGraphs Pitch Framing,” FanGraphs, March 20, 2019, accessed February 27, 2022. https://blogs.fangraphs.com/fangraphs-pitch-framing/; and Jonathan Judge, Harry Pavlidis, and Dan Brooks, “Moving Beyond WOWY: A Mixed Approach to Measuring Catcher Framing,” Baseball Prospectus, February 5, 2015, accessed February 27, 2022. https://www.baseballprospectus.com/news/article/25514/moving-beyond-wowy-a-mixed-approach-to-measuring-catcher-framing.
5. Harry Pavlidis, Bret Sayre, Jonathan Judge, and Jeff Long, “Prospectus Feature: Command and Control,” Baseball Prospectus, January 23, 2017, accessed February 27, 2022. https://www.baseballprospectus.com/news/article/31022/prospectus-feature-command-and-control.
6. Alex Fast, “CSW Rate: An Intro to an Important New Metric,” PitcherList, April 16, 2019, accessed February 27, 2022. https://www.pitcherlist.com/csw-rate-an-intro-to-an-important-new-metric/; and “Glossary,” PitcherList, accessed February 18, 2021. https://www.pitcherlist.com/glossary.
7. Joe Rosales and Scott Spratt, “Who is Responsible for a Called Strike?” MIT Sloan Sports Analytics Conference, February 27, 2015, accessed February 27, 2022. https://global-uploads.webflow.com/5f1af76ed86d6771ad48324b/5fee08a3148d166c54a09645_1036_rppaper_Sloan%20Analytics%202015%20-%20Who%20Is%20Responsible%20For%20A%20Called%20Strike.pdf.
8. “Baseballr: A Package for the R Programming Language,” baseballr, last modified May 13, 2020, accessed February 27, 2022. http://billpetti.github.io/baseballr.
9. “Custom Statistic Report: Catcher Stats—Full Season,” Baseball Prospectus, last modified September, 30, 2019, accessed February 27, 2022. https://legacy.baseballprospectus.com/sortable/index.php?cid=2519121; and “Custom Statistic Report: Pitcher Season,” Baseball Prospectus, last modified September, 30, 2019, accessed February 27, 2022. https://legacy.baseballprospectus.com/sortable/index.php?cid=2863159.
10. Fast.
11. J.J. Cooper, “Are ERA Qualifying Standards Becoming Obsolete?” Baseball America, March 5, 2018, accessed February 27, 2022. https://www.baseballamerica.com/stories/are-era-qualifying-standards-becoming-obsolete.
12. Max Marchi and Jim Albert, Analyzing Baseball Data With R (Florida: Taylor and Francis Group, 2013), 181-84; and John Walsh, “The Compassionate Umpire,” The Hardball Times, April 7, 2010, accessed February 27, 2022. https://tht.fangraphs.com/the-compassionate-umpire.
13. TC Zencka, “Which Pitchers Should Fear Robot Umpires?,” MLB Trade Rumors, April 18, 2020, accessed February 27, 2022. https://www.mlbtraderumors.com/2020/04/which-pitchers-should-fear-robot-umpires.html.
14. Pavlidis, Sayre, Judge, and Long.
15. Judge, Pavlidis, and Brooks.
16. James Jaccard, Interaction Effects in Logistic Regression (California, Sage Publications, 2001).
17. Matthew Carruth, “The Size of the Strike Zone by Count,” Fangraphs.com, December 18, 2012: https://blogs.fangraphs.com/the-size-of-the-strike-zone-by-count/; Bill Petti, “Getting Strikes on the Edge,” Fangraphs.com, July 15, 2013: https://blogs.fangraphs.com/getting-strikes-on-the-edge.
18. Walsh; and Marchi and Albert.
19. Camden Kay, “The Inherent Umpire Bias,” Balk It Off, July 31, 2020, accessed February 27, 2022. https://medium.com/balk-it-off/umpire-bias-8e5b776ae1b0.
20. Judge, Pavlidis, and Brooks; and Rosales and Spratt.
21. Regarding player height, see Travis Sawchik, “Aaron Judge is Hitting Even Better with an Even Worse Strike Zone,” Fangraphs.com, May 17, 2018: https://blogs.fangraphs.com/aaron-judge-is-hitting-better-with-an-even-worse-strike-zone.
22. Judge, Pavlidis, and Brooks.
23. Zencka.
24. Pavlidis, Sayre, Judge, and Long.
25. Fast.


