

Clutch Hitting and the Cramer Test
This article was written by Phil Birnbaum
This article was published in 2008 Baseball Research Journal
Bill James recently asserted that Dick Cramer’s famous 1977 clutch-hitting study, which purportedly demonstrated that clutch talent is a myth, was fatally flawed. James argued that the study’s finding that year-to-year clutch hitting looks random was not enough to show nonexistence. Here, the author uses statistical methods to try to determine whether James’s argument is indeed correct.
In the Baseball Research Journal in 1977, Dick Cramer published a now classic study on clutch hitting. He looked at the best clutch hitters in 1969 and found that, on average, they reverted to normal in 1970. Cramer concluded that, since the 1970 performances looked random, the lack of persistency showed that the 1969 performance was simply random luck and, therefore, that clutch hitting as an ability does not exist.
Twenty-seven years later, in the same publication, Bill James disputed Cramer’s conclusion. In his essay “Underestimating the Fog” (critiqued by Jim Albert in By the Numbers 15, no. 1, February 2005), James wrote that
random data proves nothing—and it cannot be used as proof of nothingness. Why? Because whenever you do a study, if your study completely fails, you will get random data. Therefore, when you get random data, all you may conclude is that your study has failed. [emphasis in original]
This is certainly false. It is true that, when you get random data, it is possible that “your study has failed.” But it is surely possible, by examining your method, to show that the study was indeed well designed and that the random data does indeed reasonably suggest a finding of no effect.
But you have to look at the specifics of the study. For some studies, you’ll find that the study has indeed “failed”—that, even if a substantial effect existed, the study would still have found random data. But, contrary to Bill James’s assertion, many studies will indeed be powerful enough to find a relationship if one exists—and, for those, a finding of random data is powerful evidence of a noneffect.1
THE CRAMER TEST
Cramer’s study took 122 players who had substantial playing time in both 1969 and 1970. He ran a regression on their 1969 clutch performance versus their 1970 performance. Finding a low correlation, he concluded that clutch performance did not repeat and that clutch ability was not shown to exist.
James disputes this result, writing that “it is simply not possible to detect consistency in clutch hitting by the use of this method.” Is this correct? If clutch hitting were a consistent skill, would the Cramer test have been powerful enough to pick it up?
To check, I repeated a variation of Cramer’s study for the 1974 and 1975 seasons. For each of the 137 players having at least 50 “clutch” at-bats both years,2 I calculated, for both years, the difference between his batting average in clutch situations and his batting average in non-clutch situations. I then ran a linear regression on the 1974 versus 1975 data.
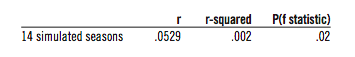
The results: a correlation coefficient (r) of .0155, for an r-squared of .0002. These are very low numbers; the probability of the f-statistic (that is, the significance level) was .86. Put another way, that’s a 14 percent significance level—far from the 95 percent we usually want in order to conclude there’s an effect.
So this study reaches the same preliminary conclusions as Cramer’s—players with good (or poor) clutch hitting in 1974 showed no tendency to repeat in 1975. Standard statistical operating procedure would have us conclude that there’s no evidence of a clutch effect.
But does this constitute good evidence that clutch hitting does not exist? We can’t answer that question yet. It could be that the study simply isn’t strong enough to find such an effect if it exists. If that’s the case, then, as James suggested, we’d get random data whether an effect existed or not, and the study could be said to be a failure.
But not a complete failure. What the study does clearly tell us is the relationship between a player’s 1974 performance and his 1975 performance. It tells us that relationship is very weak.
We may not be able to say for sure, yet, that the statement “clutch-hitting talent exists” is false. But the statement “Because Wade Boggs hit 110 points better in the clutch in 1989, he must be a good clutch hitter” is definitely false, because we have shown that, even if clutch hitting exists, there is no season-to-season consistency.
Specifically, the correlation coefficient of .0155 tells us that, if a player were X standard deviations above average in 1974, he would be expected to be only 1.55 percent of X standard deviations above average in 1975. Roughly speaking, a player who was 110 points above average in 1974 would be about 2 points above average in 1975.
Yes, this study has not necessarily proven that clutch hitting doesn’t exist. But it does show that, if clutch hitting did exist in 1974–75, it was in very, very small quantities.
OTHER YEARS
I repeated this study for all pairs of years from 1974 through 1990 (excluding pairs involving 1981). See table 1, below.
TABLE 1.
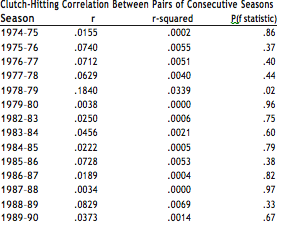
The results are pretty consistent: None of the pairs shows anything close to statistical significance, except one—1978–79. But that one shows a negative correlation; players who hit well in the clutch in 1978 hit poorly in the clutch in 1979. Since we have no reason to believe that clutch hitting one year turns you into a choker the next, that season is probably just random noise.
I have no explanation for why 1979–80 is so highly negative, or for why the correlation is positive in 12 of the 14 years. In any case, we do have confirmation of Cramer’s findings in all 14 of those seasons—in none of them did clutch performance this year significantly lead to clutch performance next year.
We still have not shown whether clutch performance exists or not. But we have shown that, for each of the 14 seasons in the study, a good clutch performance over a season’s worth of at-bats does not reliably indicate a good clutch hitter.3
POWER OF THE SINGLE-YEAR CRAMER TEST
Back to the question—if clutch hitting did exist, would this study have been able to find it? James seemed to imply that the question could not be answered, and we therefore must assume the answer is no. But we can answer it.
Let’s suppose a clutch-hitting ability existed and that the ability was normally distributed with a standard deviation (SD) of .030 (that is, 30 points of batting average).
Statistically, that would mean that, of the 137 players,
- 47 players, or about 34 percent, would be clutch hitters of 0–30 points;
- 47 players, or about 34 percent, would be choke hitters of 0–30 points;
- 19 players, or about 14 percent, would be clutch hitters of 30–60 points;
- 19 players, or about 14 percent, would be choke hitters of 30–60 points;
- 3 players, or about 2 percent, would be clutch hitters of 60–75 points;
- 3 players, or about 2 percent, would be choke hitters of 60–75 points;
- One-half player would be a clutch hitter of 75 points or more;
- One-half player would be a choke hitter of 75 points or more.
(This adds up to 139, instead of 137, because of rounding.)
If that were the case, we would probably agree that clutch hitting is a reasonably important part of the game. But, still, two-thirds of all players are only 30 points different in the clutch, and only one regular player in the league has a 75-point difference (and it might go either way).
We would probably say that clutch hitting is reasonably significant—something for the player’s manager to keep in mind, along the lines of a platoon differential, for instance.
So, back to the original question: Would the Cramer test be able to pick up this distribution of clutch talent? To check, I took the 137 players in the 1974–75 sample and assigned each of them a “clutch talent” based on this normal distribution.4 Then, I threw away their real-life “hits” columns and simulated their actual number of clutch and non-clutch hits based on their clutch and non-clutch expected averages.
I repeated this test 14 times, for easy comparison to the 14 years of data shown in table 1.
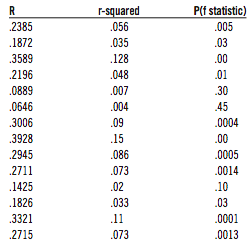
The results: In 11 of the 14 cases, the Cramer test had absolutely no trouble picking up the clutch hitting at the significance level of .05:
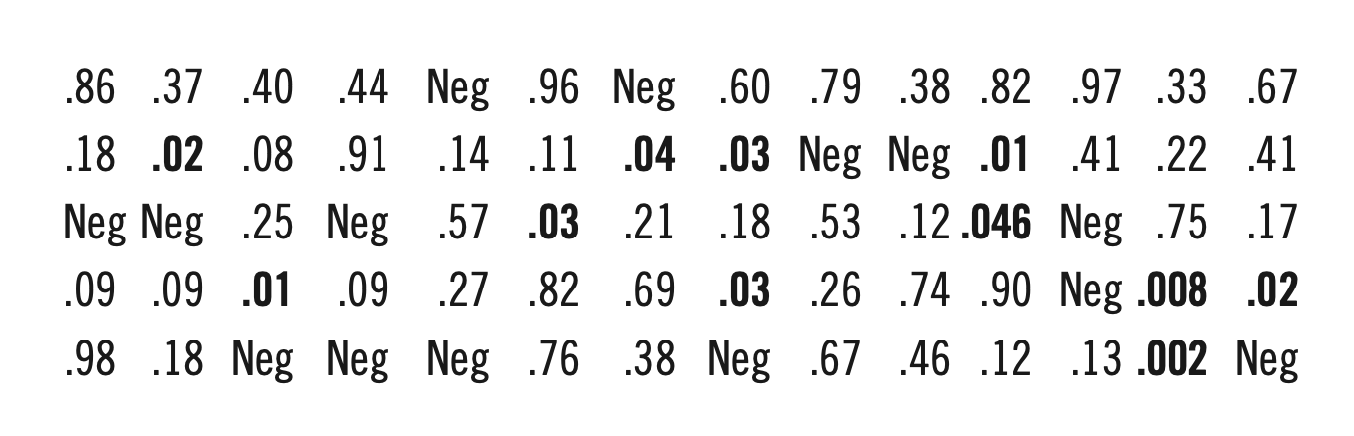
To make things clearer, here are the probabilities (third column of the table) summarized in table form. The top row is for the real-life data (from table 1); the bottom row is for our simulation (table above). Statistically significant samples (.05 or lower) are in bold, and “Neg” indicates a negative correlation:
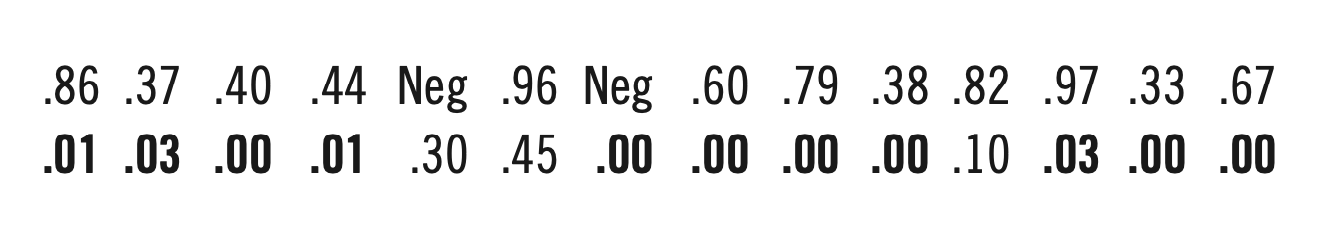
There is no question that the results in the second row are highly significant and that the results in the first row are largely random. For a clutch SD of 30 points, the Cramer test finds the clutch hitting. Since it did not, we can be almost certain that, if clutch hitting talent does exist, its standard deviation must be less than 30 points.
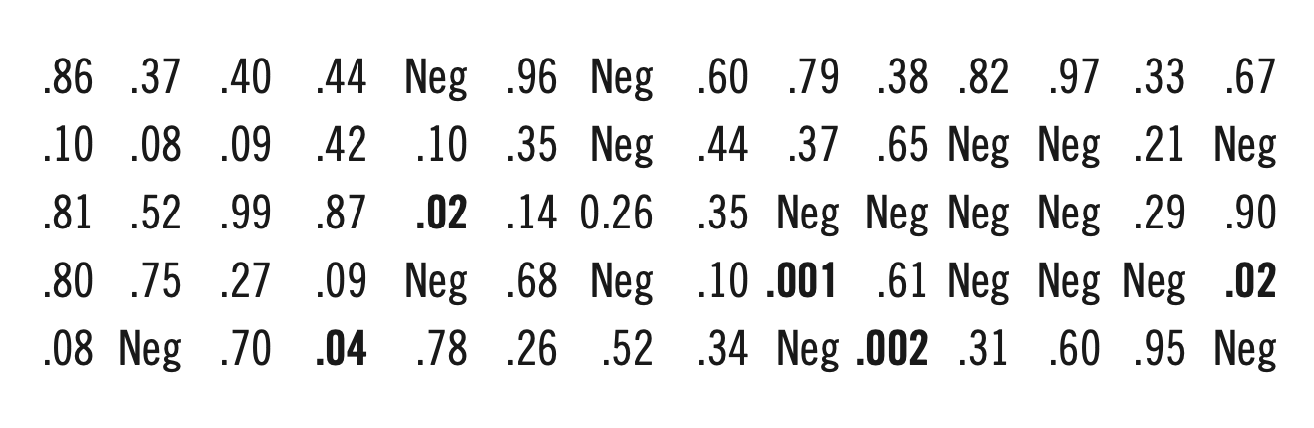
Let’s repeat the experiment, but this time with an SD of 20 points and 28 simulated seasons instead of 14. I will leave out the full results and go right to the table of significance levels:
Overall, 12 of the 28 simulated runs found statistical significance, while many of the others were low, .2 or less. Again, there’s no comparison between the real-life data and the simulation, and we can again conclude that, if clutch hitting existed at the 20-point SD level, the Cramer test would have found it.
So, let’s now try an SD of 15 points, or .015. This is half of what we started with, which would mean that only one player in both leagues would be as much as 45 points better (or worse) in the clutch.
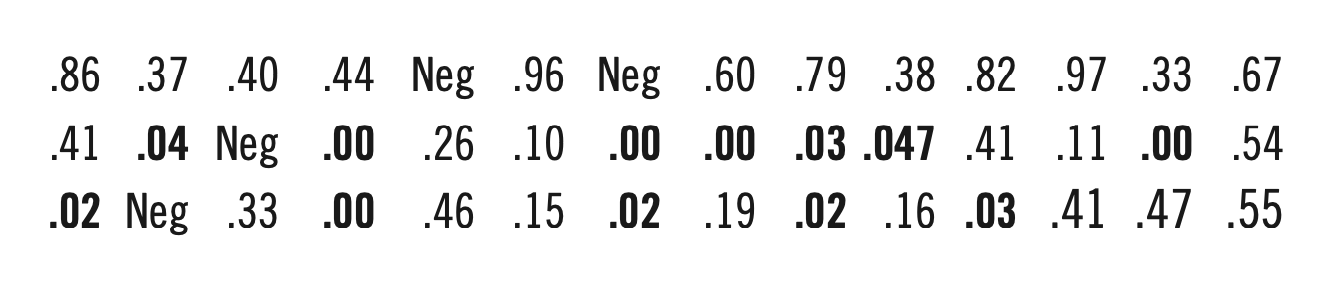
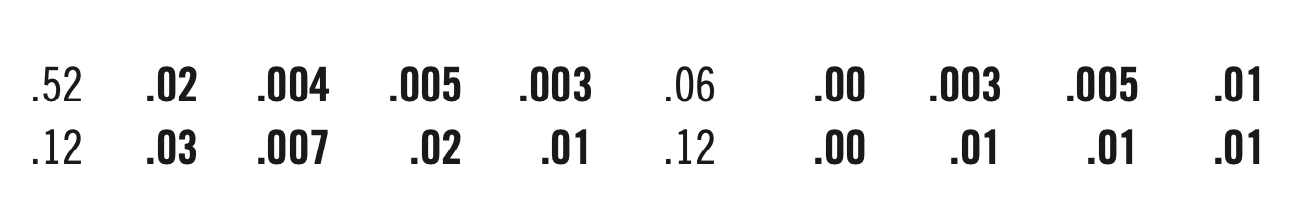
Since the significance levels will start to vary more, I’ll run more of them. Here are four rows of simulated data, again with the real-life data in the top row:
We’re down to only 11 significant simulations out of 56.
But there are still a few close calls and the numbers lean toward the smaller, which suggests that the test is picking up a real effect. Still, the test seems to have gotten significantly weaker.
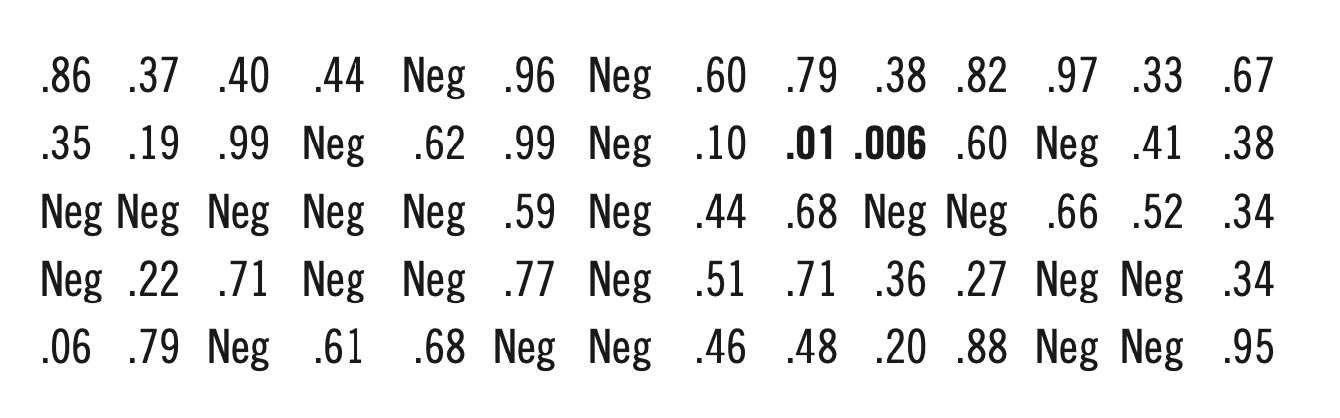
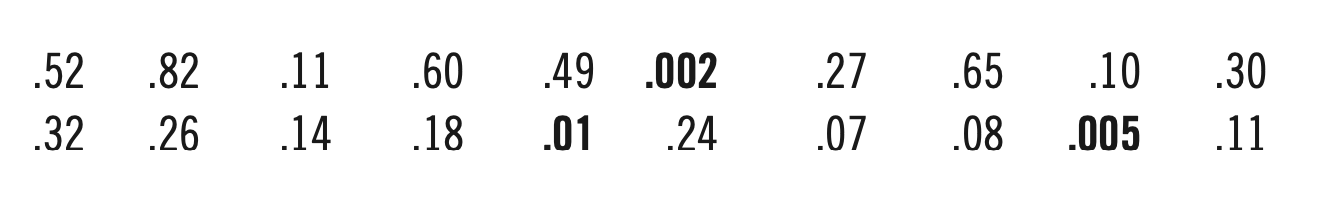
Let’s go down another step, to .010:
There are five significant findings out of 56—about 9 percent, whereas 2.5 percent would be expected by chance—but the numbers are getting bigger. The real-life row of data still doesn’t quite fit in, but it’s getting pretty close. We certainly can’t say that an SD of .010 is out of the question, but, still, it does look a bit doubtful.
To make sure, we’ll go down one more step, to .0075:
Although there are still a couple of significant results, our row of real-life data fits right in among the other rows. It’s fair to say that the Cramer test does indeed “fail” when the standard deviation of clutch hitting is as low as .0075.
A FORMAL STATISTICAL-POWER TEST
Instead of using the simulation, we can produce an actual measurement of the power of the Cramer test by using a freeware software tool called GPOWER.5
Suppose clutch hitting existed but with a real-life correlation of .25. That would mean that, roughly speaking, a player who hit 110 points above average in the clutch this year would hit about 27 points higher in the clutch next year. What are the chances the 1974–75 Cramer test would find a statistically significant result? GPOWER’s answer: 91.3 percent. That means, on average, we should have found 13 significant real-life seasons out of the 14. We actually found zero.
With a correlation of .2, the Cramer test would succeed 77 percent of the time—11 out of 14 instead of zero. At r=.15, we would find significance 55 percent of the time—6 out of 14. At .1, the success rate is still 32 percent, or 4 out of 14. Finally, at .05, the Cramer test would succeed only 14 percent of the time, which is still 2 out of 14.
It’s fair to say that, at the most optimistic, season-to-season clutch hitting might exist with a correlation of .1 or less. That means that a player with 110 points of clutch hitting this year would show only 11 points next year. And, again, that’s being the most optimistic.
THE MULTIYEAR CRAMER TEST
If we take all 14 years of the Cramer test and put them in one large regression, that would save us having to look at 14 different regressions. It might also find a real effect where it couldn’t before, since 14 seemingly random results often combine to give a very significant one. For instance, when a player goes 2 for 5, he might just be an average player having a good day; but when he goes 2 for 5 over a whole season, he’s Ted Williams. In the 14 seasons in the study, there were a total of 2,057 season-to-season comparisons. Running a regression on those seasons gives:
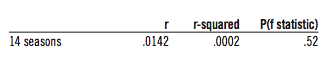
This is, decidedly, an insignificant result. If clutch hitting were truly and completely random, on average we would get a significance level of .50—and we got .52, which is very close. This is far from the .05 we would want to see to conclude that clutch hitting is real.
What about the simulation? Let’s start with a standard deviation of 15 points, where the one-season Cramer test was successful only about 20 percent of the time. I ran 15 copies of each 1974 player, for a total of 2,055 player-seasons:
The simulation turns out significant at the 2 percent level. But it could be a fluke—let’s run it a few more times, and compare it to the real-life .52 (not shaded):
The 14-seasons-combined Cramer test seems to find clutch hitting at a standard deviation of .015 almost all the time. And, in fact, our .52 “real-life” significance level is very much out of place in this list.
Let’s try .010:
Three of the 19 simulations came up with significant results; several others were very close; and most of the numbers are low. However, there are a few higher numbers, and the real-life .52 isn’t completely out of place here. We can say, then, that the 14-season-combined Cramer test begins to “fail” at a standard deviation of about 10 points.
GPOWER AGAIN
Running our complete 14-season study (2,055 pairs) through GPOWER shows:
- If there were a correlation of .15 or higher, the 14-season Cramer test would have found it 100 percent of the time (or at least more often than 99.9995 percent).
- If the correlation were .10 or higher, we would have found it 99.8 percent of the time.
- If the correlation were .08 or higher, we would have found it 97.7 percent of the time.
- If the correlation were .05 or higher, we would have found it 73 percent of the time.
- Finally, if the correlation were .05, what are the chances we would find a significance level of .52 or better? 99 percent. That is, if there were indeed clutch hitting at a 5 percent correlation—which means 110 points this season translates into only 5.5 points the next—99 times out of 100 we would have seen results more significant than we did.
CONCLUSIONS
We can draw two sets of conclusions from all this— one set about the Cramer test, and one set about clutch hitting.
The Cramer test provides important evidence on the clutch-hitting question. While it cannot completely disprove the existence of clutch hitting, it puts a strong lower bound on the magnitude of the possible effect. If clutch-hitting talent is distributed among players with a standard deviation of at least .030, the single-season Cramer test (with 137 player-pairs) is sufficiently powerful to find the effect. Between .020 and .010, the single-season test might find the effect, but it probably will not. Below .010, the single-season test will not find the effect.
Using the Cramer test 14 separate times on 14 separate seasons, we should note an obviously above-average number of significant seasons down to an SD of 0.015. At .010, we will notice more significant seasons than expected, perhaps 9 percent instead of 2.5 percent. But at .0075, the Cramer test will almost certainly fail to find the effect.
By using the Cramer test on one large sample of 14 seasons combined, we are almost certain to notice an effect all the way down to an SD of .015. But at .010, a finding of significance is unlikely.
Finally, if the correlation of the large sample is .08 or higher, the Cramer test on the combined data should spot the correlation almost 98 percent of the time.
As for clutch hitting itself:
- The Cramer tests show that clutch hitting appears to not exist at The question, though, is whether clutch hitting is still possible given the limitations of the Cramer test.
- If clutch hitting exists despite the Cramer test’s failing to find it, its standard deviation among players is almost certainly less than 15 points of batting average; that is, at least two-thirds of all players are expected to clutch-hit within .015 of their non-clutch batting It is likely even less than 10 points of batting average.
- If clutch hitting does exist at the 10-point level, that means that less than one player in 200 can hit more than 25 points better in the clutch—a very small effect, even in the best case.
- If clutch hitting does exist with a between-seasons correlation of .05, there would have been about a 99 percent chance that the Cramer test would have found more significance than it did.
- If clutch hitting does exist with a between-seasons correlation of .05, that means that a player who hits 110 points better in the clutch one year can be expected to hit only 5.5 points better in the clutch next year.
The results confirm other studies, including Pete Palmer’s multiyear study (By the Numbers, March 1990), that failed to find clutch hitting.
In summary: The Cramer test doesn’t prove that clutch hitting does not exist. But it does prove that, if clutch hitting does exist, for the vast majority of players it’s at levels almost too small to be detectable or important and that previous clutch-hitting performance is not a reliable predictor of future clutch-hitting performance. This suggests that, in any case, it is probably impossible to distinguish good clutch hitters from bad.
PHIL BIRNBAUM is editor of By the Numbers, the newsletter of the SABR Statistical Analysis Committee. A native of Toronto, he now lives in Ottawa, where he works as a software developer.
Notes
This article was originally published in the newsletter of SABR’s Statistical Analysis Committee—By the Numbers 15, no. 1 (February 2005).
- There is a strict philosophical sense in which it can be said that no test can ever be certain that an effect exists or doesn’t That is, no matter how many data points in our sample, and no matter how evident it appears that there is an effect (or no effect), it is always possible, although perhaps vanishingly unlikely, that the observed differences (or lack thereof) were caused by chance. (For instance, it cannot be said for sure that Barry Bonds is a better hitter than Mario Mendoza, because there is an infinitesimally small probability that Mario is actually better but just had really bad luck.) However, this interpretation does not appear to be what James had in mind.
- For clutch, I used the Elias “Late Inning Pressure Situations” definition—seventh inning or later, tied or down by 3 runs or less, unless the bases are loaded, in which case down by 4 runs was Thanks, as always, to Retrosheet. Note that my data occasionally differs slightly from Elias and perhaps other sources—my best guess is that Retrosheet’s raw data differed from Elias’s, causing Elias to count some at-bats as clutch, which I didn’t, or vice versa. A full set of raw data is available from the author, or, at the time of writing, at http://www.philbirnbaum.com/clutch.txt.
- And by extension, if a full season’s worth of clutch hitting doesn’t identify a good clutch hitter, neither can a good clutch postseason (e.g., Reggie Jackson).
- Technical note: To generate a clutch difference from this normal distribution, I created a “fake” .250 I ran 208 random at-bats for him, giving him a 1-in-4 chance of getting a hit each at-bat. I then computed his batting average over those 208 at-bats and subtracted it from .250. According to the normal approximation to the binomial distribution, that random batting average should be normally distributed with mean .000 and standard deviation .030. So that batting-average difference for the “fake” player becomes a clutch talent for one of the simulated players.
- GPOWER is available from http://www.psycho.uni-duesseldorf.de/aap/projects/gpower/. Thanks to Charlie Pavitt for letting me know about GPOWER, as well as for several suggestions that significantly improved this article.