

Coincidences: Unique Line Scores
This article was written by Ron Visco - Peter Uelkes
This article was published in 2003 Baseball Research Journal
On August 8, 1979, the visiting Milwaukee Brewers defeated the hometown Baltimore Orioles 8-4. The visitors scored a run in the top of the first inning, but the home team came back with three runs in the bottom half. Slowly, with a run in the fourth and another in the seventh, the visitors fought back to tie the game. Each team scored once in the eighth, but the visitors broke it open with four runs in the ninth to take the victory. The line score was:

A good game, close until the ninth, but remarkable.
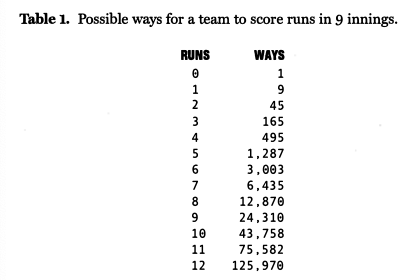
There are 6,370,650 different line scores that result in an 8-4 nine-inning win by the visiting team such as this one. An earlier article, “Let Me Count the Ways,” (BRJ, No. 30, 2001) discussed the number of different line scores that could result in a game where each team scores nine runs or less. A small table summarized the number of “ways” for a team to score a given number of runs in nine innings (that is, for that number of runs to be distributed among the nine innings). Here is an expanded version:
In this article, “nine innings” means a game which featured between 51 and 54 outs; this includes games which go to the bottom of the ninth where either the home team is ahead (and they do not bat) or where they score the winning run with one or two outs.
Using the 8-4 game above as an illustration, there are 12,870 ways for the visitors to score eight runs and 495 ways for the home team to score four, so there are 12,870 X 495 = 6,370,650 ways to get an 8-4 visiting team victory (in nine innings): over six million ways! See the earlier article for more details.
This number not only exceeds the number of games ending in an 8-4 road win but also far exceeds the number of games in major league history. Such results led the authors to hypothesize that games in which nine or more runs have been scored may have line scores unique in the history of major league baseball: that is, line scores in such relatively high-scoring games have never been duplicated.
In order to determine the probability that a line score is unique, more information is needed: the actual number of games played that resulted in the given score. For instance, how many nine-inning 8-4 games that resulted in visiting team victories have actually been played?
To address this issue, an analysis was conducted using a data set downloaded from Retrosheet; this online resource contains line scores from all major league games for the period 1978 to 2000 (inclusive). A number of analytic procedures, mainly scripts to be run in a Unix environment, were written. Their pur pose was to determine, within the data set:
- The number of games with a given final score
- The probabilities for matching (duplicate) line scores for each given final score
- The number of matching line scores for each given final score
One focus, in particular, was to uncover matching line scores from games with high run totals (especially nine or more runs), where such matches might not be expected to occur. A match which is relatively unlikely to occur (but does) will be called a “coincidence.”
To understand how to calculate the probability of a coincidence, consider an application of a mathematical concept often called the ”birthday paradox.” Suppose there are 25 people in a room (a party, classroom, etc.). What is the probability that at least two of them share the same birthday (month and day)? It’s easier to first calculate the probability that no one shares a birthday. Choose someone and note the birthday. Then randomly choose another person. The probability that the second person has a different birthday is 364/365 (we’ll ignore leap days for simplicity). The probability that a third person has a birthday different from the other two is 363/365. And so on. Thus, the probability that all 25 people have different birthdays is given by the product:
![]()
which is approximately p – .43; that’s the probability of no birthday matches. We subtract this figure from 1 (because a probability of I is the highest possible, and means it’s certain) to obtain the probability of at least two people in the room sharing a birthday: I – .43 = .57. In other words, there is a 57% chance that at least two people will share birthdays, a result which may seem surprising with only 25 people.
The same technique was applied to determining the probability of finding, or not finding, a coincidence in line scores for each given score. For this analysis, figures were tabulated separately for visitor wins and home wins. Only games with nine or more runs are considered here. Matches on line scores occur more often for low-scoring contests. For some scores, it is certain that matches will occur. For instance, there are only nine different line scores for a 1-0 home victory, but 462 such outcomes were found in the available data set, so inevitably there are many matches.
Table 2 presents the findings for home team victories. The first two columns give the different possible outcomes, such as a 9-0 home win. The column gives the number of possible line scores with that outcome. The fourth column shows how many such scores are known, based on the computer search. The fifth column shows the probability that no duplicate line score, or coincidence, will occur; this was calculated using the birthday paradox approach and the figures from the previous two columns. Finally, the last column gives the number of actual coincidences that were found in the search.
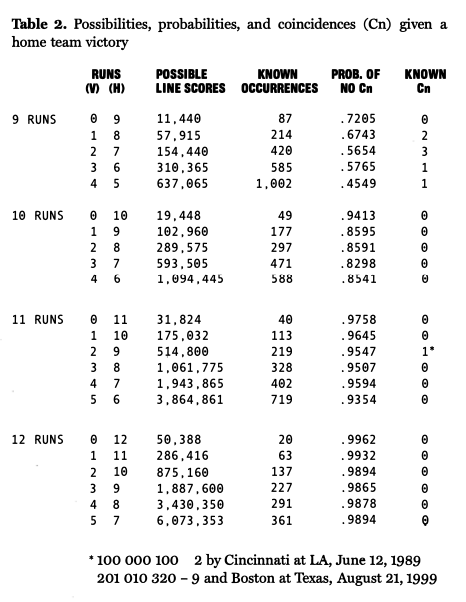
The hypothesis presented in “Let Me Count the Ways” proved to be incorrect! There have been a handful of coincidences among games with nine runs. Note that there have been so many 5-4 home team victories (over 1,000), despite over 637,000 possible line scores with that result, the probability is less than 50% that there would be no matches. Indeed, there is one. Keep in mind that the probability of matching a particular 5-4 line score would be very small, just as the probability of someone else in a room of 25 people sharing your birthday is quite small. The probability reported in Table 2 considers any 5-4 road win line score matches, not of matching one in particular.
What is more surprising is that we find line score matches among the 8-1, 7-2, and 6-3 home victories, which we do. None of these matches was likely, although none was unlikely to the extent found in higher-scoring games.
In passing, it’s worth noting that within any of the “total runs” categories (9, 10, 11, and 12), the number of known games increases as the outcome gets closer. For example, among nine-run contests, there are 87 9-0 outcomes, but the number of occurrences increases substantially as the score distribution changes to 8-1, 7-2, 6-3, and finally 5-4. Another way of stating that result, based on the findings presented here, is that the more possible ways to reach a given score or run total, the more times it has actually occurred.
As we move to 10, 11, and 12-run home team victories, Table 2 shows that the probability of a coincidence for a given case is quite small. Nonetheless, in an 11-run game where the probability of no matches is 95.5, we find a coincidence!
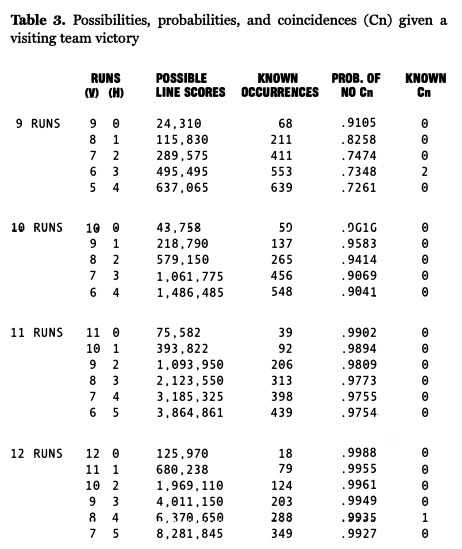
In Table 3 are the corresponding figures for visiting team victories. We find two coincidences for nine total runs, both happening in 6-3 games. However, the real surprise comes further down the table, where there are matching line scores in 12-run games.
On June 3, 1988, the visiting Houston Astros defeated the hometown San Francisco Giants 8-4. The visitors scored a run in the top of the first inning, but the home team came back with three runs in the bottom half. Slowly, with a run in the fourth and another in the seventh, the visitors fought back to tie the game. Each team scored once in the eighth, but the visitors broke it open with four runs in the ninth to take the victory. The line score:

It was a good game, close until the ninth, but not really remarkable. Except for one thing: this was the exact description, the exact line score, that had occurred in the Brewers-Orioles game nine years earlier. One chance in six million: now, that’s a coincidence!
PETER UELKES got a Ph.D. in particle physics and is currently working as a business analyst for the Vodafone group. He is a SABR member since 2001. RON VISCO works in the education department at the National Baseball Hall of Fame and has been a SABR member since 1983.