Expansion Effect Revisited: 1927 Ruth or 1998 McGwire
This article was written by Phil Nichols
This article was published in 2000 Baseball Research Journal
Last year, in an article entitled “Expansion Effect,” I showed that winning teams win more in expansion years. Now I am going to analyze whether Babe Ruth (1927) or Mark McGwire (1998) hit more “home runs” when the Expansion Effect is considered.
I first started by looking in The Home Run Encyclopedia (a great SABR volume) and discovered that the authors had conveniently listed the top five home run hitters annually by league. However, the book ended at the 1995 season. An e-mail to one of the authors quickly yielded information for 1997 and 1998. Thank you, David Vincent.
Since Ruth (1927) and McGwire (1998) each led his league in homers, I felt an analysis of the top five in each league during expansion years as compared to the year before would be fair. In other words, no matter the players’ names, the first spot’s number of home runs produced would be compared to the year before expansion. The second spot, the same analysis, and similarly through fifth spot. See Table 1.
Also, when “home run” appears in quotes, I am referring to home runs adjusted for statistical analysis in one way or another.
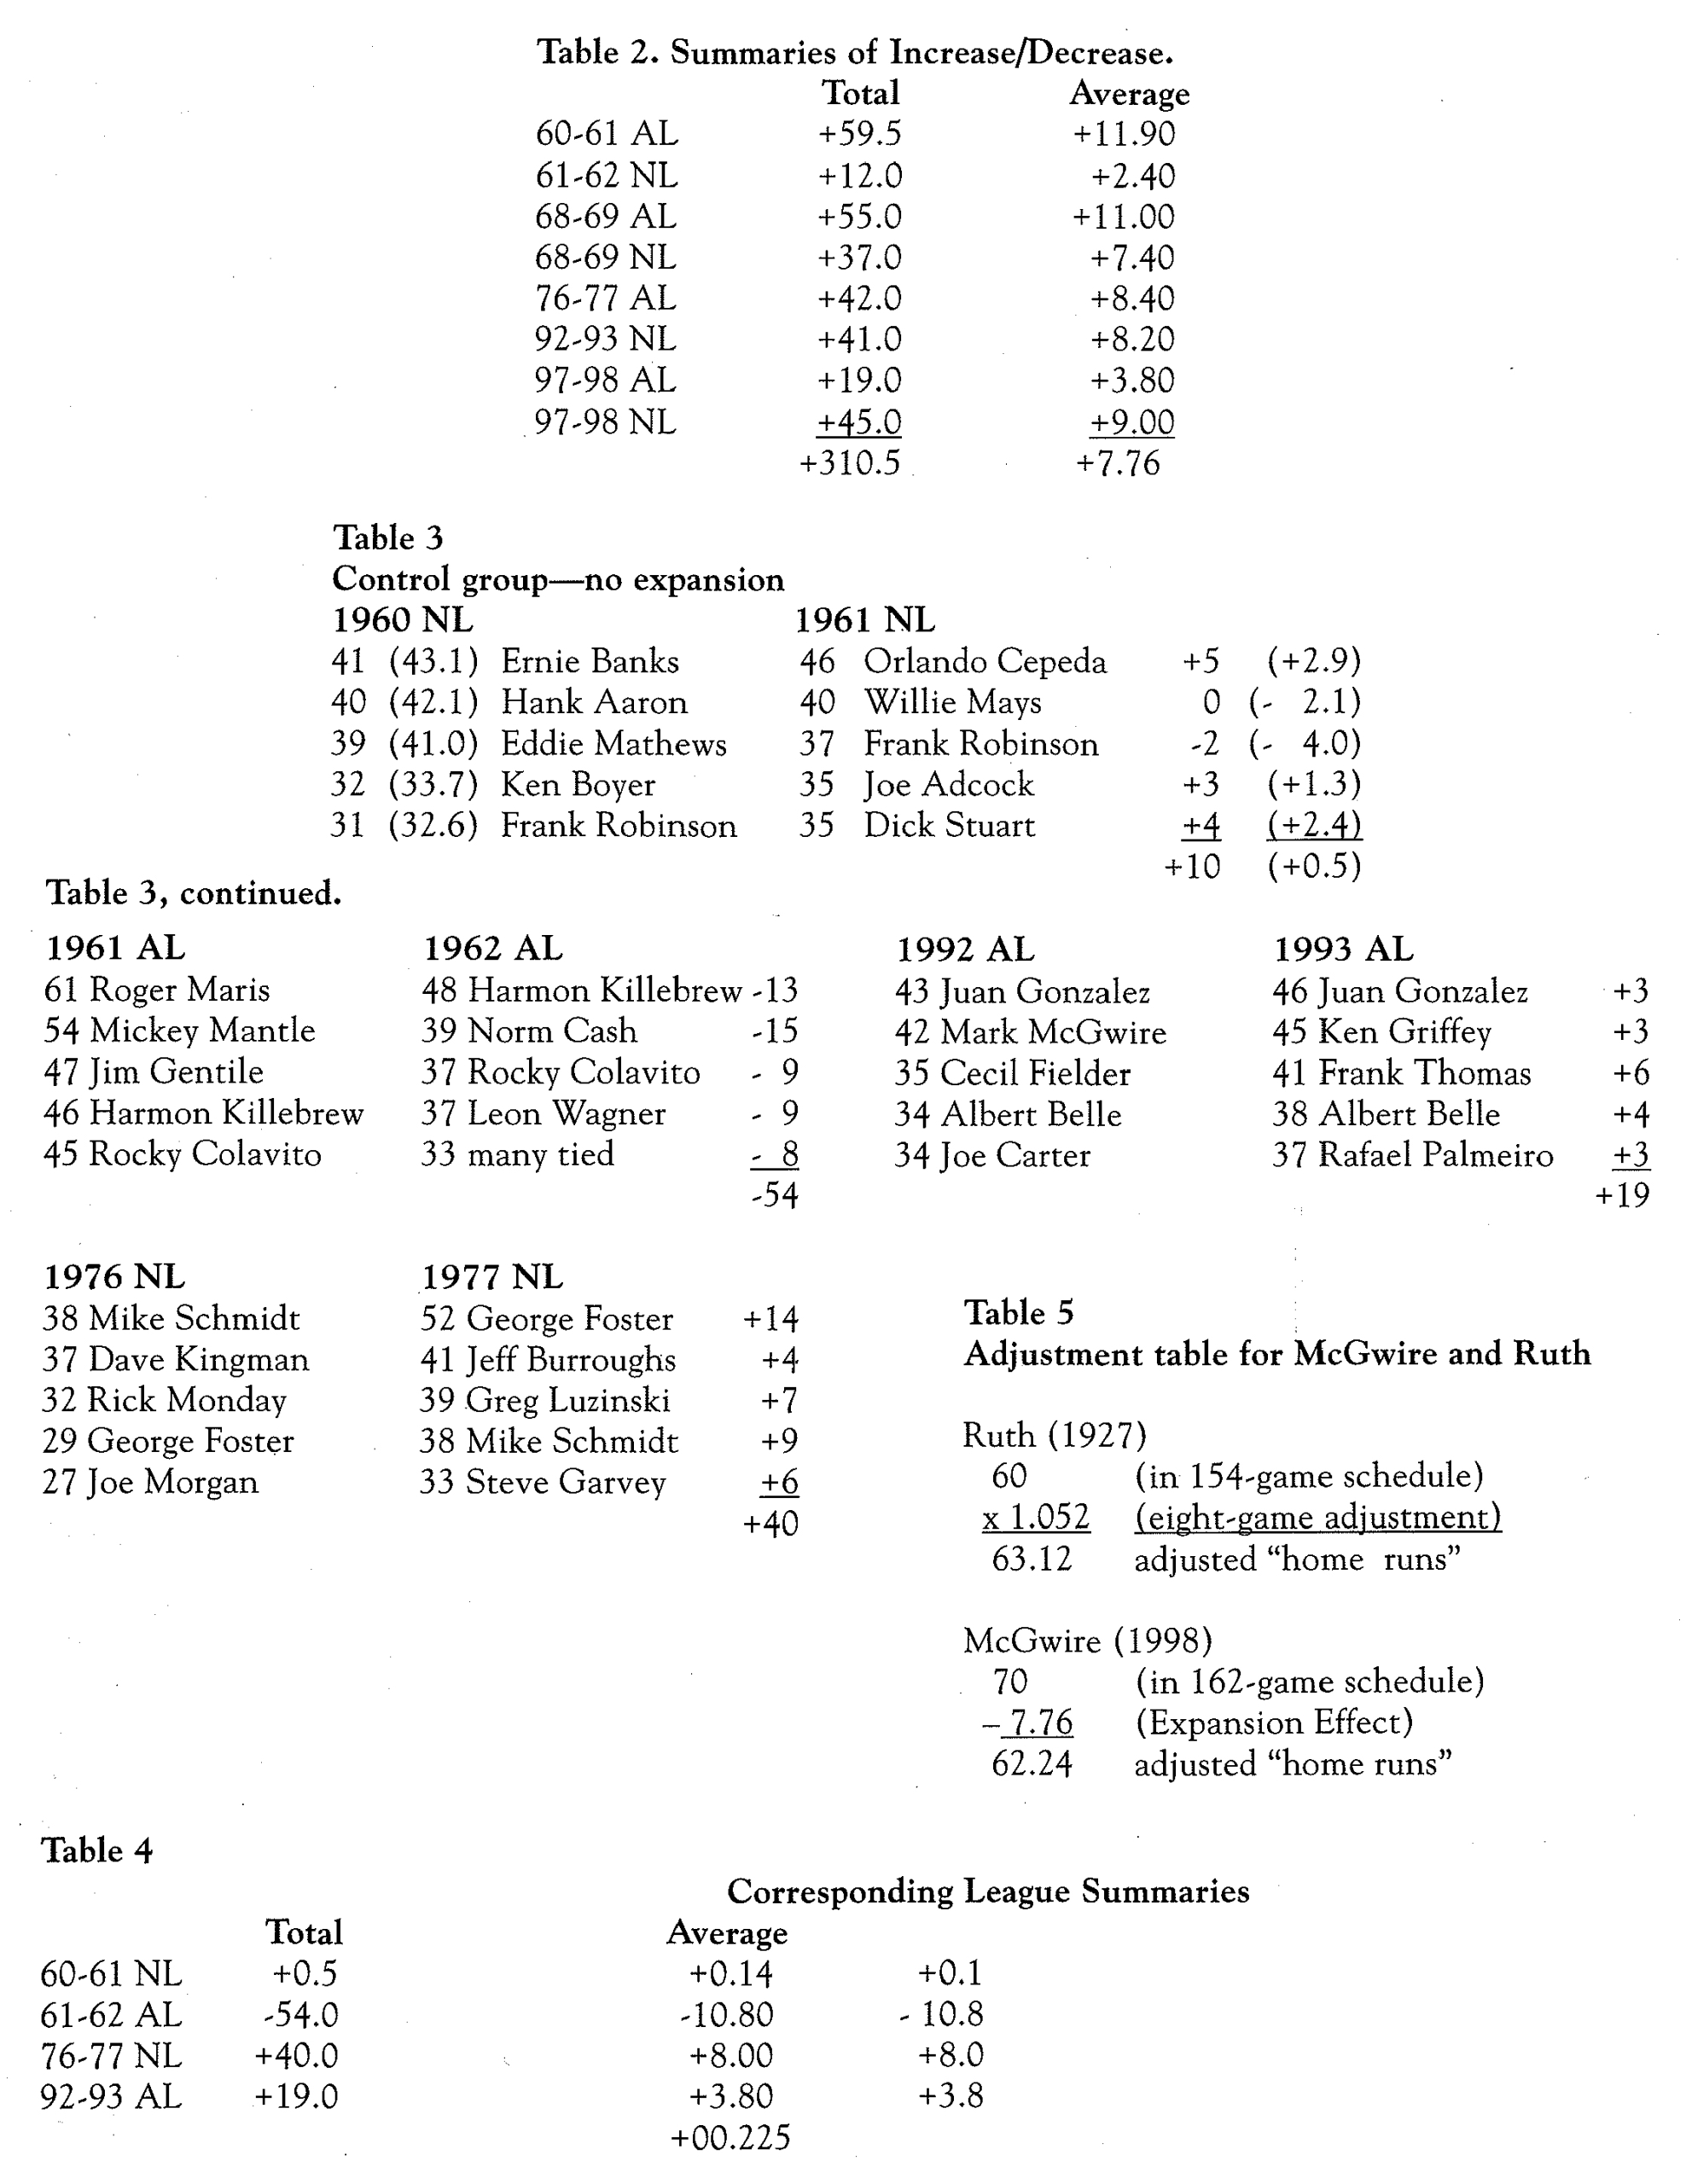
The 1960-61 American League expansion required an extra adjustment because eight games were added in 1961. I multiplied the old 154-game results by 1.052 to produce the statistical comparison for a 162-game schedule. The results are in parentheses. Likewise, the statistically adjusted differences are in parentheses. For example, Mickey Mantle led the American League in 1960 with 40 home runs. Roger Maris led the American League in 1961 with 61 home runs. Mantle’s 40 was adjusted to 42.1 for a 162-game schedule. Therefore, the American League’s top home run hitter hit 18.9 more “home runs” in the expansion year than the year before.
One truly significant surprise is that not a single home run hitter in the top five hit fewer home runs in an expansion year than the corresponding place the year before. Only twice, 1961-62 National League fifth place and 1997-98 American League first place, did the home run totals equal. The Expansion Effect seems to be powerful.
I totaled the data and summarized it in Table 2. The final analysis showed that the average top five home run hitters hit 7.76 more home runs in an expansion year. Surely that is not just significant—it is mind-boggling.
As sort of a “control group,” I analyzed the similar data for the league that did not expand during an expansion year. See Table 3.
Table 4 summarizes the non-expanding league results. The final average turned out to be a tiny and insignificant +0.225 per home run hitter. I think this is a second proof that the Expansion Effect is powerful. There is no doubt that good players and good teams post significantly better statistical numbers in expansion years.
What’s the result when we apply the simple schedule and Expansion Effect calculations to Babe Ruth’s 1927 and Mark McGwire’s 1998?
Ruth hit 60 home runs in 1927. McGwire hit 70 home runs in 1998. Adjusting Ruth’s 60 by the multiplier 1.052 for the longer schedule yields 63.12 “home runs.” Adjusting McGwire’s 70 for the Expansion Effect by subtracting 7.76 homers yields 62.24 “home runs.” See Table 5. The contest is a virtual photo finish.
PHIL NICHOLS is an attorney in Stephenville, Texas, and a SABR member since 1994. This is his second SABR article. His great uncle, Clyde Barnhart, was a starter for the 1925 Pittsburgh Pirates world champions—his only claim to fame in his family.