

Fair-Weather Fans
This article was written by Darren Glass
This article was published in 2003 Baseball Research Journal
In Rob Neyer’s chapter on San Francisco in his Big Book of Baseball Lineups, he speculates that there aren’t really good baseball cities and that attendance more closely correlates with winning percentage than with any other factor. He also suggests that a statistically-minded person look at this. I took the challenge and have been playing with a lot of data.
Methodology
I looked at all seasons from 1973 until 2003. In particular, I looked at the correlation coefficients between the following variables:
- Average home attendance per game (ATT)
- Home attendance per game divided by average
- Home attendance overall teams (to normalize for nationwide trends) (ATT/AVG)
- Final place in divisional standings (PLACE)
- Winning percentage (WIN
There are a few basic properties of correlation coefficients (CCs). If a CC is equal to zero, then the two variables are uncorrelated; if it is close to one they are close to linearly correlated in a positive way, and if it is close to -1, then there is a strong negative relationship between them.
Correlation With Winning Percentage
To begin with, let us look at the most naïve study: the correlation between winning percentage and home attendance. Over the 30 years between 1973 and 2002, the baseball-wide CC was .464. Table l lists teams that can be described as having fair-weather fans-their correlation between winning and attendance is more than 0.2 greater than the baseball-wide average.

On the other side of the spectrum are those teams that have correlation coefficients significantly lower than the baseball-wide average. An optimistic interpretation of this would be that the fans stick with the team no matter how badly they are doing (the case of the Red Sox and the Cubs), while a pessimistic interpretation might be that the fans refuse to support the team no matter how good they are. Table 2 lists cities that have correlation coefficients between ATT and WIN more than 0.1 below baseball average.
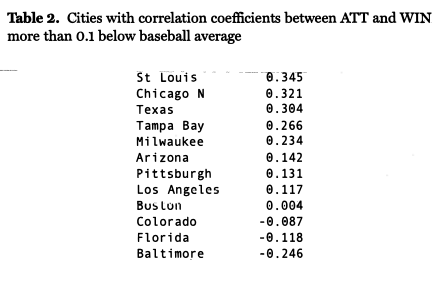
The presence of all four of the expansion teams, of the 1990s on this list makes sense, as the small sample size is distorted by the first few years in which novelty value runs high and the teams are not likely to be very good.
The most interesting data point on this list to the author is the Orioles, where the fans of Baltimore over the past 30 years actually supported the team significantly more the worse they have been. This is likely due in large part to the draw of the new ballpark at Camden Yards, and that it has been successful in bringing in fans despite the fact that the Orioles have had losing records in six of the 11 years since it opened
A slightly less naïve study would try to normalize for the effects on attendance of baseball as a whole. The average attendance at baseball games has nearly doubled over the last 30 years, and all of baseball took a hit in 1995 when the average attendance dropped by nearly 6,000 fans per game. Thus, I also computed the CCs between ATT/AVG, a given team’s average home attendance divided by the average attendance of baseball games league-wide, and winning percentage. The data did not qualitatively change significantly. The league-wide CC went up to .55.

Statisticians say that a correlation coefficient is statistically significant if it is greater than the value of a certain T-test. While I will not go into the details of this calculation, I will point out that for our sample size of 802 team-seasons, any CC over .116 is statistically significant with probability 99.9%. In particular, our league-wide CC of .55 is extremely significant.
For the individual teams, sample sizes are much smaller. In particular, non-expansion teams have 30 data points, and thus a CC over .570 will be statistically significant 99.9% of the time, a CC over .463 is significant 99% of the time, and a CC over .361 is significant 95% of the time. When expansion teams with even smaller sample sizes are included, the CCs are significant at the 99% level for every team except Milwaukee, Anaheim, Baltimore, Toronto, Tampa Bay, Arizona, Colorado, and Florida.
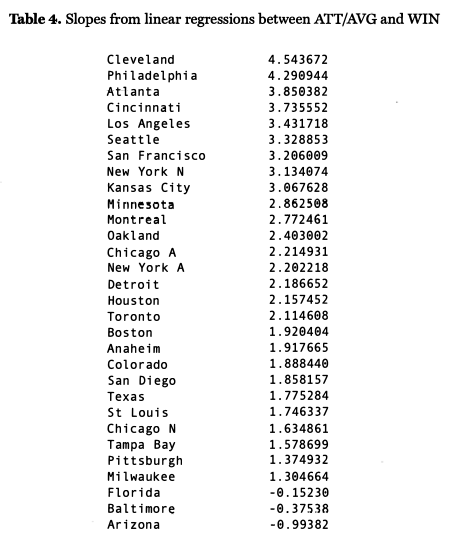
Of course, the CC is not enough to capture what we are interested in. In particular, if a city’s ATT/AVE and WIN were strongly correlated to a line with slope zero, we would view it as much less of a “fair-weather fan” city than a city with a weaker correlation to a line and a very large slope. I also computed the slope of the line given by various linear regressions baseball-wide – the results of linear regression on ATT/AVG and WIN are ATT/AVG = 2.7525 x (WIN) – .3769. While ATT/ AVG is a more meaningful statistic, it is also harder to get a feel for. For this reason, we will note that the linear regression between ATT and WIN gives ATT= 63,476 X WIN – 7,71,0. In other words, by increasing winning percentage by .100 (an improvement of roughly 16 wins per season), a team can expect to boost home attendance by an average of 6,347 fans per game.
A natural question to ask, and one that more than a few people are looking at due to its various political implications, is how new stadiums affect attendance. While I did not investigate this phenomenon in any depth, I will note that if you remove all data points in the data set corresponding to the first two years that a team is in a new city or a new stadium, the baseball-wide CC actually raises by .05.
Correlation With Place Finished
It is also natural to wonder if it is not the winning percentage that brings in the fans but being in the hunt of a pennant race. I decided to test this hypothesis by calculating the correlation coefficients between our attendance variables and the place in which a team finished within their division, as well as how many games back they finished. Because the nature of both of these variables changed significantly with the realignment in 1994, I ran the study first looking only at the data from the years 1973-1993. In particular, it was not clear how to best handle the situation with the wild card, and teams that might be in the hunt for the wild card despite being many games out of the division lead (see 2003 Phillies and Marlins, for example). It came as a surprise to the author that including the last decade did not significantly change the results, as seen by the following charts:
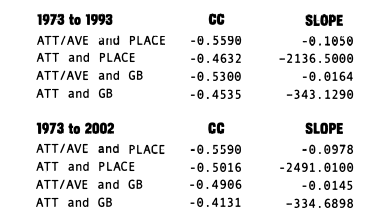
In all of these examples, CC is negative. This is what we would expect as the “higher” your value of PLACE and GB, the less attendance we might expect to see.
I have not included the team-by-team data, but it is qualitatively very similar to the above team-by-team data, with the teams falling in roughly the same order and with the same significance results. Anyone who is interested in the full data should feel encouraged to email me.
Correlation With Past Performance
Another question that comes up is how correlated attendance is with past performance. In particular, looking at the correlation between winning percentage (or standings) in year x and attendance in year (x+1). The idea being that the rush of winning the World Series creates new fans (and season ticket holders) no matter how badly the team performs the following year.
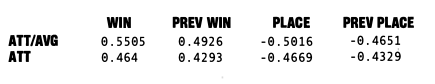
However, when one runs the numbers, they are not particularly illuminating. In fact, the CCs one gets from comparing last year’s winning percentage and this year’s ATT/AVG is .492, slightly less than when you compare this year’s record with this year’s attendance, .551. (See below for the full chart of CCs.) Furthermore, the only teams for which there is a substantial difference in the CCs when you run the study the two ways are Colorado (which can be partially explained by the fact that you had a small data set to begin with and are reducing it even further), Minnesota, Montreal, Pittsburgh, and St Louis. Furthermore, in each of these cases, there is a weaker correlation. So while my instincts agreed with what many of you suggested might be an interesting effect, the numbers don’t seem to bear it out.
One problem in trying to do such a study is that there is a relatively strong correlation between how a team does in year X and how it does in year x+1 (CC = .5 for my data set). Isolating that factor would be hard but not impossible.
Conclusions
Every one of the tests which I ran seems to indicate that Rob Neyer’s hypothesis is correct: attendance at ball games is highly correlated with the winning percentage of the home team. This is certainly true baseball-wide and is also true for almost every team individually. The exceptions by and large are the expansion teams of the 1990s and the Baltimore Orioles. Furthermore, in almost every permutation of the data, it seems that the fans of Cleveland, Atlanta, and Seattle are especially prone to support their teams more the better they do. We do note, however, that all three of these teams got new stadiums while the teams were doing especially well – and in the case of the Braves and the Indians, this was also at a time when baseball was seeing a drop in attendance nationwide – which likely skews the data somewhat.
Further Explorations
I think it would be very interesting to look at attendance in smaller units than seasons. This could take away some of this effect by looking at when in (for example) the 1991 season the fans stopped punishing the Braves and Twins for previous subpar performance and rewarded them for being good.
However, to do this one would have to control for factors such as weekend games (which generally have higher attendance) or superstar players coming through town (which certainly boosts attendance), or the like, factors which one can ignore over the course of a season but which could significantly affect the data when looking at units of individual games or weeks or even months.
Another thing that I would like to do is to try to adjust for ballpark size. The only way I could think of to do this would be to use “percentage of seats filled” as my attendance variable, but this seems to pose more problems than it solves. I certainly like the idea of “rewarding” the Cubs and Red Sox and other teams which could sell more seats if they had the capacity, but I’m not sure if it makes sense to “punish” cities for having large stadia in this way. For example, if Stadium One holds 50,000 people and Stadium Two holds 60,000, I do not think that it makes sense to treat the fact that they both draw 30,000 fans differently. It also seems like a bit of opening Pandora’s box as we really don’t know how many fans the Red Sox would average if they had an infinitely big stadium. It could be that their attendance would stay the same or it could be that it would quadruple – we have no real way of knowing.
DARREN GLASS experienced the phenomenon of fair-weather fans firsthand when he was one of the dozen people to go to Atlanta Braves games in the mid-1980s. He is currently an assistant professor of mathematics at Columbia University.
Sources
All data came from www.baseball-reference.com.