

File and Trial: Examining Valuation and Hearings in MLB Arbitration
This article was written by Navneet S. Vishwanathan
This article was published in Spring 2019 Baseball Research Journal
 The 2018 season was certainly an interesting one in the American League East. The Boston Red Sox put forward a historically strong championship team and the New York Yankees followed up their 2017 ALCS campaign with a wild-card finish. However, off the field and in the conference room, the excitement of the division began well before Opening Day. Here, in the realm of arbitration, three cases illustrate the peculiarities of a financial system suffused with new trends, uncertainty, and risk aversion.
On January 31, Red Sox outfielder Mookie Betts won his arbitration hearing, securing him the highest salary ever awarded for a first-time arbitration-eligible player at $10.5 million. That was $3 million more than the Red Sox’ bid, and a whopping $9.5 million raise from Betts’s 2017 salary.
Two weeks later, in a contentious hearing on February 15, Marcus Stroman lost his case against the Toronto Blue Jays, resulting in a 2018 salary of $6.5 million, $400,000 less than what he’d filed for.
And in a forgotten headline, on February 6, Jonathan Schoop and the Baltimore Orioles managed to overcome their $1.5 million gulf in salary filings without an arbitrator, settling on an $8.5 million salary for 2018.
These cases represent the three possible outcomes of the MLB arbitration process: a player winning the hearing, a team winning the hearing, and a mutually agreed upon settlement prior to a hearing. However, the likelihood of each outcome varies significantly based on salary filings and player performance. This study seeks to examine this system and arrive at conclusions about whether players and teams with high gaps in filings are more or less likely to follow the arbitration process through to a hearing.
Delving a step deeper into the salary filings themselves, Betts, Stroman, and Schoop may have filed for salaries substantively different from what their skill sets were worth a mere 10 years ago. Given the recent proliferation of advanced metrics in baseball, the evaluation of talent has changed significantly. This study further examines whether compensation and skill premiums for particular aspects of a player’s game have changed over time.
On these two general points of inquiry, this study builds a comprehensive picture of the MLB arbitration process. By understanding how the arbitration process affects incentives for negotiation and settlement, it applies economic logic of contract theory to a controlled environment of arbitration. And by examining trends in valuation and compensation, the study draws conclusions about how baseball’s information revolution affects bargaining for contracts and salary. Ultimately, this reveals two conclusions: risk aversion from players and teams in arbitration hearings, and the proliferation of advanced metrics and skill-based valuation of players as reflected in compensation.
MLB Arbitration Overview
Before discussing the data and model strategy, it is important to examine the arbitration system, whose design significantly affects salary filings and the incentive structure for players and teams. There are two major components to consider: eligibility standards for arbitration and the arbitration procedure itself.
Arbitration dates to the 1973–74 offseason. Under current rules, players with between three and six years of service time are eligible to have their salaries decided by arbitration. Two major exceptions to this eligibility window exist. First, any player with more than six years of service time can elect to engage in the arbitration process with a consenting team. However, since these players are also eligible for free agency, they rarely opt for arbitration and instead negotiate contracts directly with teams. A notable exception was David Ortiz, who in 2012 elected to enter arbitration with the Red Sox rather than exploring the free-agent market.
The more important exception to the eligibility standards is the class of players known as “Super Twos.” Players in the top 22 percent of service time for those between two and three years of service time are eligible for arbitration one year early, for a total of four years. Super Twos are often the top young performers in the league and are rewarded with a bonus year of arbitration eligibility. Entering arbitration one year earlier can have multiplicative effects on earnings in subsequent years, and thereby may affect the incentives of the player.
Turning from eligibility to process, Major League Baseball’s arbitration system can be classified as a “final-offer arbitration” (FOA) system. In this format, both parties submit a bid or proposal to resolve a dispute and present evidence in favor of their valuation. The arbitrator then chooses one of the two bids and cannot derive a value in between the bids. This feature distinguishes MLB’s arbitration system from others such as the National Hockey League’s, where arbitrators are free to select either bid or assign any value in between. As a result of MLB’s final-offer system, bids are often significantly less extreme, since presenting an outlier bid would likely result in losing the entire difference between the two bids rather than the difference with a midpoint.
In terms of process, eligible players and teams unable to come to terms by a mid-January deadline enter the filing period. Here, teams and players are still able to negotiate contracts, but must first file salary figures that constitute their bids in a potential arbitration hearing. If the parties are still unable to reach an agreement after filing, they proceed to a hearing, but remain free to settle at any point before it commences.
In this ultimate phase, players and teams present their respective cases in front of a panel of three arbitrators using admissible evidence such as quality of performance — as measured by both publicly and non-publicly available data — comparisons to previous salary, comparison to like arbitrations, and injury history. Arbitrators then render a decision within 24 hours.
Given these rules, arbitration provides a clearly controlled and regulated laboratory for studying the changes in valuation patterns and effects of contract theory in baseball. With most players signing one-year deals, the confounding effects of multi-year agreements, incentive based bonuses, opt-out clauses, and perks such as no-trade clauses are removed. In arbitration, value is directly linked to performance and the perceived ability to sustain that performance in the future.
MLB Performance and Evaluation Trends
Complementing this understanding of the MLB arbitration system are important trends and transformations in the thought around evaluation and performance measurements in baseball. Here, the post-Moneyball environment and the information revolution have brought about many changes.
Three emergent categories in this transformation are advanced metrics, batted-ball data, and Statcast. The first of these was the earliest entrant into the baseball information revolution, gaining prominence in the late 20th century and producing hallmark sabermetric statistics. The main achievement of these advanced metrics was removing bias from conventional measures and isolating the individual contributions of players. This has led to more precise evaluation of talent levels and the underlying skills possessed by baseball players.
The second and third classes of data — batted-ball information and Statcast data — consist of information on player and ball movement during games. These statistics do not evaluate the outcomes of any given play but instead provide data on a player’s strength, speed, and skills. These metrics further divorce skills from outcomes and are particularly relevant for arbitration cases as players and teams may be able to point to underlying skills (or defects) as indicators of a player’s value rather than using outcome-oriented data that may be biased by the presence of other players in data events. In contrast to sabermetrics, the availability of Statcast data is highly regulated and asymmetrical. While some Statcast information is publicly available, a large number of data and measurements are only available to teams. Therefore, Statcast is not admissible in arbitration hearings and is not used in this study.
Nonetheless, the impact of Statcast data on baseball trends is important to note. Since Statcast was introduced in 2015 — in the middle of the season — it provides a natural experiment for changes in player performance and valuation due to changes in the data landscape. As an example, the Statcast metric “Launch Angle” measures the angle of a batted ball. With the increasing availability of these data and research showing fly balls to be more productive in run-scoring, many hitters have altered their swings to add loft — a trend that is perceptible in the non-Statcast measure fly-ball rate. Thus, while Statcast data are not used in this study, the impact of Statcast may be observed through other metrics that reflect changes in player behavior.
Literature Review
By and large, the previous literature that drives this study falls into two major categories: models for evaluating free-agent contracts based on performance statistics and evaluations of the FOA system.
Modeling Compensation with Metrics
Wasserman (2013) examined non-performance indicators of free-agent compensation such as player-agent influence, market size, and month of signing. In this study, Wasserman controlled for player performance using an aggregate measure of player value — Wins Above Replacement (WAR) — and found that performance is significant in predicting salary at the 1 percent level in all regressions. Building upon this work and breaking down WAR into its component measures would show which metrics are better indicators of compensation, yielding a more robust examination of the correlations between performance and compensation. In addition, breaking down WAR into component parts would allow this study to trace changes in valuation and compensation of various skills over time.
In this realm, Pollack (2017) has examined the relationship between various metrics and compensation. Pollack’s approach was novel in that it examined only arbitration contracts and free-agent contracts signed the year previous to their inclusion in the dataset, thereby isolating the year-over-year change in salary. In this study, Pollack found a significant relationship for on-base percentage and isolated power with compensation. Furthermore, by examining the individual annual cross sections for the effects of OBP and ISO, Pollack found that OBP’s effect on salary relative to ISO had grown over time, evidencing a more analytic approach to compensation, as OBP is heralded as the poster-child of the Moneyball revolution. Extending this work to arbitration salaries and isolating the effects of more advanced metrics such as weighted runs created plus (wRC+) could reaffirm Pollack’s conclusion.
FOA and Alternative Dispute Resolution
The second body of literature relevant to this study situates the MLB arbitration system in the context of other alternative dispute resolution (ADR) mechanisms. Scholars such as Carrell and Manchise (2013) compare FOA to more traditional interest arbitration methods, citing the advantages of FOA in promoting compromise and early settlement due to the winner-take-all structure. The arbitration hearing presents the evident risk of losing the entire difference between salary bids rather than settling on a midpoint.
Monhait (2013) builds on these claims, pointing to the effectiveness of the FOA system at inducing settlement as evidenced by the fact that from 1974 to 1993, only 9 percent of eligible players completed the process with a hearing. The frequency has been even lower in recent years, with only 2.5 percent of players who filed for arbitration going to a hearing in 2011 and no players entering a hearing in 2013.
Twenty years earlier, Burgess and Marburger (1993) found that team victories in arbitration hearings led to salaries 9 percent lower than comparable players who settled, and that player victory led to salaries 14 percent higher than comparable players who settled. This theory adds to Carrell and Manchise’s argument that the potential to lose salary through an arbitrated decision may nudge the sides toward early settlement.
The two main claims made by this paper are anchored by key texts in the previous literature. First, recognizing that sabermetrics have influenced the thoughts of negotiators and valuation of players, this study demonstrates that the effect of advanced metrics on salary has grown in recent years. Second, while large gaps in salary filings reflect large gaps in valuation and longer roads to compromise, I argue that given the constraints of FOA, players entering a hearing bear the risk of losing large sums of money and therefore settle early when the difference in bids grows.
Data Overview
The data drawn for this study consist of pooled cross-sectional data aggregated from two major sources — MLB Trade Rumors and Fangraphs — and contains arbitration filing information and performance indicators for all players who filed contract figures for arbitration in a seven-year period from 2011 through 2017. The performance statistics are lagged one year, such that a player’s value in year t will be evaluated using performance in year t-1. While considering career averages for statistics is an alternate option for evaluation, arbitration-eligible players often face higher variation in year-over-year playing time. As such, the best indicator of a player’s projected usage during the span of the one-year arbitrated contract is his usage in the preceding year. Overall, this creates a population of 269 players used in the analysis: 146 pitchers and 123 batters.1 The majority of players in the population are only present for one year and do not reenter the arbitration process. Only nine players entered the arbitration process the traditional-maximum three times and no players reached the Super Two maximum of four arbitration filings.
The variables contained in the data consist of descriptive variables — Name, Year, Team, and Position — and filing data taken from MLB Trade Rumors’ annual arbitration tracker, which aggregates arbitration filings and settlements. These filing variables contain both the Team Filing and Player Filing, as well as Midpoint, Settlement Amount, Bid Difference, a binary variable for arbitration hearings, Hearing Outcome, Salary in year t-1, Service Time, and a binary variable for Super Two status.
The performance metrics themselves are drawn from Fangraphs and contain four main categories. First are traditional counting statistics such as at-bats and hits for batters, and innings pitched and strikeouts for pitchers. The second group consists of rate statistics, which are averages such as ERA or weighted averages such as slugging average. The third group consists of sabermetrics that employ advanced mathematical methods in their calculation. These include weighted on-base average (wOBA) for hitters and batting average on balls in play (BABIP) for pitchers. The final group consists of batted-ball data such as ground-ball percentage and contact rate. Ultimately, this yields a set of 59 variables for pitchers and 43 variables for hitters.
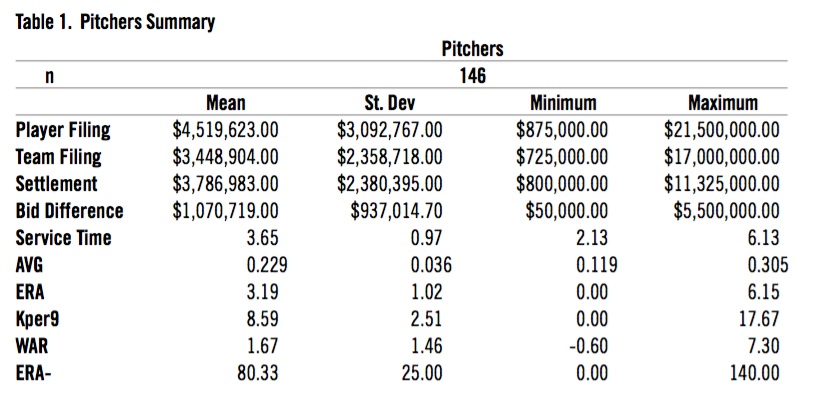
Table 1: Pitchers Summary
(Click image to enlarge.)
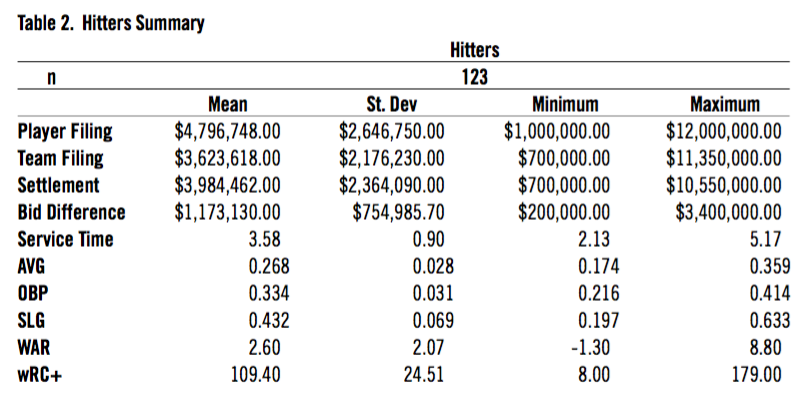
Table 2: Hitters Summary
(Click image to enlarge.)
Summary and Descriptive Statistics
Table 1 and Table 2 compare salary filing, settlement information, and select performance metrics for pitchers and hitters, respectively. Generally, the group of hitters has slightly higher salary filings and settlements than pitchers, with the mean settlement for hitters being just over $4 million and the mean settlement for pitchers at $3.7 million. Both groups had average bid differences of around $1 million and settlements for either group were just below the midpoint between the two bids (i.e. closer to the team filings). In addition, both groups had mean service times of around 3.6 years, indicating that the average player is entering the arbitration process for the first or second time. This comes as no surprise given that players with more service time may have signed long-term contracts; teams sought to avoid incremental annual raises and players sought long-term guarantees of money.
In terms of performance, the group of players filing for salary arbitration exhibits noticeable variation from average players. Pitchers have pitched to an ERA of 3.19 and an ERA- of 80.33. As such, the mean pitcher in the population has an ERA 19.77 percent better than the league-average pitcher.2 In terms of WAR, this sums to 1.67 wins above a replacement-level player over the course of a season.
The average hitter has a triple-slash line (average/on-base average/slugging average) of .268/.334/.432 and a wRC+ of 109.4, indicating performance 9.4 percent better than the average major-league hitter. These hitters have produced a mean WAR of 2.6, commensurate to a solid starting player. Clearly, the average player entering the filing period of the arbitration process is better than the average MLB player. This may be a case of selective sampling, since only good players are tendered contracts and offered the option to enter arbitration. However, it could also be an indication that better players are relatively more willing to challenge their teams and seek higher salaries rather than settling early.
Table 3 examines the group of players who entered an arbitration hearing. Here, pitchers followed the arbitration process to completion more frequently than hitters: 21.23 percent of pitchers in the population went to arbitration hearings, compared to 11.29 percent of hitters. Pitchers also lost their hearings more frequently than hitters, only winning 13 of the 31 cases (42 percent), while hitters won seven of 14. The average award in these cases was $3.4M for pitchers and $4.2M for hitters. When compared to the entire group of players who exchanged salary figures, the mean settlement through hearings for pitchers was roughly $300,000 lower than the overall mean settlement. For hitters, the hearing settlements were roughly $200,000 higher than the overall mean.
Table 3: Arbitration Hearing Summary

(Click image to enlarge.)
Empirical Considerations and Model Design
Given various qualities of the data such as small sample sizes, repeated cross sections, and potential for omitted variable bias, many considerations must be made in developing an effective empirical strategy and in designing a model. Considering these factors, the first two models below analyze why players and teams choose arbitration hearings over settlement, and the final model attempts to identify growing skill premiums and the dollar-value of performance indicators.
Predicting Likelihood to Enter Arbitration Hearing
For the FOA models, particular considerations must be made for the independent variable, as there are multiple methods for constructing the regressor. First, the absolute difference in bids can be useful in determining how larger differences and a perceived gulf in filings impact hearing likelihood. However, this introduces bias from large contracts, which naturally have larger gaps in salary filings. This bias can be controlled through the inclusion of a dummy variable for the size of the contract.
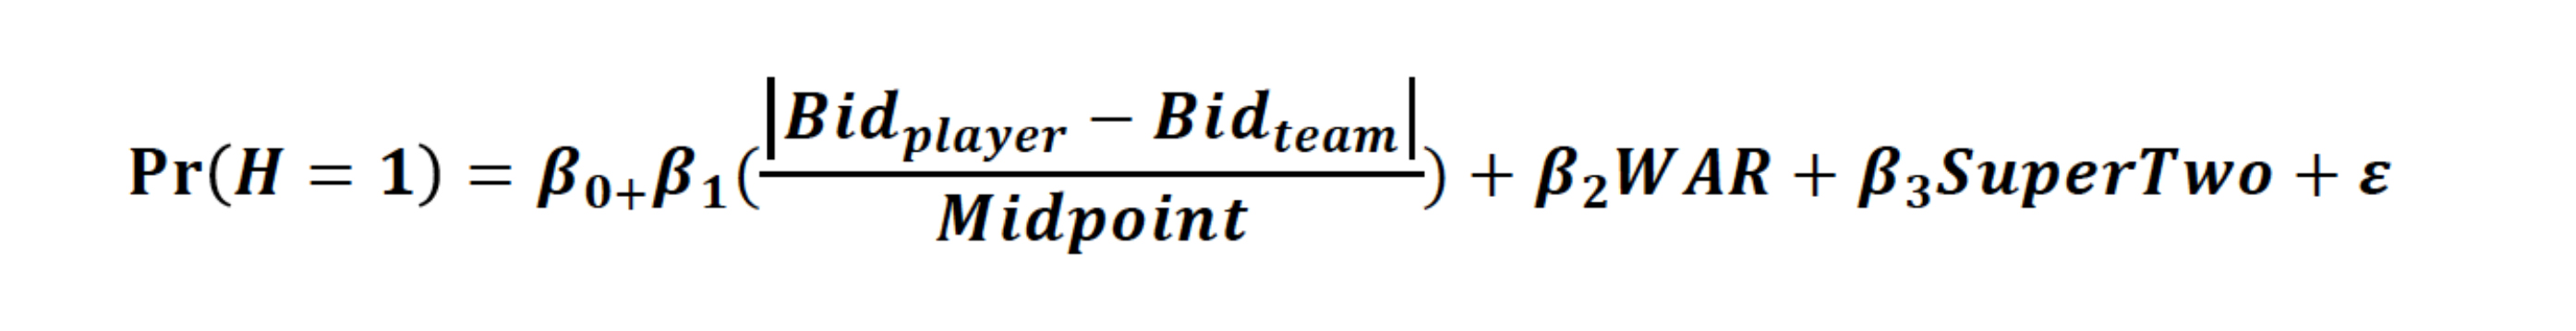
To address additional omitted variable bias, further control variables are placed for performance — assuming that the quality of performance affects a player’s arbitration incentives — and for Super Two status — assuming that the level effects of early arbitration have an effect as well. This yields the following model, where the probability of a hearing is dependent on the coefficient multiplied by the absolute difference between bids plus the effects of the controls:

Alternatively to the absolute difference regressor, using a relative independent variable that measures the bid difference relative to the size of the contract combines the effects of contract size and bid difference into one variable. The controls for WAR and Super Two status remain, yielding the following model:
Relationships between Measures of Player Value and Salary Filing
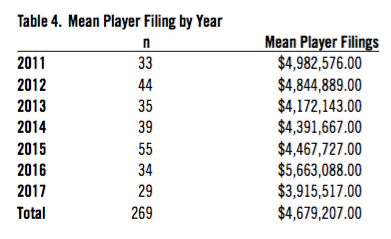
For the performance metric valuation models, the high level entry and exit of players between each annual cross section necessitates considerations in the empirical approach. Table 4 illustrates the two main problems with conducting regressions at an annual cross section level to measure changes over time. First, compared to pooled data, each individual year may not have enough observations to provide insight on the relationships between performance and salary. Second, inconsistent variation in mean filing between years may surround the data in too much random noise to decipher trends. The peak mean filing was in 2016 at $5.66 million and the lowest was the next year, 2017, at $3.92 million. A remedy to these problems is to use three-year rolling periods as opposed to annual cross sections. This method allows proper analysis by creating a larger sample size in each period and also tunes out sample-related noise by pooling adjacent years together.
Table 4: Mean Player Filing By Year
(Click image to enlarge.)
Furthermore, the risk of multicollinearity between independent variables must be considered as well. As players with strong performance in some areas likely have strong results in others, using multiple performance variables in the same regression may bias coefficients and reduce significance. As an example, a player with low ERA would likely also have a low FIP (fielding independent pitching). Including both of these variables in the same regression would dilute the effects of either measure on salary and reduce the accuracy of the model.
In order to isolate the values of individual metrics and skills, each independent variable must be tested for its effect on salary in separate regressions. This comes with some limitations, as the explanatory power of each coefficient may not be precise. However, by comparing the fit, standard errors, and coefficients for each independent variable across regressions, the model can provide some insight on which metrics are more relevant in determining salary than others.
These two major considerations produce the following model, where a regression for each individual performance metric S is repeated five times, restricting each iteration to a different three-year rolling period in the data set:
Here, the dependent variable being considered is not either bid, but rather the settled or arbitrated salary. The model allows us to measure whether — the dollar value of a one-unit increase in performance metric S — has changed over time. If the literature is true, then the and statistical significance for advanced metrics are expected to rise in more recent periods.
To address omitted variable bias in these regressions, controls are placed for service time and for positional adjustments. Since players generally receive strong raises for each year regardless of their performance, players with more service time will naturally have higher salaries, and controlling for this in model becomes crucial.
For positional controls, certain positions are frequently paid more lucratively than others. For example, while starting pitchers and relief pitchers may have similar levels of performance as measured by ERA, the starting pitcher would be compensated more due to his higher utilization. In addition, certain forms of production are more valuable from one position than another. Since most first and third basemen have higher offensive profiles, each marginal unit of offensive production is less valuable from these positions.
The most effective method to create these positional controls is to create a dummy variable for relief pitchers in the pitcher regressions and a dummy variable for defense-premium positions in the hitter regressions. Here, the selected defense-premium positions are catcher, second base, and shortstop. While center field is also considered a defense-first position, many outfielders play games at multiple outfield positions and therefore the entire group of outfielders is not considered defense-premium.
Results
Testing these models, the results indicate strong risk aversion by both teams and players, significantly affecting the likelihood to enter an arbitration hearing. In addition, the results show the proliferation of advanced analytics and skill-based over outcome-based valuation of major-league players.
Examining Likelihood to Go to Hearing
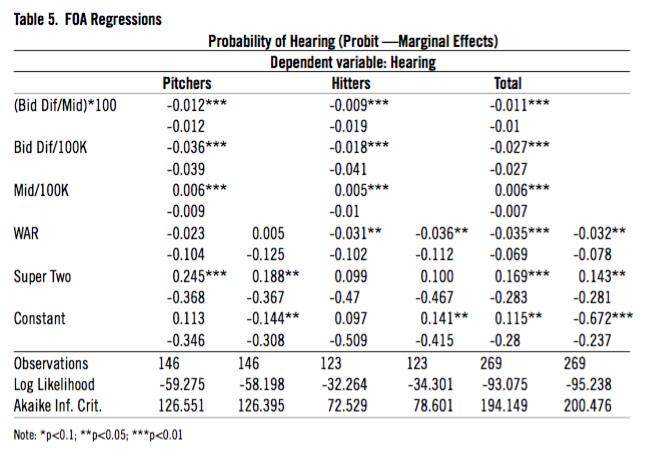
As seen in Table 5, both models — measuring the bid difference either relative to contract size or in absolute terms — demonstrate highly significant negative coefficients, indicating that players with large gaps in salary filings are less likely to enter hearings. In fact, in the aggregate sample of players, an increase of $100,000 in bid difference reduces the likelihood of a hearing by 2.7 percent and a 1 percent increase in bid difference to midpoint ratio decreases the likelihood of a hearing by 1.1 percent. These figures present an incredibly significant effect considering only 16.73 percent of players in the sample even made it to a hearing. Quite evidently, teams and players are incredibly risk-averse and fear losing the arbitration hearing and being forced to agree to a suboptimal salary. Therefore, the incentive to settle is driven up by higher bid differences.
Table 5: FOA Regressions
(Click image to enlarge.)
Furthermore, in the aggregate sample, an increase in filing midpoint by $100,000 increases hearing likelihood by 0.56 percent. As such, all else equal, players with higher filing midpoints are more likely to head to a hearing. By contrast, WAR has a negative coefficient. Therefore, while WAR indicates that better players are less likely to head to a hearing, the positive coefficient on midpoint states that “better” players are more likely to head to a hearing.
Though these indicate opposite effects, considering the effect of a high midpoint with WAR constant and vice versa, the theory provides explanatory qualities. A player with a high bid that inflates the midpoint — holding performance constant — is more likely to head to an arbitration hearing. Most likely, the group captured here is players with poor levels of performance but an aggressive salary filing — an easy candidate to be challenged in a hearing. By contrast, an increase in WAR — holding contract size constant — makes players less likely to go to an arbitration hearing. This likely indicates that good players are privileged during the arbitration process, given more time and effort in negotiations, and offered more opportunities to settle early.
The final variable of interest in these regressions is the control for Super Two status. The models indicate that Super Two status increases the likelihood of hearings substantially, by 14.3–16.9 percent, depending on the model. As such, these young players seem more likely to challenge their teams on salary evaluations. This too comes as no surprise since challenging a team in a player’s first (and bonus) year of arbitration eligibility can lead to significant level effects in subsequent arbitration hearings. A salary increase from the league minimum of $545,000 to even $1 million can snowball into much larger raises in the following years.
Interestingly, Super Two pitchers are even more likely to enter an arbitration hearing, 18.9–24.5 percent more likely than non-Super Two pitchers. One likely explanation is that pitchers are far more susceptible to injury and therefore are more likely to be non-tendered in subsequent periods. As a result, pitchers may challenge their teams more while their performance is commensurate to a higher salary, securing earnings in the immediate term.
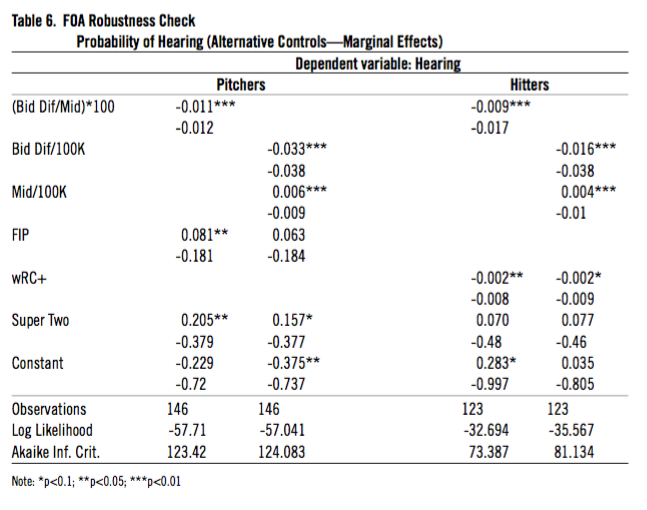
As a final robustness check on the effect of salary filings and bid differences on likelihood to enter trial, the initial specifications were tested with an alternative performance control, seen in Table 6. FIP for pitchers and wRC+ for hitters were chosen as metrics related to and as components of WAR, but still incomplete measures of total performance since they do not aggregate other factors of performance measurement like WAR does. With these controls as well, the coefficients on the variables of interest retain their signs, significance, and relative size. Even with alternative and incomplete controls, the effect of risk aversion continues to dominate the decision on early settlement versus an arbitration hearing.
Table 6: FOA Robustness Check
(Click image to enlarge.)
Factors Affecting and Correlated with Filings
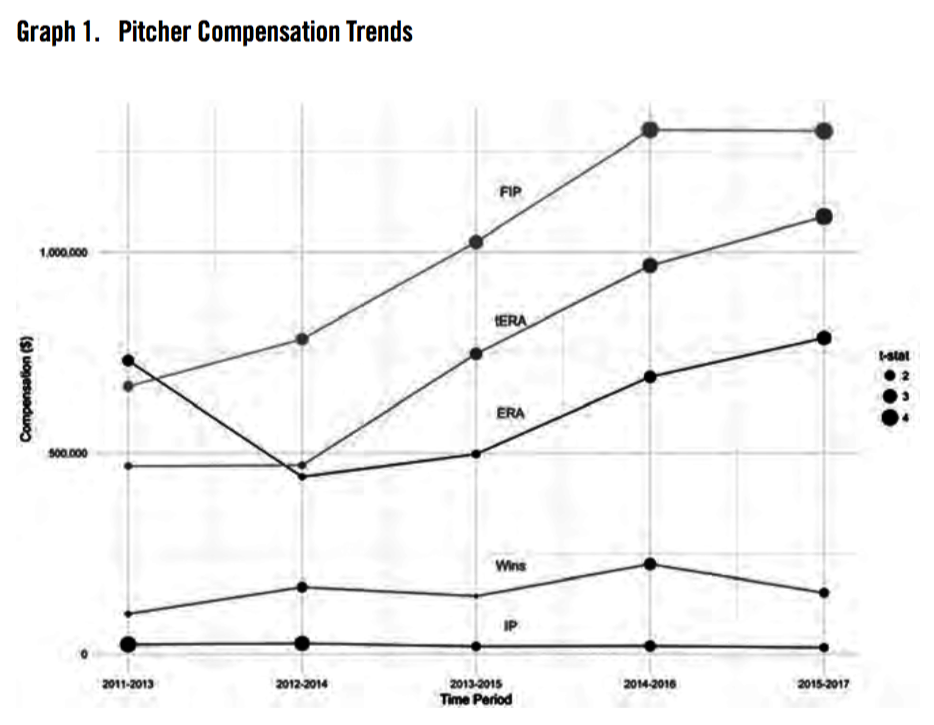
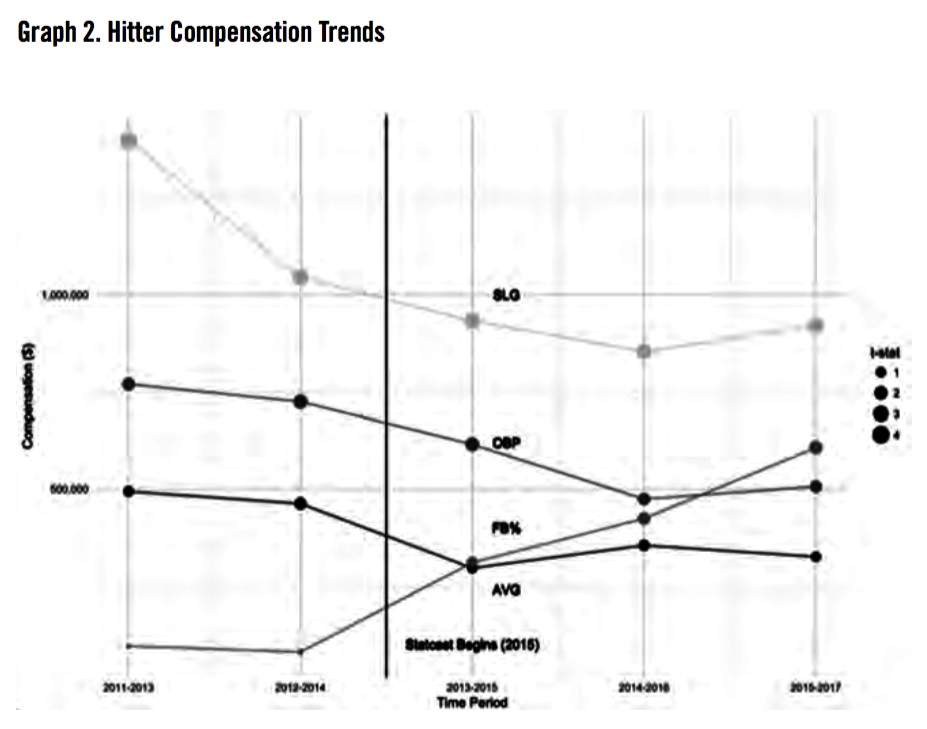
Examining the salary filings themselves, players and teams seem to be incorporating more skill-based evaluations, using advanced metrics to determine player value. For both hitters and pitchers, conventional measures of value are slowly being replaced by sabermetric and batted-ball alternatives that emphasize more precise evaluations of talent rather than evaluation of outcomes. The results from the regression here are displayed in a line graph in order to demonstrate the changes in coefficients over time and to allow comparison of the compensation effects of various metrics. Graphs 1 and 2 illustrate the relationship of select metrics with salary over time. The vertical position of each point shows the dollar value per unit of production for the given metric — its value — while the size of the point shows the statistical significance of these metrics — the accuracy in predicting salary.3 Essentially, metrics with a high statistical significance are linked closely to salary and are useful tools for predicting salary; metrics with high dollar values are worth more per unit.
For pitchers in particular, the evidence points toward the fact that traditional measures of pitcher success and durability such as innings pitched, wins, and ERA have fallen in prominence compared to alternatives such as FIP and true ERA (tERA).
As seen in Graph 1, the relationship between innings pitched and salary decreases over the periods examined with each additional inning being worth $23,460 in the first rolling period but only $15,770 in the last period, representing a 33 percent decline. In addition, the significance of the coefficients drops as well from above 99 percent significance initially to 90 percent significance at the end.
Graph 1: Pitcher Compensation Trends
(Click image to enlarge.)
This decline in the relationship between IP and salary can perhaps be attributed to the growing dominance of relievers and short leashes on starting pitchers. As dominant relievers such as Dellin Betances, Zack Britton, and Kenley Jansen have entered the sample of arbitration-eligible players, the emphasis on innings pitched and workhorse-style durability has waned in favor of effectiveness in run prevention. And while relievers are still compensated at a lower level than starting pitchers, their influence on the game’s strategy — leading to shorter starts and more “bullpenning” — has manifested in a reduction of the effect of IP on salary.
In addition to this, other traditional metrics of pitcher value — wins and ERA — have seen middling and inconsistent relationships with salary in the rolling periods. These metrics have seen their relationship with salary vary inconsistently between periods with total insignificance in some years and strong relationships in others without any distinct pattern. As such, while wins and ERA may have some influence on salary, there is a possible indication that other factors and measures may have a more influential effect.
What then has replaced IP, wins, and ERA? Alternatives such as FIP and tERA.4 FIP only takes into account the factors a pitcher can control, excluding all cases in which the fielders interact with the outcome of a play — thereby acting as a more skill-oriented version of ERA. While FIP was significant in the earliest period, its significance grew from 95 percent to above 99 percent in the final period, evidencing an increasingly strong relationship with salary. Much more starkly, the compensation for a one-unit change in FIP changed from $665,375 in the earliest period to $1,299,270 in the ultimate period: nearly double the effect. By comparison, the effect of a unit change in ERA — measured on the same scale as FIP — was level at around $750,000 across all rolling periods.
True ERA (tERA) attempts a similar method of evaluation but instead of entirely ignoring fielding, it incorporates effects of batted-ball data, crediting pitchers who are able to produce weak contact — thereby representing an even more skill-oriented version of FIP. Here, the effect of tERA makes a more remarkable climb than FIP, beginning at 90 percent significance and a $467,407 effect per unit on settlement and ending at a 99 percent significant, $1,087,499 effect per unit. As such, pitcher skills such as inducing groundballs and producing popups have been compensated well, even when conventional and biased measures of success may not indicate value. Teams have begun to compensate the peripherals and potential for success rather than the incidence of success itself.
For hitters as well, the movement away from traditionally valued statistics is evidenced in trends. Examining the traditional triple-slash statistics each demonstrates a different impact on salary. In Graph 2, average showed insignificant coefficients in any given period and revealed relatively smaller coefficients, evidencing that high-average hitters are not compensated strongly. On-base average factors in walks and hit-by-pitches and is compensated slightly more per one-standard deviation change. OBA is also significant at least at the 90 percent level, reflecting the post-Moneyball evaluation of players in which OBA has replaced AVG as the conventional measure of offensive prowess. Finally, slugging average evidences the strong relationship between compensation and power. In the first period, SLG was compensated at $1,397,602 per standard deviation, nearly twice the value of a unit of OBA or AVG. Clearly, power hitters are valued strongly; this has not changed dramatically over the course of time.
Graph 2: Hitter Compensation Trends
(Click image to enlarge.)
In fact, alternative methods for evaluating power hitters — or even potential power hitters — have become more significant in salary settlements. Fly balls are highly valuable for hitters and hitting the ball in the air consistently is a mark of a highly skilled player. Fly balls are more likely to fall for an extra base hit or home run, and even in the worst-case scenario where they result in an out, fly balls can still drive in runs via sacrifice flies. As such, fly-ball rate can be used as a proxy for run-producing potential even when SLG might not capture the actualized run production. As seen in Graph 2, Fly-ball rate has made a dramatic change in correlation with salary. Initially, FB% had weak correlations and insignificant coefficients, with a 1 percent increase equating only $94,503 in additional salary. However, in the most recent period — and post Statcast introduction — a 1 percent increase in FB% resulted in a $606,693 rise in settlement and is significant at the 95 percent level. This follows a similar pattern to the tERA trend where teams and players are able to isolate and effectively leverage tools that are correlated with success even when this success hasn’t been measured.
The fly-ball rate case itself may be a manifestation of a trend in baseball data in the Statcast era, the “fly-ball revolution.” Beginning with the introduction of Statcast, the compensation for higher fly-ball rates began to take off. Recently, high profile names such as J. D. Martinez and Justin Turner made marked differences in their career paths by adding loft to the ball; fly balls are in vogue in baseball. Increased compensation for fly-ball heavy hitters through the arbitration process is the most recent manifestation of this. Even though the Statcast measure cannot be deployed in an arbitration hearing, its effect can be felt through proxies such as fly-ball rate, furthering evidence of the growing impact of advanced metrics and modern strategies on salary.
Conclusions
Clearly, when it comes to arbitration hearings, risk aversion seems to be a dominant factor in considering whether to head to an arbitration hearing or settle early. Teams and players are unwilling to risk the difference between their bids when this gap increases and are thus brought together toward early settlement. This stands as a testament to the success of the final-offer arbitration system in promoting compromise. And while controversial hearings — such as those of Stroman in 2018 and Betances in 2017 — characterized by passive-aggressive Twitter rants and inflammatory media statements will always occur, these are by and large an exception to the trend in arbitration. The arbitration system promotes a convergence in bids, and when this convergence doesn’t exist, compromise becomes all the more important. Good players are privileged with greater emphasis on striking accord early, outlandish bids are challenged, and young players are ready to take risks. All evidence a healthy and functional system.
Furthermore, in terms of the proliferation of advanced metrics and analysis in the evaluation of players, the general buckets of valuable skills have not changed: run prevention for pitchers and power for hitters are still valued at a premium. However, the tools and measures used to evaluate these skills have certainly changed over time. Less of a premium is being placed on outcome and more on ability. And with increased tools to measure these capabilities, players are being rewarded for the potential to achieve even when the actual achievement may not reach commensurate levels. Relief pitchers are being rewarded for their effectiveness at higher rates despite limited innings pitched. Batters are being rewarded for factors correlated with power rather than the true incidence of power itself. Clearly, both teams and players are becoming much smarter in their evaluation and in their presentation of cases to arbitration panels.
Revisiting the three cases above — Betts, Stroman, and Schoop — the implications of the AL East’s arbitration story lines are evident. Betts was not the most likely candidate to head to an arbitration hearing; the $3 million difference between Betts and the Red Sox was incredibly high and reflected an enormous risk for either party entering a hearing. Furthermore, as one of the best right fielders in the American League, Betts’ case likely drew significant attention from Boston and was unlikely to hurtle toward a hearing. The predicted path for Betts was likely closer to Schoop’s one-year deal or a long-term contract that bought out his arbitration eligibility. By contrast, Stroman may represent the classic arbitration case: a low-risk hearing for either party, bargaining over a small fraction of their bids. And while Stroman expressed his frustration on Twitter following the hearing, history shows that the Stromans of the world will likely end up there again. Ultimately, the final-offer arbitration system does its job: Those who disagree widely tend to work toward compromise, while those who disagree only a little take a chance and roll the dice.
NAVNEET S. VISHWANATHAN is a recent graduate of Georgetown University where he studied International Economics. A former Baseball Operations Intern for the San Diego Padres, Vishwanathan currently works for a major consulting firm in Washington, DC. He is passionate about labor economics and trade and is keen on pursuing a career in the baseball industry. Vishwanathan presented his research on arbitration at SABR 48 in Pittsburgh in June 2018. He can be contacted at navneetv54@gmail.com.
Works cited
Tyler Wasserman, “Determinants of Major League Baseball Player Salaries,” Surface (Spring 2013), https://surface.syr.edu/honors_capstone/99/.
Brian Pollack, “What Gets Paid? Analyzing the Major League Baseball Contract Market” (honors thesis, Duke University, 2017), https://dukespace.lib.duke.edu/dspace/bitstream/handle/10161/14325/Pollack2017.pdf?sequence=1
Michael Carrell and Louis Manchise, “At Impasse? Consider Final Offer Arbitration,” The Negotiator Magazine, December 2013-January 2014, http://negotiatormagazine.com/pages.php?a=AR637&p=1.
Jeff Monhait, “Baseball Arbitration: An ADR Success,” Journal of Sports & Entertainment Law 4, 2013. http://harvardjsel.com/wp-content/uploads/2013/06/Monhait.pdf.
Paul L. Burgess and Daniel R. Marburger, “Do Negotiated and Arbitrated Salaries Differ under Final-Offer Arbitration?” Industrial and Labor Relations Review 46, no. 3, April 1, 1993, https://doi.org/10.1177/001979399304600307.
Notes
1 Jarrod Parker (Oakland, 2015) was omitted from the analysis despite filing for salary arbitration and losing his hearing against the Athletics since Parker underwent Tommy John surgery and did not play in 2014, the year preceding his arbitration hearing. David Ortiz (Boston, 2012) was omitted since he did not enter the arbitration process as a conventionally arbitration-eligible player but as a free-agent who elected arbitration over entering free-agency.
2 100 (Indexed League Average ERA-) -80.33 (ERA- for population)=19.77%.
3 For rate statistics, one unit of production is equal to a one standard deviation change in the metric.
4 While both tERA and Skill Interactive ERA (SIERA) incorporate the effects of batted-ball data in their evaluation of pitchers, tERA is used in this analysis over SIERA since SIERA is applied in more prognostic and predictive contexts while tERA is used to evaluate past performance compared to a traditional ERA.