

First-Generation Player Contracts: An MLB Success Story?
This article was written by Barry Krissoff
This article was published in Spring 2015 Baseball Research Journal

Like most businesses, major league baseball (MLB) owners strive for optimizing profits by expanding revenue and limiting costs. Clearly, recent revenues have significantly increased with larger attendance, pricier tickets, the sale of MLB merchandise, and most importantly the growing and sizable television contracts. With revenue rising, it has been easier to negotiate with the Major League Baseball Players Association and share the larger economic pie and avoid costly shutdowns. Player salaries account for the majority of costs, consequently owners continuously look for ways to minimize financial outlays but still maintain the quality of their individual teams.
A recent approach to accomplish this goal is for owners to sign multiyear contracts with players that have limited or no major league experience. The Atlanta Braves have been particularly aggressive in this approach. The Braves signed shortstop Andrelton Simmons, first baseman Freddie Freeman, outfielder Jason Heyward, and pitchers Julio Teheran and Craig Kimbrel, all under 26 years old, to multiyear contracts starting in 2014 and totaling a combined $280 million.1 Simmons and Teheran have less than two years of major league experience. The Braves’ objective is to have these players locked up under contract during their prime playing years.2 Other teams have signed $100 million plus extensions with their star players for seven to ten years or longer to keep them under team control possibly for their entire careers (Andrus in Texas, Braun in Milwaukee, Cabrera in Detroit, Kershaw in Los Angeles, Longoria in Tampa Bay, Stanton in Florida, Tulowitzki in Colorado, Votto in Cincinnati, Zimmerman in Washington to name a few).
In making these contractual decisions, owners and players are explicitly recognizing the rules of the game—the reserve rule under the Basic Agreement which limits mobility of players with less than six years’ experience—and their risk return trade-offs. For the owners, the objective is to retain players who have the potential to contribute significantly to their teams in future years and who would have otherwise become free agents, but limit their future salaries. The owner must weigh the probability of future success of the player. If the owner negotiates a multiyear contract and the player’s performance is stellar, then the owner succeeds. However, if the player does not make the grade and/or is cut from the major league team, then the owner loses.
The players are on the opposite side of that equation. By signing a multiyear contract, they are locking in a $30 or $40 million payout, for example, but giving up the uncertainty of a much higher contract in the future (if they become superstars) or not having a major league contract at all (if they become busts). For players, who are likely to be more risk-averse than the wealthy team owners, the trade-off of the certainty of the $30 to $40 million contract may often be preferred. After all, the first $30 to $40 million that a player can earn on an early multiyear contract provides more utility than a potential extra $30 to $40 million when the player is already earning $100 million or more.
In this article we scrutinize the extent that teams are adopting the early signing of players and assess whether this approach has been successful. We examine first-generation contracts for pre-arbitration and arbitration (reserve rule) players relative to the contracts of established free agent players. We test the hypotheses that the negotiated first-generation contracts have a salary trade-off “discount” relative to comparable quality free agent players and whether the salary discount is smaller or larger when the first-generation contract extends into free agency.
Baseball fans know that first-generation players get paid less than free agents. But is this still true when we control for similar performance levels and contract lengths? If it is, how much lower are salaries of first-generation players? What about the first-generation player who chooses to sign a multiyear contract into free agency? If he is compensated less than a comparably skilled free agent player, the signing of early contracts is a successful cost-savings approach by team owners.
We believe our paper extends the literature in several important ways. First, we systematically compare the multiyear contracts of first-generation and free agent players focusing on the average yearly constant dollar value of the contracts, the number of years of the contracts, the players’ performance for both batters and pitchers, and player and team characteristics. Descriptive statistics based on these variables offer a first pass at understanding the growth of first-generation contracts as a new business strategy for team owners. Secondly, we analyze the factors that contribute to variation in salaries for first-generation and free agent players who have signed multiyear contracts. We estimate salary and length of contract equations dependent on the status of the player, performance metrics, and player and team characteristics.
In our estimation procedure, we evaluate the magnitude of the salary discount that first-generation pre-arbitration and arbitration players may receive relative to each other and to free agent players. Our approach is similar to previous studies.3 Here, the discount is separated into two components: (1) estimates of the markdown generated by MLB monopsony power due to the reserve rule and to players’ risk-return trade-offs for multiyear contracts and (2) estimates of any additional salary deviation reflecting an extension of contracts into free agency. A first-generation player agreeing to a contract spreading into free agency chooses to postpone possible future negotiations with any major league team for a potentially much higher salary.
In our model we use the total contribution a player makes towards winning, in both offense and defense, as a performance statistic, Wins Above Replacement (WAR).4 Additionally, we consider the character of the negotiation process by including the role of sports agents in influencing the value of the contract. Popular press frequently makes reference to a sports agent or agency having a significant effect on salary determination. Our period of study is 2003–14, a time of relative harmony between ownership and players.
A Look at the Data: First-Generation versus Free Agent Multiyear Contracts
MLB teams and first-generation players negotiated well over three hundred multiyear contracts worth around $7.4 billion over the 2003 to 2014 period.5 There are almost as many first-generation as free agent contracts, although MLB teams have greater flexibility on whether to sign multiyear contracts under the reserve rule relative to the free agent players. The average annual salary for first-generation contracts is $5.1 million in constant 2010 dollars for batters and pitchers. There is a considerable range—see the box and whisker plot in Figure 1. Some of these players signed modest major league contracts directly out of school while others had major league experience and were close to free agency. Former Texas Rangers outfielder Julio Borbon averaged $400,000 for his four year 2007–10 contract, although he did not reach the major leagues until 2009. In contrast, perennial all-star Detroit Tiger Miguel Cabrera averages $18.1 million for his eight year 2008–15 contract. After attaining over five years of major league service, Cabrera agreed to the contract rather than waiting for his free agency eligibility.6
Pitchers generally received smaller contracts than batters, about 10 percent lower than the average batter’s contract, nearly $4.9 million. On the low end, Brian Matusz was a highly rated draft selection by the Baltimore Orioles who penned a four-year major league contract, 2008–11, for an annual average remuneration of $870,000. Matusz did not join the major league club until 2009. On the high end, San Francisco Giant Tim Lincecum tallied $19 million in 2012 in a two-year contract. Lincecum initialed the agreement when he had slightly over four years of major league experience and has subsequently reached an agreement for a two-year extension for 2014 and 2015.
Figure 1. MLB Salaries
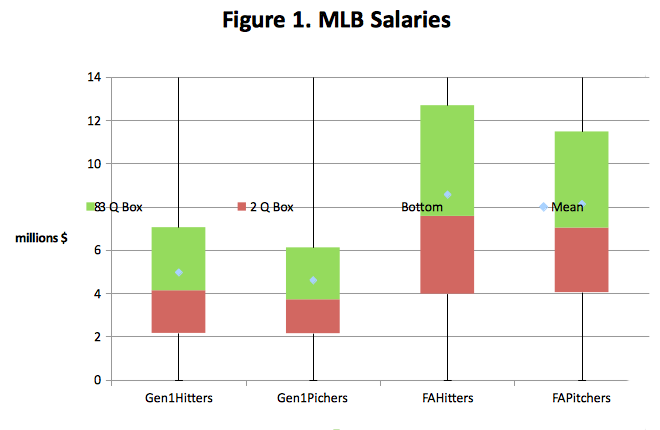
The second set of box and whisker plots in Figure 1 show the distribution of salaries for batters and pitchers that are eligible for free agency with multiyear contracts. Free agent players are able to negotiate with any team and this unrestricted capability allows them to compete for a market equilibrium salary. Comparing first-generation and free agent player contracts reveals some anticipated outcomes. First-generation players are paid about 60 percent of what free agent players are compensated on average. Hence, this implies the approximate value that first-generation players are willing to accept in order to gain the certainty of a multiyear contract and known salary, given that they are constrained by the reserve rule. Similarly, this is the approximate future savings to owners by locking in players to a multiyear contract early in their careers rather than facing an arbitration process or competing for them in the free agency market. Of course, this assumes that the players are of equal value in their achievements, which is the subject that we turn to now briefly and in more detail in the empirical section to follow.
Generally, better performing players receive higher compensation. To confirm this, we divide first-generation batters and pitchers into quartiles based on their annual salaries. For each quartile the average salary and performance metric Wins Above Replacement (WAR) are calculated (Table 1). Many consider WAR to be the most comprehensive measure of a player’s contribution to winning.7
Table 1: Salaries ($millions) and Performance of Players with Multiyear Contracts, 2003–14

Obviously, actual performance is an uncertainty at the time of signing the contracts. Team owners and players base their contract negotiations and decisions on projections and/or prior performance. Our expected performance metric is calculated as the three year WAR average prior to the year of the contract.8 If there was no prior experience, then the WAR achieved for the number of playing years under contract up to the 2014 season was used. For example, for Pedro Alvarez’s 2009–12 contract, we used a WAR of 1.33 reflecting his performance over the 2010–12 seasons rather than a WAR of 0 since he had no playing time prior to the contract or in 2009. Thus, we made every effort to evaluate first-generation and free agents on an equal footing.9
As anticipated, performance tapers off as we move from the higher to the lower salary quartiles. First-generation batters in the 4th quartile achieved an average WAR of 4.41 and command a salary of $11.2 million; batters in the 3rd quartile did not perform quite as well, attaining a WAR of 2.60, and earning $5.5 million. Similarly, WAR declines as we move from the third to the second and first quartiles. For pitchers, we observe a parallel pattern except the quartile salaries and performance levels are lower. We repeat the procedure for free agent players and again find that better performing players are paid higher salaries, at least on average.
Now, let’s turn our attention to comparing the quartiles across first-generation and free agent players. The first-generation salaries for batters are about 55 to 70 percent of free agent salaries and for pitchers about 45 to 70 percent of free agent salaries. Yet, when it comes to performance, we find that first-generation batters and pitchers have accomplished similar WAR levels to free agents. These descriptive statistics suggest the players signing a first-generation contract provide higher value on average to team owners, given their productivity levels compared to free agent players.
However, we need to take another step beyond the descriptive statistics to distinguish the variation of salaries attributable to a player’s status and other contributing factors. In particular, in the regression model developed in the next section, we present five status classifications: pre-arbitration, pre-arbitration where contracts extend into free agency, arbitration, and arbitration extending into free agency, and free agents, and isolate the differences in players’ salaries under multiyear contracts depending on their status for a given performance level, contract duration, and team and player characteristics.
The Model Framework
The basic model that we employ to explain the variation of major league baseball salaries is borrowed from the empirical analysis of Krautmann, Krautmann and Oppenheimer, Meltzer, and Link and Yosifov (KOMLY). We update and expand their estimated equation by concentrating on first-generation and free agent player multiyear contracts:

where RSal is average annual salaries in constant 2010 dollars over the length of a player’s multiyear contract, Status are the five fixed effects variables (designated as a 1 for each classification, 0 otherwise10), Perf is the player’s performance, Player (i), and Team (j) are specific characteristics of the player and team, Length is the duration of the contract, and ε εis an independently, normally distributed error term.
For performance, we focus on WAR and also plate appearances or innings pitched. We would expect that a player who has a stronger performance, plays more, and has a greater contribution to winning would be paid more than other players, the coefficients on β3>0, other things being equal. We consider four Player and Team variables: the strength of the hitting or pitching position, the sports agency of the player, the strength of the team at the time of the signing of the contract, and the geographical location of the team. Different batting and pitching positions contribute differently to a team’s success. First or third base, outfield or designated hitter for a batter and a starter for a pitcher are considered to be the stronger positions. We use dummy variables for the different batting and pitching positions with the strong position having an indicator that takes the value of 1, otherwise 0. We would anticipate batters and pitchers who play in the stronger relative to the weaker hitting positions of catcher, second base, and shortstop and weaker pitching role of relievers to receive relatively greater salary contracts.
Baumer and Zimbalist discuss the importance of team winning and the size of the local market in contributing to a team’s revenue.11 A team that is successful is more likely to achieve increased revenue and sign a potentially high-caliber player for a higher salary than a perennial losing team. For team winning, we use a three-year winning average prior to the player signing the multiyear contract. Teams in larger metropolitan areas such as New York, Los Angeles, Chicago, and Dallas/Fort Worth/Arlington have the potential to generate more revenue and therefore may be more willing to negotiate higher salary contracts than teams in smaller cities. For our second team variable, we examine the role of population in affecting players’ salaries.
To our knowledge the role of sports agents in propagating higher salary multiyear contracts has not been examined. Do specific sports agencies influence the signing of these contracts, their length and salary structure? There are around 160 sports agencies representing over two thousand baseball players.12 Some of these agencies are very large and not only represent baseball players and other athletes but also artistic entertainers. Some specialize in representing baseball players and have many clients. The Boras Corporation for instance has over a hundred baseball clients and represents some of the biggest names in the sport. Other agencies represent only a few clients. In interviews with baseball players conducted over several weeks prior to the 2013 season, players indicated the importance of interpersonal relationship, and business and legal acumen in selecting agents.13
Thus, some well-connected agencies may be better equipped to provide these attributes and have the prestige to negotiate higher salaries. Do Scott Boras’s comments at the 2013 Baseball Winter Meetings criticizing the large-market teams New York Mets, Chicago Cubs, and Houston Astros lacking lofty payrolls translate into higher salaries for his corporation’s clients, whereas this may not be the case for another sports agency?14 We test for whether four agencies (The Boras Corporation, Creative Arts Agency, Relativity Sports, and The Wasserman Media Group) with over 100 player contracts each affect salaries by again using fixed effects variables, 1 for each agency, 0 otherwise.
The length variable is problematic for both conceptual and statistical reasons. The expected sign on the coefficient is ambiguous. KOMLY observe that players who are expected to have stronger performances by team owners, are more likely to negotiate and receive more money and longer contracts implying coefficient β6>0. However, as discussed earlier, players may be interested in buying assurance of a long-term contract in lieu of compensation since they are likely to be risk-averse. KOMLY argue that players in essence purchase insurance by agreeing to a lower return on their productivity in exchange for the security of a long-term contract, implying that β6<0 (KO, page 8).
Secondly, contract negotiations simultaneously determine salary and length and hence, an ordinary least squares regression would yield a coefficient estimate that would be statistically inconsistent. To circumvent these issues, we estimate both salary and length equations using a two stage least square regression. In this procedure, the two independent variables, salary and length, are regressed on all of the independent variables. The estimated values for length are then used in the salary equation and the estimates for salary are used in the length equation.
The length equation is specified as:

where we use WAR as the performance variable and the player’s age at the time of signing the contract and the number of days on the disabled list as the player variables. As a player ages, we would anticipate that teams would be less interested in signing a longer term contract. Similarly, if in prior years the player exhibited a greater proclivity for injury, then we would expect shorter contract lengths. ω is an independently, normally distributed error term.
Empirical Results
Two stage least square regression results for batters and pitchers are presented in Table 2.
Table 2: Regression results

In the salary equation, the independent variables explain 60 percent of the variation for batter salaries and 66 percent for pitcher salaries. Our main interest is the β2 fixed effect coefficients for the first-generation players. These coefficients are all negative as anticipated implying that first-generation relative to free agent players, all of whom have agreed to multiyear contracts, receive lower salaries. For example, pre-arbitration batters who sign contracts into free agency earn $2.73 million less than free agents for a comparable performance level, contract duration, and player and team characteristics. This is even more the case for pitchers, who receive $4.4 million less than comparable free agents These players are trading off potential payoffs as future free agents for the certainty of a multiyear contract while they are under the reserve rule.
The pre-arbitration players who sign contracts into free agency also receive lower salaries than arbitration and pre-arbitration players who do not sign a contract into free agency. Here, we find that pre-arbitration pitchers and batters are receiving approximately $600,000 to $800,000 less in annual salary than their peers who do not sign contracts into free agency. The uncertainty of injury or not making the grade as a major leaguer prevails in their thinking and they are willing to make the trade-off of lower salary for the certainty of the multiyear contract. With the frequency of injuries to pitchers and the often needed Tommy John surgery, the willingness to take on the certainty of a multiyear contract for less money is not surprising, particularly among pitchers.
Arbitration players experience lower salaries relative to free agents as well. However, in contrast to the pre-arbitration players who sign contracts into free agency, the arbitration players who sign a contract extending into free agency reach agreement for a relatively small salary discount, $1.2 and $1.5 million for batters and pitchers relative to free agents. The proximity to free agency explains their stronger negotiating position.
The other arbitration players who do not sign a contract into free agency are willing to accept less money, $2.4 and $3.2 million for batters and pitchers relative to free agents, and accept the uncertainty of a higher payout when they reach free agency. For example, with four plus years of experience, Washington Nationals star pitcher Jordan Zimmermann was willing to sign a two-year $24 million contract in current dollars ($7.5 million in 2014 and $16.5 million in 2015) but not a longer contract into free agency. In assessing his skill level at or above the average arbitration player, Zimmermann might expect to surpass a $20 million annual salary in a multiyear deal ($16.5 million + $3.2 million coefficient multiplied by 1.09 conversion from constant 2010 to current dollars).
As for the other variables in the salary and length equations, their coefficients are generally significant and of the expected sign. The productivity coefficients β3 for WAR and plate appearances or innings pitched are positive and significant for both batters and pitchers. Batters in stronger hitting positions and starting pitchers receive more compensation than players in weaker hitting positions and relief pitchers, β4>0. Clubs that are more competitive in the three years prior to signing a ballplayer’s contract, show a positive correlation with salaries, β5>0.
We included fixed coefficients for four of the top sports agencies. The coefficients are mostly positive but none is significant. Batters who employ Scott Boras or Relativity as their agents may receive salaries that are approximately $700,000 more than other sports agencies. Scott Boras’s pitchers may attain $610,000 more than other sports agencies. The value of these coefficients suggests that there may be merit to the notion that particular sports agencies affect salaries, but the results are inconclusive and preliminary at this juncture. One difficulty in assessing the role of sports agencies is a lack of consistent data matching players with specific player agents and with agency affiliation at the time of signing a contract that might be several years old. Players change agents, agents change agencies, and agencies reconfigure into bigger or smaller entities. This is an area that may be worth future research.
The β6 coefficient on the estimated length variable is nearly zero and not significant. We expected this coefficient to be positive because players who sign lengthier contracts generally receive higher salaries. However, as discussed earlier, this may be somewhat offset since risk-averse players are willing to forego some of the higher salary for lengthier contracts.
As for the length equation, the α coefficients have the expected signs and are mostly significant. Salary and WAR are positively related to length; higher salaries and stronger performances are associated with longer contracts. In contrast, a player’s age and a greater incidence of injury are negatively related to length; teams are reluctant to sign older and more often injured players to long-term contracts.
Table 3 presents the salaries for first-generation and free agent batters and pitchers using the estimated regression coefficients at the sample means.
Table 3. Salary and Cost-Saving Estimates

(Click image to enlarge)
We observe from the table that the average first-generation players receive between 50 to 85 percent of free agent player salaries adjusted for performance level, contract length, players’ position, and team. Thus, our findings suggest that first-generation players are receiving lower salaries than free agents and the variation in the discounted salary depends on a player’s status at the time of signing the contract. An average free agent starting pitcher, who plays for a team in an average sized metro area and average winning percent receives an estimated annual average salary of $8.8 million in 2010 dollars relative to a comparably productive pre-arbitration pitcher who has a multiyear contract into free agency, $4.4 million, and a comparably productive arbitration pitcher who has a multiyear contract into free agency, $7.3 million.
In the fifth column of Table 3 we calculate the value of the multiyear contracts for first-generation and free agent players given the number of contracts in our sample and the number of years under contract for each player. This cumulative total of these multiyear contracts is approximately $18.1 billion. If the first-generation players are paid at the same scale as free agents, then their salaries would be $3.3 billion higher (Low Bar). If the pre-arbitration and arbitration players who signed contracts into their free agency received a commensurate salary to free agents for the years that the contracts extend into free agency, then their salaries would be nearly half a billion dollars higher (High Bar). For baseball’s team owners, the strategy of signing first-generation players appears to be a successful proposition. They are bearing the additional risk of these first-generation players not succeeding, but on average, we are finding that there is a cost savings and positive payout to ownership.
Concluding Comments
Our analysis has examined the recent trend of baseball owners assertively seeking multiyear contracts with highly touted players and those with limited major league experience. Owners have the incentive to sign these contracts to reduce the uncertainty of having to pay sizeable or, in some cases, extraordinarily hefty salaries to players in later years or lose a player to free agency. Players have the incentive to agree to these contracts to ensure a major league level salary for multiple years. Our descriptive statistics and analytical examination of these first-generation contracts compared to the salary contracts of players competing in the free agency market strongly suggests that this is an efficient strategy for team owners. The owners benefit by signing players to multiyear contracts with lower salaries, thus avoiding the arbitration years and/or free agency. The first-generation players receive an average salary of approximately 60 percent (and a range of 50 to 85 percent) of their free agent counterparts when we account for equal performance levels, length of contract, and player and team characteristics. A signing of Ryan Braun for 8 years at $45 million, of Bryce Harper for 5 years at under $10 million, or Paul Goldschmidt for 5 years at $32 million exemplifies the success of this strategy for team owners. For the Milwaukee Brewers the 5-year $10 million 2012–16 plus an option year contract for Jonathan Lucroy, with a batting average of over .300 in the 2014 season, an all-star selection, and 4th place finisher for MVP, looks like a particularly attractive signing. Of course, this is not to say that there are not exceptions. There are players who receive first-generation contracts who never make the major leagues or are very marginal at the top professional level. This is the risk trade-off the owners are taking. Nevertheless, we conclude that, based on the last several years of data, multiyear contracts for first-generation players seems to be well worth the risk for team owners.
Can the first-generation players work out a better deal? Max Scherzer may be at the vanguard of a new approach for the players. Over the 2013–14 winter, Scherzer turned down a $144 million extension offer from his team, the Detroit Tigers, a year before his free agency. Scherzer, like other first-generation players, is risk-averse and wanted to reduce the risk of injury or low quality performance but did not want to sign a Tiger contract that he felt was below market rate. Other entertaining performers, like singers and dancers, have purchased insurance to protect themselves from losing their voices or injuring their legs. Why shouldn’t baseball players search for insurance to protect themselves against injury or performance decline also? And this is exactly what Scherzer did—he negotiated with insurance providers’ assurance of a minimum payout in return for his paying an insurance premium. Scherzer may have been able to insure a salary of $144 million at a cost of around $14 million, a net of $130 million for Scherzer.15 In contrast, the 2014–15 off season open market may offer Scherzer $175 million or more given our estimate that first-generation contracts for pitchers signing contracts into free agency are 82 percent of free agent contracts ($175 = $144/.82). If we subtract $144 million from $175 million, Scherzer’s loss of signing a contract before free agency is $31 million. Clearly, opting to purchase insurance at a cost of $14 million is a more efficient approach than agreeing to a first-generation contract and not waiting for free agency.
The postscript to this story is that the Washington Nationals negotiated with Scherzer and his agent Scott Boras a 7-year, $210 million contract in January 2015. The annual payout is deferred to $15 million over a 14-year period, implying that the present value of the contract is $185 million. By obtaining insurance and waiting until he reached free agency, Scherzer was able to achieve a monetary gain of $41 million ($185–$144) less the estimated cost of insurance ($14).
BARRY KRISSOFF is an Adjunct Assistant Professor of Economics at the University of Maryland University College and retired senior economist at Economic Research Service, US Department of Agriculture. His research interest is on the business of baseball, with a current focus on the role of sports’ agents in the industry. His first article in the “Baseball Research Journal,” “Society and Baseball Face Rising Income Inequality,” was a finalist for the 2014 SABR Analytics Conference Research Awards in the category of Historical Analysis/Commentary. He continues to look forward to a World Series in Washington DC—maybe this is the year!
Appendix – Data
Our main source of data is from Baseball Prospectus’ Cot’s Contracts 2009–2014 (www.baseballprospectus.com/compensation/cots). It includes information on the player’s total and yearly salary under contract, the length of contract, the team he plays for, his fielding position, the number of years of major league experience, and the sports agent who negotiated the contract on behalf of the player. The contracts, which are in effect for the year 2009, start anywhere between 2003 and 2009, thus we have contracts originating as early as 2003. We use the guaranteed compensation including any annual salary, bonuses, and options. We do not include bonus incentives or salary if a team exercises an option since this occurs ex post to the contract. Performance statistics are also obtained from Baseball Prospectus. Major League Baseball was generous in supplying the data on the number of days a player was on the disabled list. Additional sources were used when information was incomplete, notably from Baseball-Reference.com, Spotrac.com, and MLBTradeRumors.com. MLB Trade Rumors, in particular, contained the most complete and up-to-date information on the various sports agencies working on behalf of the players.
Acknowledgments
The author appreciates the thoughtful review comments and suggestions from John Wainio and two anonymous peer reviewers, and the editorial assistance from Cecilia Tan, Clifford Blau, and Rod Nelson. We want to also acknowledge baseball websites, most notably Baseball Prospectus, for developing and making available large data sets. Of course, any errors that remain are the responsibility of the author.
Notes
1. Jason Heyward was traded to the St. Louis Cardinals November 2014 for a young promising pitcher, Shelby Miller, a relief pitcher Jordan Walden, and a minor leaguer.
2. Cameron, Dave. “Braves Lock-up Andrelton Simmons Keep Inflating Extensions.” Fangraphs, February 20, 2014 www.Fangraphs.com/blogs/ braves-lock-up-andrelton-simmons-keep-inflating-extensions.
3. See Krautmann, Anthony (1999) “What’s Wrong with Skully-Estimates of a Player’s Marginal Revenue Product.” Economic Inquiry, 37(2): 369–81; Krautmann, Anthony and Margaret Oppenheimer (2002). “Contract Length and the Return to Performance in Major League Baseball.” Journal of Sports Economics 3(1) 6–17; Meltzer, Josh (2005). “Average Salary and Contract Length in Major League Baseball: When Do They Diverge?” Unpublished manuscript Stanford University; and Link, Charles and Martin Yosifov (2012). “Contract Length and Salaries Compensating Wage Differentials in Major League Baseball.” Journal of Sports Economics 13(1): 3–19.
4. To our knowledge this has not be done with one exception. Cameron does a bivariate analysis of the total value of contract salaries and cumulative projected WAR over the contract for 2014 free agents, “A Basic Model of Free Agent Pricing” Fangraphs March 10, 2014, www.Fangraphs.com/ blogs/a-basic-model-of-2014-free-agent-pricing.
5. The estimate is derived from Cot’s Contract data 2009–13. It includes players with contracts as early as 2003 that extend into 2009 or later and players that have signed contracts between 2009 and 2013 including extensions. To the database, we added contracts that were signed right at or before the beginning of the 2014 season, but not those that were negotiated during or after the season. The appendix indicates a complete list of our data sources. We deflated annual salaries by the Consumer Price Index using 2010 = 100. All salaries are reported in 2010 dollars, unless otherwise stated.
6. Prior to 2008, Cabrera had one year contracts with the Florida Marlins. More recently, Cabrera and Detroit Tigers have agreed to an extension to 2023.
7. Baumer and Zimbalist refer to WAR as measuring marginal physical product although they express concern about the lack of industry standardization of WAR estimates from the three major sources, Fangraphs, Baseball-Reference, and Baseball Prospectus. Benjamin Baumer and Andrew Zimbalist. The Sabermetric Revolution, University of Pennsylvania Press, 2014.
8. For players with less than three year’s playing time, the average was calculated based on one or two years’ of experience. For players who were disabled for any of the three years prior to the signing of the contract, we assigned a WAR of 0 for the disabled year. This may understate the potential contribution of the player but it also may reflect the potential for injury during the length of the multiyear contract.
9. For a player who had no major league experience, we assigned a WAR of 0 and are likely understating their potential contribution. Since first-generation players are more affected by this limitation than free agents, we may be understating the contribution of first-generation players.
10. We use the four first-generation status variables in the equation, which are compared to free agent status.
11. Baumer, Benjamin and Andrew Zimbalist. The Sabermetric Revolution University of Pennsylvania Press, 2014. Other authors, such as Gennaro Diamond Dollar$ 2007 Maple Street Press, have a more detailed discussion of the value of a win in different regional markets.
12. Major League Baseball Trade Rumors, MLBTR Agency Database, www.mlbtraderumors.com/agencydatabase.
13. See for example, B.J. Rains “Why I Chose My Agent: David Wright” (March 13, 2013), part of a series of interviews conducted by Major League Baseball Trade Rumors, www.mlbtraderumors.com/2013/03/why-i-chose-my-agency-david-wright.html.
14. Ronald Blum. “Boras Blasts Mets, Cubs, Astros,” November 14, 2013 http://finance.yahoo.com/news/boras-bashes-mets-cubs-astros-122953166.html.
15. See Dave Cameron, “Max Scherzer and the Incentives to Self-Insure” Fangraphs June 9, 2014, www.Fangraphs.com/blogs/max-scherzer-and-the-incentives-to-self-insure.