

Historical Trends in Home-Field Advantage
This article was written by Cyril Morong
This article was published in 2003 Baseball Research Journal
From 1901 to 2002, the average seasonal difference between a team’s home-winning percentage and its road-winning percentage was .082.1 But has it changed much over the last 100 years and has the change been significant? What teams have enjoyed an especially good home-field advantage?
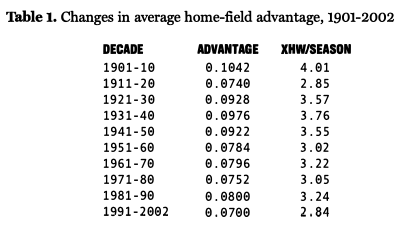
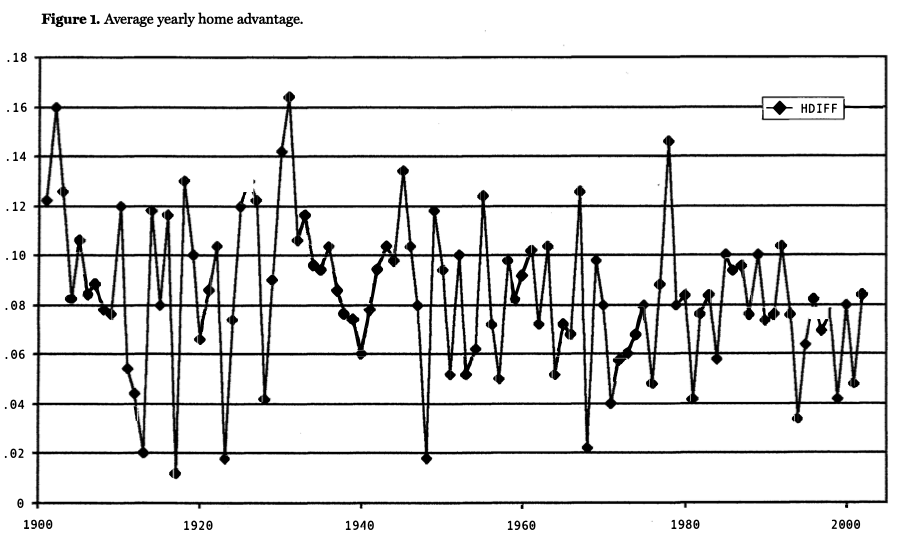
There is a slight downward trend over the century, but quite a bit of year-to-year variance. The average home advantage in 1931 was .164 and then fell rapidly and dramatically afterward. Then there is the huge spike to .146 in 1978, the biggest advantage since 1931. A decade-by-decade summary might be a little more interesting. This is given in Table 1 which clearly shows that the home-field advantage has declined over time.2
Yet the second decade has the second lowest average. So there is a trend, but anomalies as well. Has the change been statistically significant? Yes.3 But is it significant in a baseball sense? When the average advantage is .103, it means a home-winning percentage of about .552. When the advantage is .07, it means a home-winning percentage of .535. This difference over 81 games is 1.36 wins. I leave it to each reader to decide if that is significant in a baseball sense.
The third column projects how many more games a team would win at home above an even split. For example, in the first decade, an even split would give a home team 38 wins. But with a .1042 difference between their home and road percentages (a .552 home winning percentage), they would win 42.51 games at home. Decades from the 1960s on use 81 games.
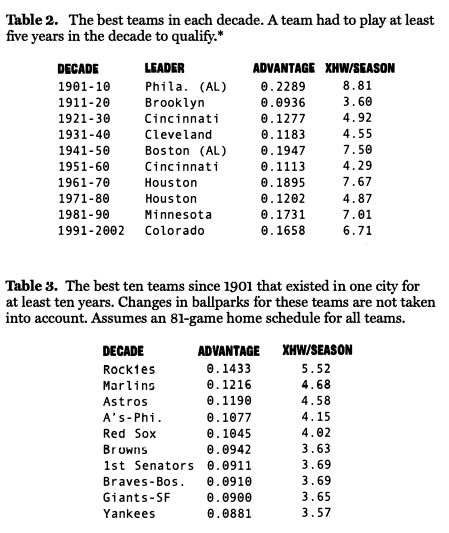
Homestands are not as long as they used to be, and teams now travel by plane. This might account for the historical trend. But notice that the difference between the 1940s and 1950s is not too great and that the 1980s was higher than the 1970s.4 The average from 1901 to 1950 was .091, and since it has been .076. This seems like a small difference.
The lowest home advantage belongs to the Baltimore Orioles, at .051.
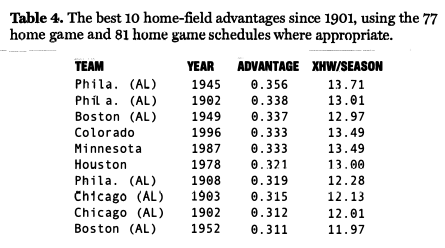
Has a big home-field advantage been an aid? Not really. The overall winning percentage of the teams with the 25 highest single-season home advantages is .492. For the 25 worst teams it is .498. The only one of the best 25 to win a pennant was the 1987 Twins.
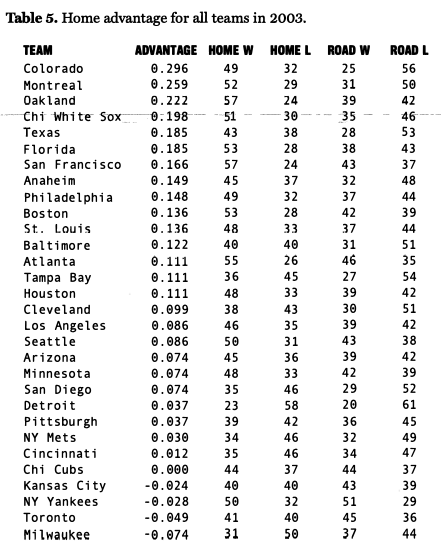
Despite the trend toward a lower home field advantage, 2003 saw a fairly big one. The average home field advantage was .099. There were also seven teams that had at least a .160 advantage, which is just about twice the historical average. With 23.33% of the teams being above the .160 mark, this is the highest percentage since 1986, when seven of the 26 teams were above .160. This past season was the 25th-highest percentage of teams going above .160.
CYRIL MORONG is a professor of economics at San Antonio College in San Antonio, TX. He is originally from Chicago and is a lifelong White Sox fan.
Notes
1. This is just a simple average, adding up every team’s single-season advantage and dividing by the number of team seasons. Seasons with longer schedules are not given extra weight.
2. Again, this is just a simple average. The overall home field advantage is added up for each of the 10 seasons and then is divided by 10. Seasons with more teams or games don’t get extra weight. The low figure for the 1911-20 period is not affected much by the Federal League, which had about a .084 advan tage during its two seasons.
3. Using the means test, the difference between the first decade and the last is significant, with a z-score of 3.97. Also, here is the standard deviation for all teams for each decade: 0.0914, 0.0848, 0.0769, 0.0787, 0.0857, 0.0855, 0.0831, 0.0837, 0.0773, 0.0810. This shows that the dispersion in home field advantage across teams has not changed much since 1901. The correlation between year and the average yearly h0me advantage is -.247. It has a t-value of -2.55, which is statistically significant.
4. The advantage listed for teams that changed parks in their respective decade only includes data from the park they played the most seasons in. Only one of those teams, the Indians of the 1930s, actually did not have the biggest advantage when only their most commonly used stadium was considered. The Reds would then actually be a little higher, at .1188. The following are the teams that changed parks and their home advantage for the entire decade: Philadelphia (01-10), .2021; Cleveland (31-40), .1234; Houston (61-70), .1783; Minnesota (81-90), .1438; Colorado (91-2002), .1433. For all of them, except Cleveland, they would still have the highest yearly average even if all years of the decade are used.