

Home-Field Advantage
This article was written by Matt Swartz
This article was published in Fall 2009 Baseball Research Journal
In every sport and at every level, the home team wins more games than the visiting team. While this is true in baseball, it is less the case than in other sports. Throughout baseball history, the home team has won approximately 54 percent of the games played. Nearly every aspect of the game has changed drastically over the past century, but home-field advantage has barely changed at all. Consider home-field advantage in each decade since 1901:
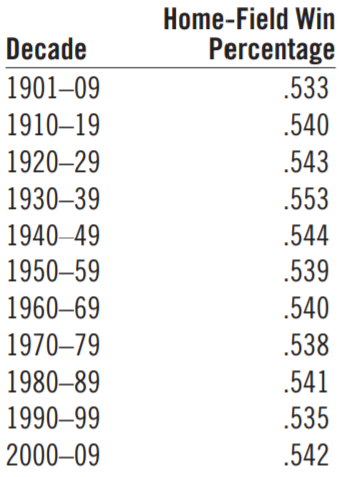
Although small decreases in home-field advantage have occurred at times, any incidence still represented a minute change relative to the large shift in nearly every other baseball statistic over the past century.
This should surprise analysts more than it does. Nearly every study of psychology with respect to baseball has revealed either small effects or none. We all know that players are human, but the numbers do not seem to indicate much of an obvious psychological aspect to the game. Hundreds of researchers have tried to discover clutch hitting, but few have found any evidence of its being a repeatable skill. Researchers who have tried to identify synergy effects have not found any evidence that certain players increase a team’s chance of winning. Some have attempted to look for the impact of veterans on playoff races and have not found significant effects there either. We have at- tempted all kinds of ways to splice the data to reveal a large psychological effect within baseball, to show that baseball players do not behave like statistical models, and there seems to be little evidence of any strong, detectable effects, even if we know they exist and occasionally can discover smaller ones.
The mantra that we chant as analysts is that talent trumps everything and that most of the stories of heroism and mental fortitude are narratives written by the winners. However, home-field advantage is perhaps the most obvious area where we see something resembling a psychological effect, or at least an effect that is not captured by our typical models of baseball players and ballgames. It is clear that something about being the home team trumps talent in a way that is mathematically equivalent to letting the away team’s best player compete for the home team.
The reason why home teams have an advantage is less clear. Do they feel more at home and so perform better? Does the crowd excite the home team or distract the road team? Do they know better how the stadium plays? Are they simply more comfortable at home? All of these explanations seem possible, and we could give a number of plausible explanations. Finding out why the home team wins more often could open the doors to measuring at least one area where psychology has an impact in baseball. Everybody knows that baseball players are not computers, let alone Strat-O-Matic cards. The mainstream media certainly dramatizes the purported impact of psychological effects on players, but there must clearly be some effect if the home team wins more often.
The first step is to figure out what exactly home teams are doing better. By determining which statistics show the biggest home-field advantage, we can figure out what exactly the home teams are doing to their opponents to consistently win more often than they lose. In this article I will discuss home-field advantage, asking what, when, where, and how and hopefully figuring out why home teams win more often. The first step is to explore how home and away teams distribute their runs across games, to see if this provides a sense of when home-field effects are the strongest.
SCORING BY INNING
Home-field advantage may come from the effects of comfort and familiarity, or it may come from the psychological effect of crowd support. If the effects come primarily from comfort and familiarity, we would expect that home teams would have an even more distinct advantage in early innings. If the effect is primarily psychological, one would expect that home teams would have an even more distinct advantage in late innings, when the crowd may put them on top.
The percent difference in runs scored by the home team as compared with the away team by inning is listed below. I ignored the ninth and any extra innings, because the home team stops scoring when they take the lead in extra innings or in the ninth inning, and the home team frequently does not bat in the ninth inning at all.

The home teams gain much of their advantage in the first inning and enjoy a greater home-field advantage in the second and third innings than in the fourth through eighth innings. This implies that home-field advantage is primarily about comfort and adjusting to surroundings.
It seems that, if comfort in familiar surroundings is a significant factor in home-field advantage, the effect of the first-inning run differential would be particularly strong in the first game of the series. However, this does not appear to be the case.

The effect of extra run-scoring early—particularly in the first inning—seems to hold throughout the series. This could be an indicator that players need to readjust to their surroundings each game when on the road, or it could be an indicator that adjustments starting pitchers make to the mound while on the road explains a large portion of home-field advantage.
Determining who on the diamond is significantly affected by home-field advantage is an important step in studying it. Knowing that home-field advantage seems particularly strong early in the game, regardless of series length, can be helpful. Consider this as we discuss individual statistics below.
ADVANTAGE BY STATISTIC
The Four True Outcomes. There are multiple individuals who play a role in the outcome of a plate appearance. First, the pitcher throws to the batter, and the batter either does or does not swing. If he does swing, he may or may not hit the ball. If he hits the ball, it may or may not be a fair ball in the field of play. It has been well established that pitchers have little control over what happens when the ball is in the field of play—pitchers primarily control walks, strikeouts, and home runs, and the rest is mostly a product of the defense and the hitter. In this section, I will discuss what happens when the ball is not in the field of play, to see how much of home-field advantage depends on pitching. All data are from cumulative major-league totals from 1998 through 2008, unless otherwise indicated.
Strikeouts and Walks. Batters struck out in 16.35 percent of their plate appearances at home from 1998 through 2008 and in 17.30 percent of their plate appearances on the road. Batters received unintentional walks in 8.38 percent of their plate appearances at home and in 7.80 percent of their plate appearances on the road. Both pairs of numbers are statistically significant at the 99.9 percent level. This immediately indicates that a home-field advantage occurs within the strike zone. Somewhere between when the pitcher starts his windup and when the batter swings, home teams already gain an advantage over road teams.
Home Runs. Batters hit home runs in 3.22 percent of their at-bats at home and in just 3.07 percent of their at-bats on the road. This is also significant at the 99.9 percent level. Home teams are able to hit for more power than road teams.
I selected strikeouts, walks, and home runs as the initial tests, because they indicate that the pitcher is involved. The significance of home runs, which pitchers control less than they do walks and strikeouts, indicates that the hitter also must be doing something better at home. However, without any more information, it is difficult to tell if the walks and strikeouts are only the products of home effects on hitters. For instance, it may be that, given enough time to prepare himself to pitch, the pitcher can overcome any disadvantage of being on the road while the hitter has an advantage at reacting to the baseball when at home. In other words, it is possible that travel or staying in a hotel dulls hitters’ reaction times but does not impede the pitcher’s effectiveness. That is why I now introduce the fourth true outcome— the neglected one on which fielders also have no effect.
Hit by Pitches. In every 1,000 plate appearances, home hitters were hit by 9.41 pitches and road hitters were hit by 9.09 pitches. This is a statistically significant difference (p=.016). While some hitters may be better than others at dodging inside pitches that are out of the strike zone, few can actually lean into the ball better. That hitters at home are hit more than hitters on the road indicates that some of the home-field advantage is affecting the pitcher. Getting hit by pitches is a persistent skill for batters, but it primarily derives from hugging the plate and not dodging inside pitches. Unless hitters hug the plate much more at home—and unless this effect somehow dwarfs any extra reaction time allowing them to choose to dodge pitches at home—chances are that this effect comes down to pitchers’ aim being worse on the road. While some of this may be the effect of umpires tending to award the base to a home batsman instead of ruling he made no effort to avoid the pitch, the 3.5 percent increase in the home team’s being hit by pitches is probably representative of a real difference generated by home-field advantage.
Balls in Play. When a ball is hit into play, defense becomes a factor. Some success on balls in play is the effect of how well the batter hit the ball, but much of it is also a product of defense. Looking at balls in play provides the first clue as to how defense plays a role in home-field advantage.
Batting Average on Balls in Play. Home teams had a .301 batting average on balls in play (BABIP) during the period 1998—2008, and road teams had a .295 BABIP. Furthermore, when you factor in errors, home teams reach base at a .316 clip on balls in play (or fail to reach base on 68.4 percent of balls in play), and road teams do so at a .310 rate (and so fail to reach on 69.0 percent of balls in play). When you factor in double plays, defenses at home record .720 outs per ball in play, and defenses on the road .713. All of these differences are statistically significant at the 99.9 percent level. It is clear that, at home, batters are able to reach safely more often. It is not clear how much of the difference in outs on balls in play is hitting and how much is fielding, so, for some clues, it may be useful to look at some indicators of defense.
Double Plays. Hitters ground into double plays in 2.92 percent of their balls in play at home and in 2.94 percent of their balls in play on the road. This is not a statistically significant difference. At first, that sounds like fielding may not be playing a significant role in home-field advantage, but then you realize that home teams have higher OBP than road teams (.342 versus .330), so they have more opportunities to bat with a man on first base. When I approximate opportunities—by looking at the number of singles, walks, batters hit by pitches, and batters reaching base on errors—that home and away teams have, the difference suddenly becomes statistically significant. The ratio of double plays at home to the sum of singles, walks, batters hit by pitches, and batters reaching on errors is 7.62 percent, and the ratio on the road is 7.96 percent. Although some of this may be the hitters’ fault for swinging at bad pitches or making weak contact, this does seem to imply that defense is better at home. As some of this may be umpires calling away-team baserunners out on double plays more often, it is useful to check on other aspects of fielding too.
Reaching on Errors. Official scorers, or so the accusation goes, give the home team credit for hits more often while recording as errors close calls involving road players. This may or may not be true, but it is highly doubtful that the reverse is true. Therefore, that home teams reach on error in 1.46 percent of their balls in play, and road teams on 1.42 percent implies that players on the road are fielding more poorly. The ratio of infield hits to the sum of infield hits and times reached on error is 70.3 percent for home teams and 69.8 percent for road teams. This is also not a statistically significant difference, which further suggests that official scorers are probably not all that biased. To me, this suggests that chances are that defenses perform worse on the road.
Doubles and Triples. Another potential source of home-field advantage is that outfielders at home know their parks better—they know how the ball bounces off the wall, etc. Many triples are the result of balls that get away from outfielders. Therefore, it should not be surprising that the rate of triples per ball in play is 7.59 percent for home teams and only 6.44 percent for road teams. That is a huge and statistically significant difference. In fact, the rate of doubles on balls in play for home teams is 6.81 percent, and 6.74 for away teams, a difference that is not even statistically significant (though it is weakly significant). The reason is that so many extra-base hits get away from outfielders and turn into triples; the ratio of doubles to triples is 9.0 for teams at home and 10.5 for those on the road.
Shutouts. Pitchers pitch complete-game shutouts far more often at home than on the road. Per every 100 games started, the home-team pitcher will throw 1.68 complete-game shutouts and the road-team pitcher will throw 1.18. Home teams win only 54 percent of total games but record 59 percent of the complete-game shutouts.
Unearned Runs. It may seem like much of this could still be psychological, but I believe that a large portion of it is not. Some of the reasons will become clearer later in this article. One indicator that much of home-field advantage is not psycho- logical is unearned runs. If psychology is playing a significant role, then chances are that it will cause pitchers to be more prone to frustration and let problems escalate. One way to test this theory is to check the ratio of unearned runs to the times that hitters reach base on errors. If pitchers are less likely to be collected on the road, they will probably let more of these runners score. In fact, the ratio for home teams is 0.98 and 0.99 for road teams. This is a very small difference. In fact, from 1998 through 2008, the home team had a higher ratio than did the road team six times out of eleven years and the road team had a higher ratio than did the home team five times. It does not seem like psychology is playing a role here. It’s not that road pitchers are allowing crises to escalate more; they are just finding themselves in more crises.
Stolen-Base Percentage. Home teams are more successful in their stolen-base attempts, nabbing bags successfully in 71.2 percent of their attempts, while road teams are successful in 69.4 percent of theirs. This is a strong statistically significant difference. It’s tough to know whether it is due to catchers reacting more slowly, baserunners running faster, or umpires being swayed by the home crowd when the call is close. For now, it’s enough to note that there is a clear tendency to steal more successfully while at home.
Batted Balls. A little bit about home-field advantage can be inferred from batted-ball statistics. Looking at data from 2005 through 2008, we can see that home teams hit more line drives (19.0 versus 18.6 percent) and fewer ground balls (45.1 versus 45.5 percent) than do away teams; they hit about the same number of fly balls. The differences in line drives and ground balls are both statistically significant. As ground-ball rate is something that pitchers control strongly, this also suggests not simply that pitchers enjoy the effect of home-field advantage but that they affect it. The batter plays a large role as well; this is clear from the statistically significant difference in popups per fly ball at home versus away (21.8 versus 22.2 percent), as infield-fly rate is something that batters affect more than pitchers do. Hitters do a little bit better on each type of batted ball as well. Look at the slash stats for each type of batted ball:

It is clear that home-field advantage affects each type of batted ball. It does not affect the batting average on line drives very much, but it certainly does affect the isolated slugging average on them. There are more triples than doubles, and there are a good deal more home runs as well (2.5 versus 2.0 percent). The home-run rate on fly balls is also a bit higher for home teams (9.2 versus 8.9 percent), and the rate of triples on fly balls is higher too (1.13 versus 0.95 percent). Ground balls find their way through holes more, leading to more singles (22.6 percent versus 21.9 percent of ground balls), more doubles (2.02 percent versus 1.89 percent), and more triples (.112 percent versus .086 percent). The relatively larger jumps in doubles and triples on ground balls indicate that a lot of home-field advantage is knowing how to play the bounces in your home ballpark.
It appears that home teams do pretty much everything better than road teams do. They hit the ball more, they hit the ball harder, they throw more strikeouts, and they surrender fewer walks. Home teams prevent triples more frequently and record double plays more often. They record more outs on balls in play, and they make fewer errors.
The extra home-field advantage in the first three innings strongly suggests that comfort and familiarity are significant to home-field advantage. The large effects within the strike zone indicate that the mound and the batter’s eye are things that pitchers and hitters are more comfortable with at home. The extra triples surrendered on the road strongly suggest an impact that ballpark familiarity has on home-field advantage. The extra stolen bases indicate that reaction time may also be playing a role. All of these numbers together indicate a large significance of mental aspects that are not quite emotional but that affect things like eyesight, reaction time, and learning about the home turf. That pretty much answers the question of what home teams are doing better.
Now that we know what home teams are doing better, our next step is to check differences between teams in terms of how much better they perform at home and to see if we can tell who has larger home-field advantages.
TEAM DIFFERENCES
On June 4, 2009, Cole Hamels shut out the Dodgers, who at that time boasted the best record in the National League. More impressively, this feat came in Dodger Stadium. As mentioned in the previous section, even though road teams scrape out a win in 46 percent of ballgames, they put together only 41 percent of all complete-game shutouts. What was special about Cole Hamels? Was it something about the Phillies? The first clue might have been that, at that point in the season, the Phillies had a 20—6 record on the road but were only 12—14 at home. The average difference between home winning percentage and away winning percentage is 8 percent; after Hamels’s shutout, the Phillies sat at —30 percent!
This did not seem to surprise the Philadelphia media all that much. The Phillies had a regular-season home-field advantage of only 4.9 percent in 2008, and in the previous four years they had home-field “advantages” of 6.2, —3.7, 4.9, and —2.5 percent. Relative to how they performed on the road, the Phillies played much worse at home than did other teams. Phillies manager Charlie Manuel had an explanation for the team’s 2009 performance at the ready—the fanfare surrounding the World Series celebrations was distracting them. There had been ceremony after ceremony through the first several weeks of the season, and, Manuel supposed, this was keeping his players from concentrating at home. Last year, Jimmy Rollins said that the Phillies fans had intimidated the home nine, and Rollins even went so far as to call them “frontrunners,” immediately giving every cable sports show the hottest topic in the world to run with for a few days. Would the Phillies fans boo Rollins when he came back to town? Were the Phillies fans and their anti-Santa agenda too much? Others suggested that the Phillies were a fly-ball pitching staff so were more vulnerable to the homer-friendly dimensions of Citizens Bank Park.
What complicated this speculation was that the Phillies’ 2 percent home-field advantage for 2004—2008 was contradicted by their 7—0 playoff record at home in their World Series run in 2008. They went only 4—3 on the road in the playoffs, meaning that their home-field advantage for the playoffs was 43 percent, more than five times the league average home-field advantage and more than twenty times their advantage over the previous five seasons. Was there something different about the playoffs?
Alternatively, perhaps there was nothing special about either the Phillies in the regular season or the Phillies in the playoffs. Consider the following possibility—perhaps no team has a larger home-field advantage than any other team. That sounds impossible, right? Look at the home-field advantage in the period 2004—2008 for every MLB team:

The Phillies had the smallest home-field advantage in the major leagues over that time. There was a huge difference between the Phillies and the Rays, who had a winning percentage that was nearly 18 percentage points higher at home than on the road. However, we would not expect that every team had a home-field advantage of exactly 8 percent, even if no team had any special home-field advantage; some teams would have some luck at home, or some luck on the road, and the numbers would change. So, I checked the correlation between home-field advantage one year and the next for 2004—2008—the correlation was only 0.05. That is not statistically significant, not even close.
Instead of running only a simple year-to-year correlation, I ran an AR(1) intraclass correlation (with some help from Eric Seidman and Russell Carleton). Intraclass correlation is similar to year-to-year correlation but gives some extra credit to the correlation if a team performs especially well at home in 2006 and 2008 but not in 2007. It looks at each team in general rather than at two consecutive seasons. The intraclass correlation was also only 0.05, which, again, is not statistically significant.
From this, it seems unlikely that any team has a significantly different home-field advantage than any other team, at least when looking at this recent five- year span. Although there is clearly a distribution of home-field advantages that vary from team to team, that is exactly what should happen if no team has a larger home-field advantage than another. If this theory holds true, any team should be expected to have an 8 percent home-field advantage next year, on average, regardless of what their home-field advantage was this year. It will not be exactly 8 percent but will just as likely be above 8 percent as below it.
These five years made sense as an initial starting point for looking at home-field advantage, because team composition does not change as drastically over five years as it does over a longer span. However, it is worth checking whether this does hold true over a span. Is the smaller sample size blurring an effect? I gathered the home-field advantage numbers for every team during 1998—2008 (the eleven-year time period in which there were 30 teams), and, using that data, I attempted to discover whether there was any persistence to home-field advantage; the correlation stayed low and insignificant, though it did rise to .102. Also, the intraclass correlation went up only to .104, which is weakly statistically significant and slightly more noticeable. It’s pretty clear that, if there is any persistence to home-field advantage, it must have a very small effect.
Numerically, even if a team posts a home-field advantage of 18 percent one year, you probably would expect them to have a home-field advantage of less than 9 percent the following year. As we will see below, even that may be too high.
Although the correlations are low, I thought it would be important to try some other angles to see if we can learn more about team-specific home-field advantage, if such a thing exists. The thesis that I am generating here is that the variance we observe in home-field advantage is exactly what we would expect if every team had the same skill at creating a home-field advantage. Therefore, it makes sense to check a chi-squared test to see if the variance is in fact what we would expect. A chi-squared test allows us to compare the expected variance we would expect if every team had an equal home-field advantage against what the observed home-field advantage was for the period 1998—2008.
To generate the expected variance, I found the winning percentage of each team over the eleven-year span and calculated the variance of their expected home winning percentage minus away winning percentage, to see if their home winning percentage was about 4 percent above their overall winning percentage and if their away winning percentage was 4 percent below it. The expected variance would have been 0.0166 according to this estimate; the actual variance was 0.0195. The chi-squared statistic is therefore 34.1, which is statistically insignificant. So, we fail to reject the hypothesis that there is no team-to-team difference in home-field advantage. In other words, the variance was only slightly above what we would expect if there was no such thing as team-specific home-field advantage.
Despite this result, it’s pretty clear that each test shows a positive but statistically insignificant effect of team-specific home-field advantage—which means that perhaps it does exist on some level. Over the eleven-year span, there is one team that has by far the largest home-field advantage of any club in MLB—the Colorado Rockies. They have a winning percentage that is 15.4 percent higher at home than on the road. This becomes even clearer when we look at the following chart, in which I plotted two things:
- the expected number of teams that would have approximately x percent of a home-field advantage over eleven years if there were no such thing as home-field advantage;
- the number of teams that have approximately x percent of home-field advantage for 1998—2008.
This makes it even clearer how anomalous the Rockies are.
Notice that one would probably expect to see at least one team around 2 percent, even though every team would expect to be at about 8 percent on average. What you would not expect is a team at 15.4 percent, as the Rockies are. The explanation for why the Rockies are an anomaly has been given countless times; the overwhelming likelihood is that, because of the difficulty in adjusting to the altitude and in getting accustomed to playing at that altitude, the Rockies gain an advantage over their opponents. Do these results reflect the Rockies’ ability to adjust to their altitude? Or do they reflect an inability of the visiting teams to adjust to normal conditions? The answer is not clear. However, it appears that the Rockies are a different breed altogether, and they seem to break the model. Consider the year-to-year correlation for 1998—2008 without the Rockies— that clocks in at .065, which is nowhere near statistically significant. The intraclass correlation of .068 among the 29 non-Rockies teams is even more insignificant than the .104 intraclass correlation with the Rockies included in the sample; it looks more and more like home-field advantage is not team-specific for the other 29 teams. Looking at it from another angle makes this even clearer.
When the Rockies are excluded, the expected variance of home-field advantage as described above would be .0160. Instead, it was .0138—even less (though in- significantly so) than we would expect if the outcomes were random. The Rockies truly are the anomaly.
Therefore, when analyzing home-field advantage, we should remember that every team except the Rockies has pretty much the same home-field advantage. Claims that crowds in different ballparks or that certain kinds of teams tend to generate a home-field advantage are below the threshold of statistical measurability. It is probably true that, if you get a ground-ball pitcher or a power hitter in a small ballpark, you are likely to increase your home-field advantage some, but these effects are probably extremely minor. It takes a long time for the difference between two similar percentages to show any kind of consistent trend, so we should be wary when approaching, after the fact, explanations for why certain teams have home-field advantages. There has been a tendency historically for domed home teams to do well in domed stadiums, for example, but most similar explanations will not hold water.
Although this result is perhaps somewhat shocking, it simplifies some of our analysis of home-field advantage for the rest of this article. We can now look for trends without worrying that our data is contaminated with large team-specific effects. After delving into the question of what home-field advantage is and who does or does not have it, we now need to consider where it might be the strongest. Specifically, what kinds of games exhibit the largest home-field advantages? We examine divisional matchups and both intra- and interleague matchups in an attempt to learn more about home-field advantage. In doing so, we know that we do not need to worry about certain teams (other than the Rockies) tricking us into reaching inaccurate conclusions, since it does not appear that the other 29 teams in MLB exhibit or enjoy any special home-field advantage.
DIFFERENT TYPES OF GAMES
Even though luck can make a team look like they are particularly good or bad at home, the 29 teams have about an 8 percent home-field advantage, plus or minus a little statistical noise. However, that does not mean that every game has about an 8 percent home-field advantage. In other words, if we know that the Yankees would beat the Dodgers in 52 percent of games they played against each other, we cannot infer that the Yankees would beat the Dodgers in 56 percent of the games at Yankee Stadium and the Yankees would beat the Dodgers in 48 percent of the games at Dodger Stadium. Certain types of games have a different degree of home-field advantage.
I took the 27,613 regular-season games from 1998 through 2008 that did not result in a tie and divided them into a variety of subsets to evaluate the different magnitudes of home-field advantage. This is important to study because, if we can understand where home-field advantage exists, we can better understand why home-field advantage exists and how it comes to be.
Home-field advantage is commonly attributed to the rigors of travel, which hinder the road team, and to the home team’s familiarity with the ballpark. Therefore, I took games played among teams within the same division and compared them to games played among teams in different divisions, since intradivision matchups occur more frequently and usually require less travel. Home teams win just over 53.3 percent of intradivision games, which means that they have a 6.7 percent home-field advantage. In contrast, inter-division games showed an 8.7 percent home-field advantage.
Although this seems like a large gap, it remains a little shy of statistical significance over the period 1998—2008. The problem with tests of statistical significance for this type of analysis is that, to find anything conclusive among minor differences, we would need to review many years to be able to pinch the variance enough that differences in home-field advantage were statistically significant. Doing so would risk losing meaning, by dipping into different eras where effects may be different. Instead, it seems safe to say that, since the confidence interval of intradivision games (52.4—54.3 percent) and the confidence interval for inter-division games (53.6—55.1 percent) barely overlap, intradivision games probably involve smaller home-field advantages. This may be either because road teams are more familiar with the stadiums of their most frequent opponents or because road teams suffer less when they travel shorter distances. In what follows, there will be some evidence of both of these factors.
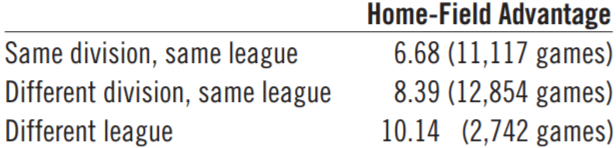
I also separated the home-field advantage for inter-league games and for intraleague games as well as for inter-division games within the same league. Inter-league games demonstrate a 10.1 percent home-field advantage, far greater than for intraleague games, which show a 7.4 percent home-field advantage, although the difference is still not quite statistically significant. Specifically, inter-division games within the same league have a home-field advantage of 8.4 percent. This indicates that distance effects, as well as familiarity effects, may be in play.
In summary, this means that we have the following home-field advantages:
Of course, interleague games may also have an extra home-field advantage, since the DH is in place only in AL ballparks (giving an added advantage to AL teams who construct their roster with this rule in mind) and not in NL ballparks (giving an added disadvantage to AL teams who construct their roster with a DH). Therefore, it is worth looking at different kinds of interleague games to determine the magnitude of this effect.
First I compared the home-field advantage in inter-league games among teams in the corresponding division in the opposite league (e.g., NL Central versus AL Central) to interleague games among teams in different divisions. The results came out rather clean; home-field advantage in the corresponding-division interleague games was only 7.95 percent, and home-field advantage in different-division interleague games was a whopping 13.42 percent. It certainly seems that familiarity may be in play, since the home-field advantage is smaller for same-division games within the same league (6.7 percent) than it is in corresponding division games in different leagues (7.9 percent), and it is also smaller for inter-division games within the same league (8.4 percent) than it is for different- division interleague games (13.4 percent).
Justification of the theory that familiarity is playing a role in home-field advantage comes from this. When I looked at “interleague rivals,” the home-field advantage came out very small. Since interleague rivalries have changed over time, it was not easy to define who was encompassed by this term. To determine what these rivalries were, I simply found the 14 NL teams that had played the 14 AL teams the most frequently (Angels and Dodgers, White Sox and Cubs, Rays and Marlins, Indians and Reds, Rangers and Astros, Mets and Yankees, A’s and Giants, Royals and Cardinals, Mariners and Padres, Twins and Brewers, Blue Jays and Nationals, Red Sox and Braves, Tigers and Pirates, and Orioles and Phillies). In those games, the home-field advantage is only 4.4 percent, even less than among teams in the same division in the same league. It certainly appears that familiarity is playing a role, since these teams play each other more frequently than do teams in other interleague matchups, although the lower home-field advantage here could also be attributed to the shorter travel distance.
The argument that this might be the effect of familiarity rather than distance strengthens when we analyze the three pairs of teams who play in the same metropolitan area—Yankees and Mets, Dodgers and Angels, Giants and Athletics, and Cubs and White Sox. Those matchups have an 11.8 percent home-field advantage, though in a sample of just 254 games. This also highlights another important fact, which is that crowd support is unlikely to be the primary cause of home-field advantage, since one would expect a smaller home-field advantage in a mixed-fan crowd. The same-city argument for familiarity over distance is not very conclusive, as the confidence interval for those types of games is really large (50.9—64.9 percent), but it does point to distance or familiarity, rather than crowd effects, as a factor, since even this large interval rules out the possibility that there is no home-field advantage in the same metropolitan area.
As these interleague-rival teams do not play each other any more often than do teams in different divisions in the same league, it seems that here too distance may be playing a role, since the home- field advantage is almost twice as large (8.4 versus 4.4 percent) in games between teams in different divisions of the same league as it is between interleague rivals.
Another argument for the effect of distance on home-field advantage is that games between teams that are in the same division but travel further show a larger home-field advantage than games between teams who do not travel as far. To define “further” I had to resort to a small trick—rather than determine the mileage between each of the 450 pairs of MLB cities, I gathered the degrees latitude and longitude for all 30 teams, and then used a formula provided by Tim Kniker for what he called “Great Circle Distance” to determine the distance between each pair of cities. The average distance in miles for teams within the same division was 597, which is the distance between Seattle and San Francisco. Games among teams within the same division who were less than 597 miles apart showed a home-field advantage of 4.2 percent, and for games between teams that traveled further than 597 miles, it was 8.4 percent. That is as large as the home-field advantage among teams in different divisions of the same league (8.4 percent).
So, we have learned from studying where home-field advantage exists that both travel distance and ballpark familiarity are probably significant causes of home-field advantage. We found clear effects of familiarity, as interleague rivals do better (even when geographically distant) than other interleague teams in corresponding divisions, while the argument of distance being the primary determinant of home-field advantage is slightly weakened when we consider that same-city interleague-rival games show a larger home-field advantage than do other interleague-rival games. We also found clear effects of distance. For example, home teams within the same division win more frequently when the away teams have traveled further. However, the differences in home-field advantage remain rather small. The difference between home-field advantage among intraleague games within the same division and between different divisions is less than 2 percent. Ignoring this and assuming that all games have an 8 percent home-field advantage will lead to your guessing wrong on only a couple of games more each year than you would have if you had known the small difference (in home-field advantage) between same-division and different-division intraleague matchups. Nonetheless, it gives us yet another insight into a home-field advantage. Since travel seems to be playing a large part in home-field advantage, in the next section we will look at home-field advantage in different games within a series as well as with different series lengths. We will also consider whether off days and consecutive series at home or away play a role in home-field advantage.
GAME NUMBER AND LENGTH OF SERIES
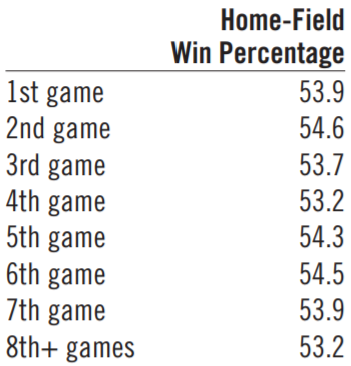
Since distance traveled has such a clear effect on home-field advantage, it leads us to wonder if the process of traveling has an effect—through jetlag and the like. This naturally leads us to ask whether home teams would have especially large home-field advantages in the first game of the series, perhaps because the road teams were adjusting after travel. In fact, this is not the case at all, as we see when we look at home-field advantage in different series games during the current thirty-team era.

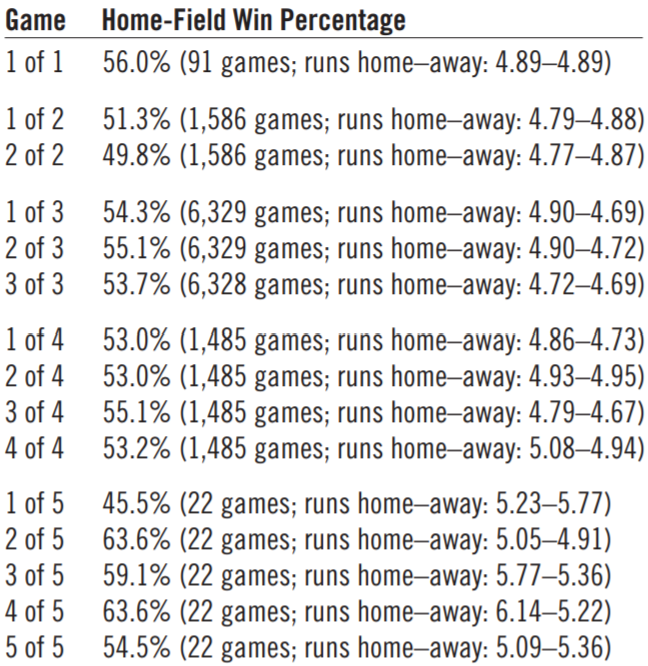
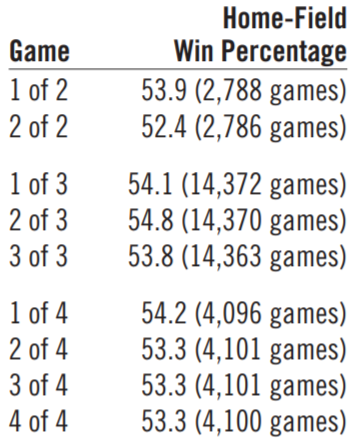
The middle games of the series are the ones that show the most pronounced home-field advantage, and by a statistically significant amount. The last game of the series does show the least home-field advantage, which is an indicator that the road team’s need to adjust to surroundings may be a part of home-field advantage. However, the first game has a smaller home-field advantage than the middle games is shocking, and it makes little sense when taken at face value. I still do not have a definite answer as to why this is true. However, I will present some clues as to what is happening. The term “middle games” obviously involves the conflation of a few different things, so let’s start by looking at home-field advantage by series length. In the period 1998—2008, there have been series that have varied from one game to five games. Here is the home-field advantage in each series length:

Two-game series have a statistically significant smaller home-field advantage, and three-game series have statistically significant larger home-field advantages (although that is probably only because interleague series make up 14 percent of all three-game series instead of only 10 percent of all series). However, that two-game series show less home-field advantage could be a clue.
Breaking things down game by game within a series, we can start to see the trend a little better.
Although it does not seem to be a significant clue, I will also include the average home score/away score because it may help readers discover something that I have not. Keep in mind that the home team does not bat in the bottom of the ninth if they are winning after the top of the inning, so they will have smaller run totals than you would otherwise expect.
None of these samples is large enough to generate statistical significance for any individual series game, but it’s plausible that the effect may occur the day before getaway day. If it does, is there something about travel days and off days that played a role? They might give teams the opportunity not only to settle themselves earlier in a different city but also to reset their rotation.
I checked whether home teams had a larger home-field advantage if they had an off day before the first game of the series. This effect was positive though not significant: 54.1 percent versus 53.6 percent (in 3,064 and 5,656 games, respectively). However, there was a statistically significant effect of having an off day on the road before the game; away teams won 47.6 percent of the 3,060 games when they had an off day the day before the first game of the series but won only 45.4 percent of the 5,660 games when they had no off day the day before game one. There is probably some travel effect on the first game but also some other factor that is playing a role toward the beginning of the series and making it easier for away teams to win.
I checked the effect of having an off day two days before game two of a three-game series. Interestingly, this helped home teams by a statistically significant amount: They won 56.8 percent of the 2,564 games in game two of a three-game series if they had an off day before the series began, and only 54.0 percent of the 3,764 games if they did not. The run totals demonstrate this further, as the average home team outscored their opponent in game two of a three-game series—by a score of 4.95—4.60 if they had an off day before the series but by a score of only 4.87—4.80 if they did not have an off day before the series.
Away teams, however, lost more often when they had an off day two games before the series, but by a small amount: 55.5 percent for the 2,569 game twos of three with an off day two days before, and 54.9 percent for the 3,759 game twos of three with no off day two days before. This effect does seem quite strong when looking at run totals though, as they were outscored 4.85-4.61 in game two of three if they had an off day before the series, and only 4.94-4.79 if they did not.
For the four-game series, there is a huge effect in the third game. This occurs primarily if the away team had an off day before the series began. In four-game series when home teams had an off day before, they won 58.2 percent of the 273 game threes. When they did not have an off day before, they won only 54.3 percent of the 1,211 game threes. That is not quite statistically significant. They outscored their opponents 4.90—4.41 in game three of four if they had an off day before the series, 4.75—4.73 if they did not have an off day before. However, what is statistically significant at the 95 percent level is that, if an away team has an off day before a four-game series, they lost game three 60.3 percent of the 290 game threes, but with no off day they lost only 53.8 percent of the 1,195 game threes. They were outscored 4.91—4.33 if they had the off day before the series, and were even, at 4.76—4.76, if they did not. This effect was even more extreme with an off day before a Thursday—Sunday series. Away teams lost 68.1 percent of the 144 game threes of four-game series that took place on Saturdays. This is statistically significant even at the 99.9 percent level.
My belief is that there is not only a travel-hangover effect but a different effect based on distance traveled, in addition to a “time away from home” effect. Home teams really do tend to do better in those middle games with an off day before the series, and away teams tend to do worse in middle games with an offday before the series. Although traveling earlier might help away teams get past jetlag during the earlier part of the series, it seems that, the longer the series goes, the more tired they get. I suspect that in the middle game they are still not fully recovered from travel and may also still suffer from being away from home, increasing the disadvantage for the away team in the middle of the series.
I also tried looking at actual travel distance. Recall that we found that intradivision games among teams who played closer together had a smaller home-field advantage. I decided to look at intradivision matchups for three-game and four-game series involving both closer than average distances and further than average distances.
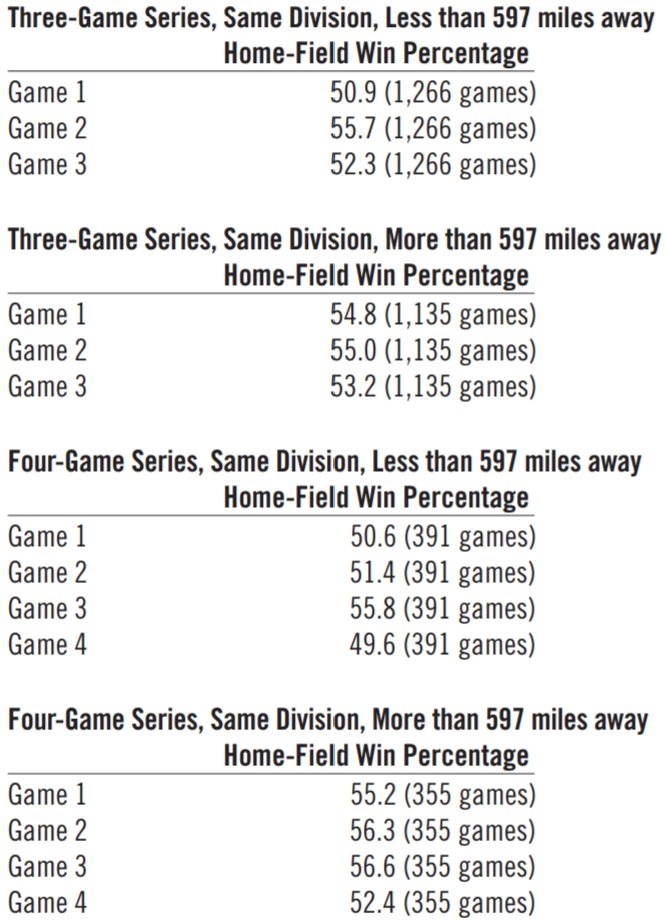
The day-before-getaway-day effect is significant only for games played between teams who are close together. In fact, if we look at inter-division games, we will see similar effects for those inter-division games where teams happen to be closer than 597 miles (although this is not a large set):
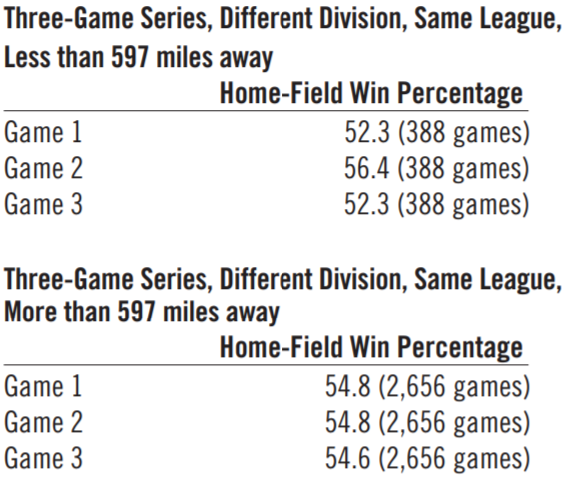
Although there are not many four-game series between teams less than 597 miles away but in different divisions, it is difficult to know whether a similar pattern would emerge whereby the day-before-getaway-day effect is significant only for teams that play in cities near each other.
That this effect holds only for teams playing closer together suggests that it depends on either mode of travel or travel distance. Perhaps something about the last game of the series shifts the advantage to the road team, but they struggle through the first couple of games. However, it may be that much of the effect on the first day is mitigated if the team traveled to the game on a bus rather than by plane, which would lead to jetlag. By the second game, though, regardless of the mode of travel, the effect of staying in a hotel tends to wear on players. It sounds a bit far-fetched, but there probably is something far-fetched that does explain this effect.
This could be a psychological issue as well, whereby road teams can generate the adrenaline to overcome some home-field advantage in the first and last game of the series but lose their steam in the middle games. I do not know for sure, but these effects generally point either to an effect on road teams that helps them early and late in the series or alternatively to a negative effect on home teams that hurts them both early and late in the series so that home-field advantage in the middle games appears greater. In reality, there may be several effects in play. Exhaustion from traveling longer distances and time away from home might lead to this bizarre outcome.
I wondered if the day of the week plays a role in home-field advantage, but what a review of outcome by day of the week suggests is that the home team’s edge seems mostly reflected by series length:

I suspected that the reason that the last game of the series may have a smaller home-field advantage is that it is more likely to be a day game, and therefore I suspected that road teams would have less of a disadvantage. However, Sunday games have larger home-field advantages than do Thursday games— which would probably not be true if night games are a cause of home-field advantage.
A natural question that many have asked is whether long homestands or road trips have an effect on home-field advantage. This does not seem to be all that significant. Consider the home winning percentage by the length of homestand:
Now consider the away winning percentage by consecutive games on the road:

Road teams do a little better early in a road trip than late, but only by a small margin.
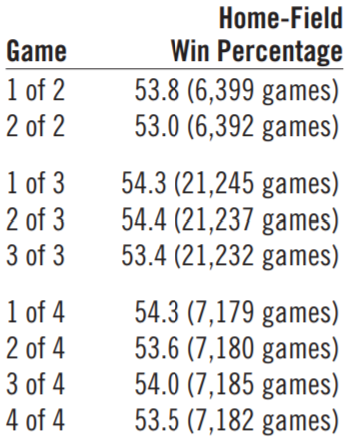
This effect certainly appears in the current thirty-team era in MLB, but demonstrating whether it is a real effect could be helped or damaged by looking at a larger sample. Consider two-, three-, and four-game series from 1980 to 1997:

The nearly 2,500 four-game series clearly no longer show any kind of middle-game effect. As many four-game series are between teams in different divisions, and these teams tend to be further apart, perhaps improvements in travel in recent years have eroded some effects that make home teams win more earlier in a series. However, in the more than 7,500 three-game series, we still see a slight effect in the middle game. The effect is not quite statistically significant but does show up as a slightly more than 1 percent larger home-field advantage in the second game of a three-game series.
Even when we combine 1980—2009, we still do not quite get a statistically significant effect (p=.083):
When we examine box scores from 1954 through 2009, we get the following home-field advantage by series game:
From this data, it appears that the statistically significant difference (p=.024) in the last game of three-game series has less of a home-field advantage.
When we examine box scores from the period 1954—1979, we get the following:

The early games have a larger home-field advantage in this era. As travel has improved over time, the early- game home-field advantage has fallen. Whether this may allow another middle-game effect to emerge remains pretty ambiguous. Perhaps it will become clearer over time.
All in all, this section probably poses more questions than it answers. The previous sections have allowed us to reach conclusions about the topics addressed therein, and many of the answers were not surprising. There is clearly a surprising result—that home-field advantage is much larger in the middle games of the series—and my hypothesis as to why that might be is not necessarily correct. I do think it’s most likely that the significance of these games is a result of an effect of home-field advantage that increases with the duration of the series and a second effect of home-field advantage that decreases with the duration of the series, but those two effects are not necessarily jetlag and time away from home, the two effects that I paired earlier in my analysis.
In the next section, we will discuss individual player differences to demonstrate what effects home-field advantage has at the individual level.
INDIVIDUAL PLAYERS
Although team-specific home-field advantage is small, that does not necessarily apply for specific players at home. We have seen that home teams are more likely to succeed in hitting home runs, so we are left to wonder whether home-run hitters are more likely to have a higher home-field advantage. A thoughtful commenter in an online version of this article pointed out that home-field advantage seemed to be growing in recent years. In fact, it has gone up, from about 6.6 percent in 1998—2002 to 8.9 percent in 2003—2008. Perhaps teams have been able to improve their home-field advantage by acquiring players who better suit their ballparks. Furthermore, if teams are more likely to hit home runs at home, we may wonder whether players who hit more home runs will have higher or lower differentials between their home-run rates at home as opposed to the road. In this section, we will test several statistics for this possible trend.
Naturally, testing this data requires that we know that players have a persistent home-field advantage. This is not something we can assume, because we know that teams do not. When we study players who did not switch teams and who had at least 150 at-bats at home and at least 150 at-bats on the road in two consecutive years from 2001 through 2008—only then do we see that the difference between OPS at home and on the road for a player has a year-to-year correlation of .1863, which is quite large given our sample of 960 players. It is worth checking whether park factors were playing a role here, so I used ESPN’s park factors for the year in question and normalized the home statistics using park factors listed (hits, doubles, triples, home runs, walks). Since one-year park factors fluctuate a lot (there is no ballpark that is going to be twice as likely as the average to surrender home runs), I also developed regressed park factors that were merely halfway between the recorded park factor and 1.00. Either way, this correlation came out large: .1752 for given park factors and .1615 with regressed park factors. The year-to-year correlation for this set of hitters was also pretty high for various other statistics. (Note that the following numbers are normalized using the regressed park factors.)

This year-to-year correlation was not as strong for pitchers, since they had only a slight tendency to continue being relatively better at home if they had the year before.
Using the regressed park factor—adjusted ERA of 539 pitchers from 2001 through 2008 who threw 40 innings or more at home and on the road for the same team for two consecutive years, we get a correlation of .0299. This was not much different with no park adjustments (.0394) and unregressed park-factor adjustments (.0520).
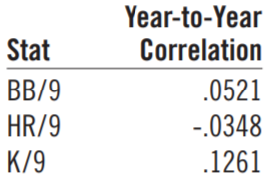
It seems that, if some pitchers consistently perform well at home, this would be primarily a function of recording strikeouts and secondarily a function of not walking batters.
In the above analyses, the statistical correlation that is studied concerns the difference between the home and road statistics. It is possible that home-field advantage has a multiplicative effect rather than an additive effect. For that reason, I also tested the correlations of the ratio of home statistics to road statistics from year to year. Here are those results:
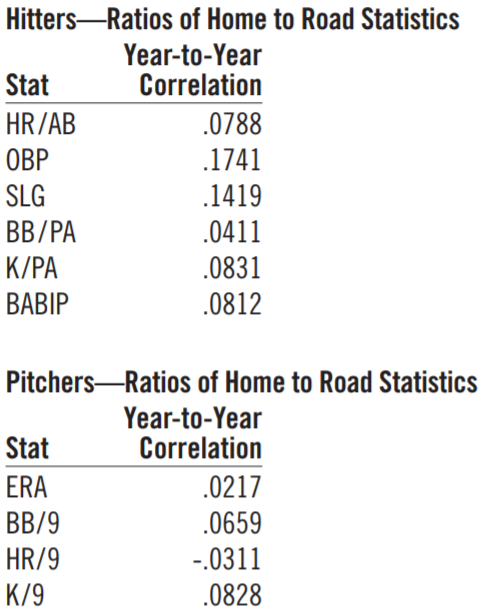
It appears that home-field advantage for hitters is persistent either way you measure it. For pitchers it is somewhat persistent but less so.
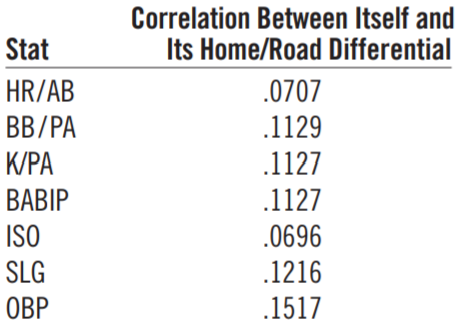
Since it is pretty clear that hitters and pitchers have some persistent ability to do better at home, it’s worth checking whether home-field advantage proves particularly helpful for players who have certain skills. This appears to be true across many skills. For example, the correlation between OPS and the difference between OPS at home and on the road (all normalized using regressed park factors) is .1452 for the 1,824 hitters with at least 150 at-bats at home and on the road in the period 2001—2008. The correlation between ERA and the difference between ERA at home and on the road (again, all normalized the same way) is -.1048. It seems that better pitchers and better hitters will show larger home-field advantages. Consider the correlations between the following normalized statistics and the differential between them at home and on the road, where normalizing refers to using the same normalized park factors:
For pitchers, we get the following:

From these numbers, it’s pretty clear that players who have certain skills are particularly adept at employing them while at home. This seems true for nearly all statistics and especially for those related to strike-zone management. However, suppose we try to repeat this analysis looking at ratios instead of differentials:

By this measure, it appears that hitters tend to have a particularly strong home-field advantage with respect to BABIP skills but not for other measures of hitting, such as strike-zone management. Pitching does not appear to have an especially strong home-field advantage for particular statistics, though the ratio of home to road ERA actually shows a -.0986 correlation, indicating that better pitchers may be particularly good at home. Of course, there is no reason to necessarily choose differences or ratios, but it is best to look at both to get a better idea of individual home-field advantage.
As a side note, I thought it would be interesting to check the effect of age on home-field advantage. In discussions I had with David Cohen of TheGoodPhight.com a while back, he questioned whether older players may have larger or smaller home-field advantages. Their familiarity with road ballparks may enable them to see the ball better there. However, travel may be more difficult for them. In fact, the latter effect seems slightly more prevalent: The correlation between OPS home-road differential and age is .0884, and the correlation between ERA home-road differential and age is only .0294. The former is statistically significant, while the latter is not. Perhaps pitchers (in this study, starting pitchers generally, since relievers rarely notch both 40 innings at home and 40 innings on the road) are better able to adjust their bodies on the road, while everyday players may struggle a little more with travel as they age.
CONCLUSION
In this study, we have learned many surprising but also a few unsurprising things. Initially, we discovered that home-field advantage was particularly strong in the early innings. Many fans believe that a large portion of home-field advantage in baseball derives from the home team having the structural advantage of the last plate appearance, in which they know how many runs they need to win and can play one-run strategies if necessary. While this may be a factor, it is probably just as likely that the defense can adjust their fielders (e.g., “no-doubles defense”) in such a way to play one-run defensive strategies to their own advantage. Therefore, it is not at all clear that a late-game effect is a significant portion of home-field advantage. The early-game advantage is large and suggests a matter of getting used to the field. That this early-game (and particularly first-game) advantage is large in each series game suggests that starting pitchers are significantly affected by their own ballpark in ways that other players are not. Strengthening the argument that pitchers are a major factor in home-field advantage is the finding that pitchers hit more batters on the road and the discovery of the significant effects of home field on other defense-independent outcomes. Hitters appear to play a role as well in home-field advantage, as demonstrated by their superior performance at home with respect to home runs, batting average on balls in play, and avoiding ground balls. That defenses make fewer errors and record more double plays at home suggests that they are affected by home-field advantage, and stolen-base percentage indicates an advantage in home-team baserunning as well.
Home-field advantage does not appear to be very team-specific. Only the Rockies show a persistent home-field advantage. Other measures of statistical consistency imply that the effect all other teams experience when playing at home does not vary much from team to team. However, there are many indications that individual players see noticeable home-field effects. These may be seen to most affect batting average on balls in play or, depending on the methodology used, strike-zone management, but it does appear that home-field can elevate a player’s game and particularly help a hitter’s game more than a pitcher’s game.
There are differing home-field advantages that depend on which game of the series is played. The closer the teams’ home parks are to each other, and the greater the teams’ familiarity with each other’s ballparks, the smaller the home-field advantage. Even for teams that are from different leagues, play near each other, and play each other relatively often, home-field advantages are low. Home-field advantage does appear variable by series game. Indications are that the last game of the series tends to show the smallest home-field advantage, though more so in the past than now. However, there is some indication that the first game of a series has a smaller home-field advantage than do the middle games, particularly when teams are from cities near each other. This could result from a variety of causes, such as home teams adjusting more quickly than do away teams as the series progresses, but the reason remains unclear.
Home-field advantage clearly exists in baseball. Given so much research that consistently shows weak psychological and contextual effects, to see this large effect is refreshing. Eight percent is a lot. When you remove an average hitter from a lineup and replace him with a replacement-level player, you may lower home-field advantage only a little more than 1 percent. The effect of home-field advantage is so large that you are better off playing your third starter against your opponents’ ace in your home park than you are the other way around. Effects of familiarity and distance appear to be the primary drivers of home-field advantage, though other factors may be at play. Knowing how large these effects indicates that there is much to be learned from understanding context in baseball. It is easy to dismiss these effects as minor, considering how they are often small compared to the effects of talent, but their existence is clear. The psychology of the crowd may not be what is driving home-field advantage, but it is apparent that they will continue to enjoy its effects.