How Much Is a Top Prospect Worth?
This article was written by Victor Wang
This article was published in 2007 Baseball Research Journal
With salaries for major league free agents skyrocketing, teams are more reluctant than ever to trade their top prospects. These prospects are valuable because if they reach their upside, a major league team has a star caliber player under their control for six full seasons while paying that player much less than what he would earn on the open market. Teams are even reluctant to trade these types of prospects for established major league stars, who may provide more certainty but cost more and may soon be free agents. I was curious to see whether teams were making the right choice by holding on to these prospects. In essence, I wanted to determine what type of value a team could get back from a top prospect during the first six years the team had that prospect under its control.
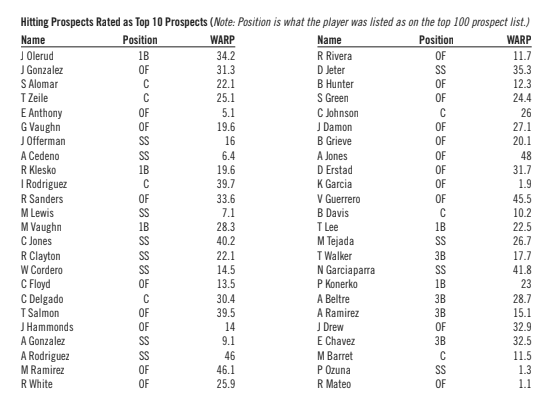
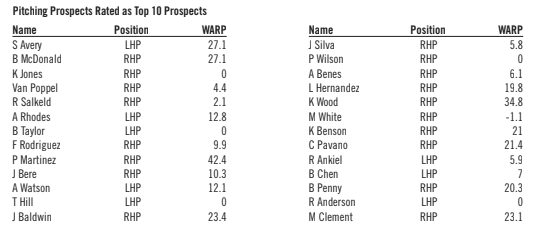
To determine who the top prospects were, I took Baseball America’s Top 100 prospect lists in 1990-1999. From that list I chose the top 10 prospects from each year and separated them into hitters and pitchers. Some prospects were on the list several times, but I only included them to the list once. After that, I determined the WARP (wins above replacement player) that they accumulated during their first six full seasons before free agency. WARP is a statistic created by Clay Davenport of Baseball Prospectus. As defined on their website, WARP is “the number of wins this player contributed, above what a replacement level hitter, fielder, and pitcher would have done, with adjustments only for within the season.”
While some may not agree with the baseline WARP uses, it is widely accessible for past players. From there I determined what the average WARP of the group of hitters and pitchers was and then broke the prospects into four subgroups. These four subgroups are bust, contributor (a back of the rotation starter or middle reliever for pitchers), everyday player (a middle of the rotation starter for pitchers), and star (an ace for pitchers). A bust was defined as a player who had 12 WARP or less (2 or less WARP per year). A contributor was defined as a player who had between 12 and 24 WARP (2 to 4 WARP per year). An everyday player was defined as a player who had between 24 and 36 WARP (4 to 6 WARP per year). A star was defined as a player who had 36 or more WARP per year (6 WARP or more per year).
RESULTS
Note: The full list of players included in this study and their value accumulated are included at the end of the paper.
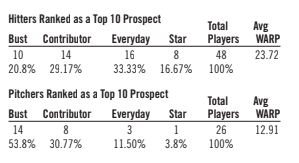
These results show that teams have been getting a pretty decent return on hitting prospects. On average, the hitting prospects have given about 24 WARP, or the results of an everyday player. When that player can be controlled for a very cheap price, it gives great value to the team given the current open market. However, when we take a closer look, the chances of a team getting an everyday player is one out of three. They also have a higher chance of having their prospect become a bust than of getting a star player in return. A bust happens for one out of every five prospects while a team gets a star player in return for one out of every six hitting prospects. For every Vladimir Guerrero, there are even more Eric Anthonys.
While hitting prospects give at least a decent return, top pitching prospects have given a terrible return. Out of the 26 different pitchers to rate as a top 10 prospect, only one (Pedro Martinez) gave a star return in the first six years. Also, a team only gets a solid starting pitcher for about one out of every 10 pitching prospects. Maybe even worse, over half of the pitching prospects became busts. Given the high rate of failed pitching prospects, it could definitely be worth giving a top pitching prospect for an established player, even with the high price that pitchers cost on the open market.
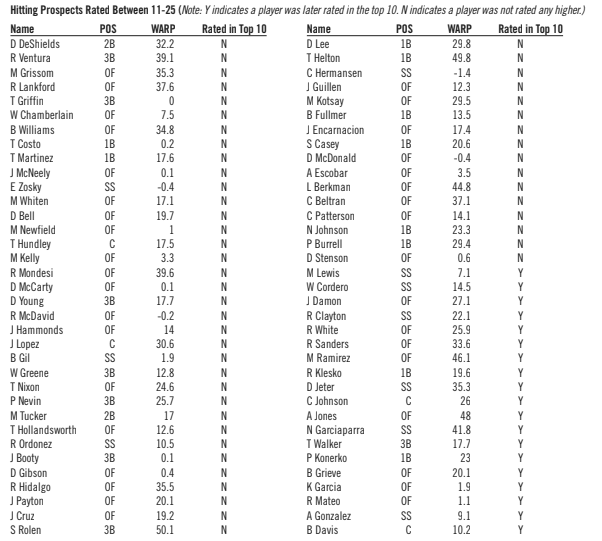
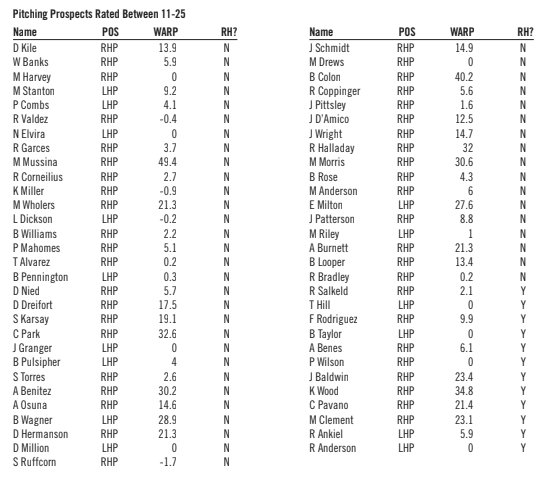
Considering that evaluating prospects is a subjective process, I went further down the top 100 prospects list to see if I could find similar results. This time I examined prospects rated between 11th and 25th. I also noted if that prospect was later rated in the top 10. I also examined the same group of prospects without the ones that were later rated in the top 10.
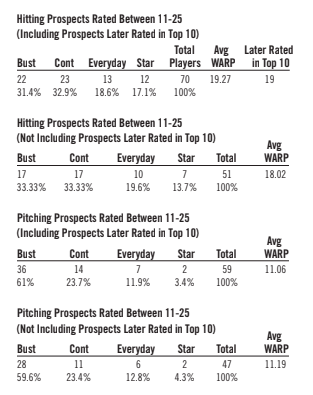
Hitting prospects appear to have been properly evaluated. When prospects that were later rated in the top 10 are removed, the percentage of prospects that become busts increase for the lower rated group while the other three groups decrease. Interestingly, these same results do not occur for the pitching prospects. The inclusion of pitching prospects that were later rated in the top 10 actually decreases the overall production of the 11-25 pitching prospects. They also decrease the chances of producing an ace or middle of the rotation pitcher. However, the average WARP of the group still remains lower than the WARP of just the top 10 pitching prospects.
While we have now found the value top prospects give their teams, we have not yet factored in the lower compensation these players receive in their first six years. To see how much money these top prospects save their teams, we need to determine how much value a top prospect gives to its team and for how much money. Then we must determine how much it would cost to purchase that same value in free agency. The last part is the easiest part. In Baseball Prospectus 2006, it was determined that in the 2005 and 2006 off-season, one additional WARP cost a team $1.525 million. Salary data from 1989-2007 shows that the average salary inflation has been 10.87%. When we factor in that inflation, on average, one additional WARP will cost a team $1.69 million in the 2007 off-season.
We have also found the value that top prospects give to their teams, so all we have to do now is determine how much it cost the teams. The new MLB labor agreement states that the minimum salary in 2007 will be $380,000, in 2008 it will be $390,000, and in 2009 it will be $400,000. The sum of these three salaries will determine how much a six-year player first starting in the major leagues in 2007 will make in his first three years, assuming a team renews that player’s contract each year. The tricky part now is to find how much a player makes in years four through six. To do this I looked at every fourth-, fifth-, and sixth-year player in the major leagues and found their salary. All salary figures were used from Cot’s Baseball Contracts. I found that the average fourth-year salary was $2.13 million, fifth-year salary was $3 million, and sixthyear salary was $3.9 million. I then found the WARP of each fourth–sixth-year player and divided their salary by their WARP. The $/WARP for a fourth-year player was $.64 million/WARP, for a fifth-year player it was $.83 million/WARP, and for a sixth-year player it was $1.29 million/WARP. Remember, it cost $1.525 million for every additional WARP in the free agent market.
To find the average savings of each group, we can take the expected WARP of each group and multiply that by the cost of purchasing that WARP in the free agent market for the prospect’s first six years, adjusting the FA$/WARP cost for inflation. We also know how much the prospect will cost in his first three years, and we can also find how much he will cost in his fourth-sixth years by multiplying the arbitration$/WARP by the prospect’s expected WARP. We can then subtract the cost of purchasing the prospect’s WARP in the free agent market by the prospect’s expected cost in his first six years to determine the expected savings. Expected savings were then converted to net present value. Note that this assumes that there is steady inflation throughout baseball. This also assumes that each WARP is purchased at a fairly priced value. This also assumes that what a team purchases in WARP is what it gets. The following table below shows the expected savings of a top 10 hitting prospect.
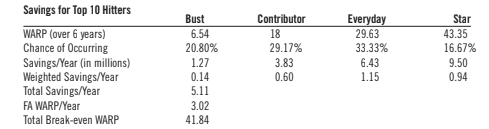
Here is how to read the above table. The first row shows the average WARP each subcategory produces over six years. The next row shows the chances a prospect from each subcategory is produced. The following row shows how much a team saves in millions of dollars per year if they produce a player in that subcategory. I then multiplied the savings of the subcategory by the chance of the subcategory occurring to determine a weighted savings. I summed the weighted savings to produce an average total savings per year. After that, I divided the savings by 1.69 to see how much WARP/year a team could purchase with the total savings produced. I then multiplied the savings WARP/year by the six years a team is able to control a prospect and added the average WARP of the group to come up with a total break-even WARP.
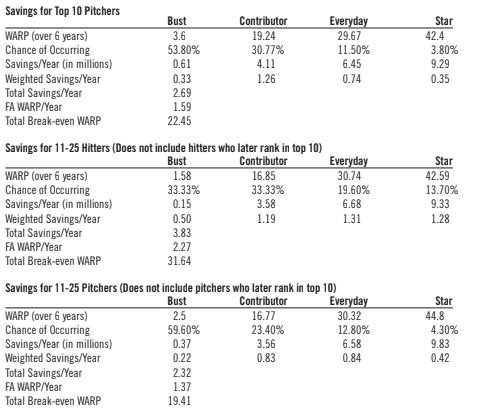
The total break-even WARP is what a team can expect to gain in WARP from a prospect’s average performance plus the additional WARP that the team could buy with the money they save from keeping the prospect. Therefore, the total break-even WARP is what a team needs to receive in return and gain in production within six years for a trade to be beneficial, assuming that the WARP received is fairly priced. Anything above the break-even WARP is beneficial toward the team trading the prospect while anything below the break-even WARP is beneficial towards the team acquiring the prospect. It makes more sense to use the total breakeven WARP as the breakeven figure since prospect for prospect trades rarely happen. Here are the tables for the other three categories:
CONCLUSION
From these tables we can see that hitting prospects have a big edge in value compared to pitching prospects. In fact, the 11-25 hitting prospects have 40% more value that the top 10 pitching prospects. Top 10 hitting prospects easily provide the most value of any group. The value is high enough that it is unlikely a team could receive enough in return to trade a top hitting prospect. It also may seem that the pitching prospect break-even figures are rather low, especially when compared to the hitting prospects. However, they do show that it is wrong to trade away a top pitching prospect for a one-year or less rental, as it would be nearly impossible for one player to provide the value required in one year or less. Also, remember that these break-even numbers do not factor in if teams are “one player away” from making the playoffs. It may be beneficial for a team to deal away a top prospect if the player it receives in return is the difference between making the playoffs and sitting at home in October. A playoff appearance can be very valuable to a team in the additional revenue it produces, especially considering that anything can happen once a team makes the playoffs. As the saying goes, flags fly forever.
It appears that teams are making the right decision by hanging on to top hitting prospects. Trading a top hitting prospect demands a lot in return in order to ensure fair value in a trade. It also appears that teams are usually doing the right thing by not trading away top pitching prospects for a short-term acquisition. There could be value to be made if a team can acquire a more certain asset that it can control for over one year for a top pitching prospect, especially given the fact that even top pitching prospects are a bust over half the time. For example, if a team can acquire a player in his arbitration years, they would need less WARP in return since a player in arbitration makes less than he would on the open market. In the end, though, it looks like teams are making the right decision when it comes to holding on to top prospects.
Sources
https://www.baseballamerica.com/today/prospects/features/26983.html
http://sportsline.com/mlb/salaries/avgsalaries
http://mlbcontracts.blogspot.com