

Interesting Statistical Combinations
This article was written by Fred Worth
This article was published in 2004 Baseball Research Journal
One of many things that makes baseball the most enjoyable sport is statistics. Players are considered great because of their statistical achievements. We are all familiar with the records for home runs in a season or career. Career strikeouts. Pitchers winning 20 games in a season. Batters hitting .300. All of these are interesting and enjoyable. Something like on-base percentage, however, is a little different since it combines other, seemingly unrelated, statistics. Just because a man has a high batting average does not mean he is going to walk a lot.
The purpose of this paper is to look at combinations of statistics rather than just individual statistics. We will not be doing any detailed analysis to speak of, just looking at the statistics because they are fun. Before we go any further, a big tip of the cap to Lee Sinins, creator of the Sabermetric Baseball Encyclopedia, without which this paper would not be possible. Some statistics are from baseball-reference.com.
HIGH BATTING AVERAGE, LOW WALKS
Since we mentioned on-base percentage above, we will start off with players with more than 600 at-bats in a season who hit .300 or higher but had less than 20 walks. The batting average would be considered good, but the lack of walks could make the player less valuable than someone batting .270 with a more discerning batting eye. Through the 2003 season, there have only been five players with such seasons. One did it twice.
|
Player |
Year |
Team |
AB |
H |
BB |
AVG |
OBP |
|
Hi Myers |
1922 |
BKN |
618 |
196 |
13 |
.317 |
.331 |
|
Woody Jensen |
1935 |
PIT |
627 |
203 |
15 |
.324 |
.344 |
|
Frank McCormick |
1938 |
CIN |
640 |
209 |
18 |
.327 |
.348 |
|
Don Mueller |
1955 |
NYG |
605 |
185 |
19 |
.306 |
.326 |
|
Garry Templeton |
1977 |
STL |
621 |
200 |
15 |
.322 |
.336 |
|
Garry Templeton |
1979 |
STL |
672 |
211 |
18 |
.314 |
.331 |
Interestingly, over half of these occurrences are before the 1970s and all of them are before the 1980s, when players have often become criticized for being free swingers lacking discipline. One thing that is no surprise; most of these seasons came when the player was very young or in his first year as a regular player.

Another recent example of a similar combination was Jose Molina in 2003. Molina managed to have 114 official at-bats and walk only once. His batting average was just .184, but he certainly fits the spirit of the above list.
More than 100 at-bats with only one walk has happened 162 times in baseball history, mostly by pitchers. Among those pitchers were Togie Pittinger, Pud Galvin, and Bobo Newsom, the only ones to achieve this dubious distinction three times. Chuck Fulmer, John Peters, and Bill Holbert deserve special mention; of the 12 players achieving this notoriety twice, they were the only ones who were not pitchers. Peters had 379 official at-bats (the most of anyone with only one walk) for the 1879 Cubs.
Other notable non-pitchers were Nap Lajoie (his rookie year of 1896), Jake Beckley (his last season, 1907), and Dan Brouthers (his rookie year of 1879). Those with more knowledge of the history of rules might enlighten us as to whether there were rule peculiarities, particularly in 1879, that made walks less common. Notable pitchers who accomplished this were Dizzy Dean (twice), Jim Bunning (twice), Cy Young (twice), Mickey Welch (twice), Addie Joss, Walter Johnson, Ferguson Jenkins, Bob Gibson, Waite Hoyt, Grover Cleveland Alexander, Jack Chesbro, Steve Carlton, Amos Rusie, Red Ruffing, Early Wynn, Ed Walsh, Warren Spahn, Ted Lyons, Joe McGinnity, Phil Niekro, and Dutch Leonard.
LOTS OF EACH KIND OF EXTRA-BASE HIT
In all of baseball history, only five players have had at least 20 doubles, 20 triples, and 20 home runs in the same season. No player did it more than once. These are George Brett, Jim Bottomley, Wildfire Schulte, Jeff Heath, and the greatest all-around baseball player of all time, Willie Mays.
|
Player |
Year |
Team |
Age |
2B |
3B |
HR |
|
Wildfire Schulte |
1911 |
CHI(N) |
28 |
30 |
21 |
21 |
|
Jim Bottomley |
1928 |
STL(N) |
28 |
42 |
20 |
31 |
|
Jeff Heath |
1941 |
CLE |
26 |
32 |
20 |
24 |
|
Willie Mays |
1957 |
NYG |
26 |
26 |
20 |
35 |
|
George Brett |
1979 |
KC |
26 |
42 |
20 |
23 |
Not surprisingly, all five were relatively young at the time. Also not surprisingly, Willie Mays had the most home runs of the five.
This achievement is somewhat notable because one might presume that a player who hit over 20 home runs would often have outfielders playing fairly deeply, minimizing the chances of hitting a triple.
Two other players, Ryne Sandberg and Buck Freeman, came close to joining this esteemed group, with Freeman having what is probably the oddest set of numbers of this group of players.
|
Player |
Year |
Team |
Age |
2B |
3B |
HR |
|
Ryne Sandberg |
1984 |
CHI(N) |
24 |
36 |
19 |
19 |
|
Buck Freeman |
1899 |
WAS |
27 |
19 |
25 |
25 |
A few other players have done things similar to what Freeman did. Here are the players with less than 20 doubles and home runs, but at least 20 triples.
|
Player |
Year |
Team |
Age |
2B |
3B |
HR |
|
Buck Ewing |
1884 |
NYG |
24 |
15 |
20 |
3 |
|
Dick Johnston |
1887 |
Braves |
24 |
13 |
20 |
5 |
|
Joe Visner |
1890 |
Burghers |
30 |
15 |
22 |
3 |
|
Jocko Fields |
1890 |
Burghers |
25 |
18 |
20 |
9 |
|
Bid McPhee |
1890 |
Reds |
30 |
16 |
22 |
3 |
|
Jake Virtue |
1892 |
Spiders |
27 |
15 |
20 |
2 |
|
Duff Cooley |
1895 |
Cardinals |
22 |
9 |
20 |
7 |
|
Geo. Van Haltren |
1896 |
Giants |
30 |
18 |
21 |
5 |
|
Harry Davis |
1897 |
Pirates |
23 |
10 |
28 |
2 |
|
Tommy Leach |
1902 |
PIT |
24 |
14 |
22 |
6 |
|
Sam Crawford |
1902 |
CIN |
22 |
18 |
22 |
3 |
|
Chief Wilson |
1912 |
PIT |
28 |
19 |
36 |
11 |
|
Vic Saier |
1913 |
CHI(N) |
22 |
15 |
21 |
14 |
|
Jake Daubert |
1922 |
CIN |
38 |
15 |
22 |
12 |
|
Dale Mitchell |
1949 |
CLE |
27 |
16 |
23 |
3 |
Special note should be taken that Visner and Fields were teammates. Also, note that Cooley did not have even 10 doubles or home runs. Davis had 40 extra-base hits and 70% of them were triples. Not surprisingly, none of these are recent, with Mitchell the only one occurring in the past 80 years.
LOTS OF RBI AND FEW RUNS
Sometimes players, typically leadoff hitters, may score a lot of runs but not knock in many. An example of this would be 21-year-old Lloyd Waner, scoring 133 runs while knocking in only 27 for the 1927 Pirates. Usually, if a player knocks in a lot of runs, then he is likely to score a lot of runs as well. Three players in baseball history have finished a season with more than 100 RBI and fewer than 60 runs scored.
|
Player |
Year |
Team |
Age |
R |
RBI |
|
Gus Bell |
1959 |
CIN |
30 |
59 |
115 |
|
Vic Wertz |
1960 |
BOS |
35 |
45 |
103 |
|
Danny Tartabull |
1996 |
CHI(A) |
33 |
58 |
101 |
These would certainly be cases of players doing a lot but not getting a lot of help from teammates. Though I do not know it, I would suspect these batters probably batted sixth for teams with weak bottoms of the order.
LOTS OF RBI AND NO HOME RUNS
Most of the time the people with a lot of runs batted in also have a large number of home runs. Several players have managed to have a lot of RBI yet not many home runs. The kings of this category are Hughie Jennings and Lave Cross.
|
Player |
Year |
Team |
Age |
HR |
RBI |
|
Hughie Jennings |
1896 |
BAL |
27 |
0 |
121 |
|
Lave Cross |
1902 |
PHI(A) |
36 |
0 |
108 |
Five other players managed to knock in over 100 runs while hitting only one home run.
|
Player |
Year |
Team |
Age |
HR |
RBI |
|
Farmer Vaughn |
1893 |
Reds |
29 |
1 |
108 |
|
Jack Doyle |
1896 |
Orioles |
26 |
1 |
101 |
|
Cupid Childs |
1896 |
Spiders |
28 |
1 |
106 |
|
Kid Gleason |
1897 |
Giants |
30 |
1 |
106 |
|
Bill Sweeney |
1912 |
BOS |
26 |
1 |
100 |
Vaughn deserves special mention since he was the only one of these seven to bat under .300. He hit only .280 on 135 hits yet still managed over 100 RBI. At the other end of that spectrum was Jennings, who batted .401 in 1896. Another interesting note is that Jennings and Doyle were teammates.
LOTS OF HOME RUNS AND FEW RBI
Turning our previous category around, let us now consider players who hit a lot of home runs but had comparatively few runs batted in. The following are the only players to have hit 40 or more home runs while knocking in fewer than 100 runs.
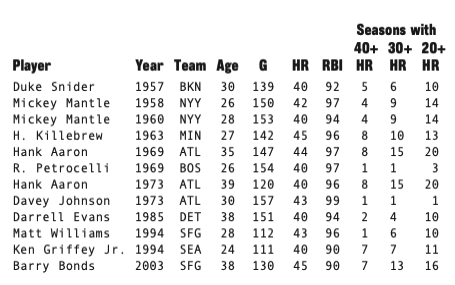
A couple of comments should be made about this list.
It should immediately be noted that, if not for the strike that ended the season early in 1994, Griffey and Williams would probably not be on the list. No team played more than 117 games that season.
Notice also that 1973 was the only year that Davey Johnson hit even 20 home runs. Petrocelli never topped 30 again and bested 20 only two other times.
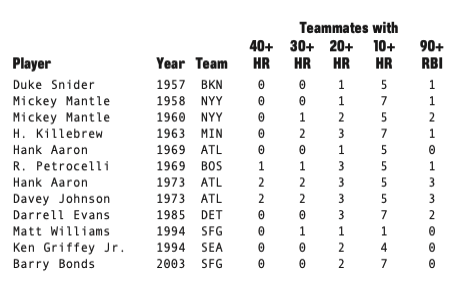
Also, notice that Johnson and Aaron were teammates. This may give some indication of why these players are on the list. If a team has a lot of players hitting home runs, there are less likely to be men on base for others who hit home runs. In 1973, Johnson and Aaron were joined by Darrell Evans in hitting 40 or more home runs. Evans, though on this list for 1985, knocked in 104 runs in 1973. Notice that, in most cases, these players were teammates of other sluggers, minimizing RBI chances.
LOTS OF HOME RUNS BUT FEW DOUBLES
It is not unusual that players who hit a lot of home runs will also have a lot of doubles. Todd Helton and Albert Belle are good examples of this. Five players turned the unusual trick of having 50 or more home runs but less than 20 doubles.
| Player | Year | Team | Age | 2B | HR |
| Jim Thome | 2002 | CLE | 31 | 19 | 52 |
| Willie Mays | 1955 | NYG | 24 | 18 | 51 |
| Roger Maris | 1961 | NYY | 26 | 16 | 61 |
| Mickey Mantle | 1961 | NYY | 29 | 16 | 54 |
| Ralph Kiner | 1949 | PIT | 26 | 19 | 54 |
Notable is the presence of a pair of teammates. Mantle and Maris shared more than their home run race in 1961.
It would be expected that these players would possibly be a little older, but Thome is the only one who was even 30 when he accomplished the feat. Most surprising of all would have to be Willie Mays. In 1955, Mays had 24 stolen bases (just one behind the league leader) and 13 triples (tied for the league lead). He was very fast but for some reason had only 18 doubles.
Mantle is the only other player among these who was ever noted for his speed, but by 1961 he was beginning to have problems with his knees.
Let us turn now to a few pitching statistics.
LOTS OF LOSSES BUT LOW ERA
Typically, a pitcher with an ERA below 2.00 is not going to lose a lot of ball games. Surprisingly, 15 times there have been pitchers with ERAs below 2.00 who lost 20 or more games.
|
Pitcher |
Year |
Team |
Age |
W |
L |
ERA |
|
Jim Devlin |
1876 |
Grays |
27 |
30 |
35 |
1.56 |
|
Will White |
1878 |
Red Stockings |
23 |
30 |
21 |
1.79 |
|
Sam Weaver |
1878 |
Cream Citys |
22 |
12 |
31 |
1.95 |
|
Will White |
1879 |
Red Stockings |
24 |
43 |
31 |
1.99 |
|
Monte Ward |
1880 |
Grays |
20 |
39 |
24 |
1.74 |
|
Jim McCormick |
1880 |
Blues |
23 |
45 |
28 |
1.85 |
|
Tony Mullane |
1882 |
Colonels |
23 |
30 |
24 |
1.88 |
|
Guy Hecker |
1884 |
Colonels |
28 |
52 |
20 |
1.80 |
|
Pud Galvin |
1884 |
Bisons |
27 |
46 |
22 |
1.99 |
|
Silver King |
1888 |
Cardinals |
20 |
45 |
21 |
1.64 |
|
Harry Howell |
1905 |
STL(A) |
28 |
15 |
22 |
1.98 |
|
Kaiser Wilhelm |
1908 |
BKN |
34 |
16 |
22 |
1.87 |
|
Ed Walsh |
1910 |
CHI(N) |
29 |
18 |
20 |
1.27 |
|
Jim Scott |
1913 |
CHI(N) |
25 |
20 |
20 |
1.90 |
|
Walter Johnson |
1916 |
WAS |
28 |
25 |
20 |
1.90 |
Noteworthy is Will White’s repetition on the list. Notice also the presence of some fairly outstanding pitchers, particularly Pud Galvin, Ed Walsh, and Walter Johnson.
Certainly there is no surprise that these are all from a long time ago. Back in those days pitchers would start 50 or 60 games a season, not once every five or six days. This explains why a number of these pitchers won a substantial percentage of their games despite the 20+ losses. It is also back in the days when fielders’ gloves were poor or nonexistent. A pitcher might allow 10 or 12 runs with only one or two earned. Still, remark- able in all this is the 1.27 ERA that Ed Walsh had in 1910 and that he still finished below .500. Of course, it did not help that the White Sox had a team batting average of .211 that year.
LOTS OF WINS AND HIGH ERA
The obvious counterpart to the previous list is pitchers with 20 or more wins but ERAs over 5.00. A pitcher would have to be good to keep losing games yet keep being handed the ball. But when a pitcher’s ERA is over 5.00, he is not likely to stay in the rotation very long if the manager has any other choice. Neither is he likely to win a whole lot of games. Not surprisingly, there are not many on this list.
|
Pitcher |
Year |
Team |
Age |
W |
L |
ERA |
|
Ray Kremer |
1930 |
Pirates |
37 |
20 |
12 |
5.02 |
|
Bobo Newsom |
1938 |
Browns |
30 |
20 |
16 |
5.07 |
Something unsurprising is that both pitchers were veterans, making their managers more likely to put up with the high ERA. Also, both earned some consideration since they did somehow manage to win more of their games than they lost. Kremer, remarkably, had a winning percentage of .625.
Also, keep in mind that 1930 was one of the years of incredible offensive production. That was the year of Hack Wilson’s 56 HRs and many other huge numbers. The Pirates had a team batting average of .303, helping to explain Kremer’s success.
In 1938, while the Browns did have a team batting average of .281, they finished with a record of 55-97. Apparently there weren’t a whole lot of options other than Newsom.
LOTS OF WINS AND SAVES
We will conclude with our only career statistic consideration. This one is basically in honor of Dennis Eckersley on the occasion of his election to the National Baseball Hall of Fame. “Eck” is the only pitcher in history to have more than 150 wins and saves. However, if John Smoltz continues pitching out of the bullpen with the success he has had recently, he will join Eckersley in either 2004 or 2005. Fifteen players have had at least 100 of each.
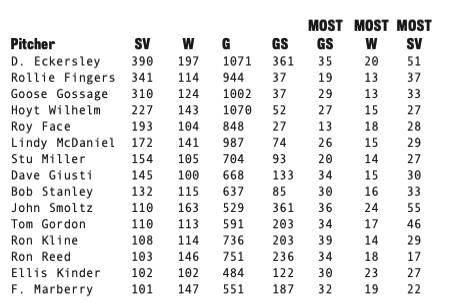
Sparky Lyle finished his career with 238 saves and 99 wins, just missing being included on our list.
Each pitcher won 13 or more games at least once. All except for Fingers, Miller, Kline, and Gossage won 15 at least once. All except for Reed had at least 20 saves at least once. Marberry is the only other who didn’t record at least 27 at least once.
John Smoltz is the only one on the list with more than half of his appearances as a starter. Considering his age, it is possible that will stay that way. Another point about Smoltz is that, thus far, there are only three seasons in which he has recorded a save, and one of those he had only 10.
One thing that this chart illustrates is the differing role of “closers” over the years. Commenting on Eckersley’s Hall of Fame election, Rollie Fingers talked about the changes during his career. Closers used to pitch two or three innings in a game. Now they typically pitch one inning. Starters used to finish large percentages of their games; now their job is to get through six or seven innings effectively. That would explain the comparatively high number of wins compared to saves for Wilhelm, McDaniel, Fingers, and Marberry.
CONCLUSION
Obviously there are many more comparisons that could be considered. These are just a few of the ones.