

Into Thin Air: What’s All the Fuss About Coors Field?
This article was written by Clyde Zaidins - Frederick Chambers - Brian Page
This article was published in Road Trips: SABR Convention Journal Articles
This article was originally published in “Above the Fruited Plain,” the 2003 SABR convention journal.
 Since opening in April of 1995, Denver’s Coors Field has received accolades for its architectural design and downtown location. The ball park echoes the scale and materials of adjacent brick warehouses and replicates the urban accessibility found in early 20th century ballparks like Wrigley Field and Ebbets Field. Yet, Coors Field, home of the Colorado Rockies, has acquired a much less favorable reputation as a place to play baseball. In fact, it has gained national notoriety as the ultimate home run hitter’s park—a launching pad of historic proportions. Coors Field led all major league ball parks in both total home runs and home runs per at-bat during seven of its first eight seasons (James 1995- 2001; STATS Inc. 2001; Carter et al. 2002).
Nearly all observers, from noted physicists to veteran players to casual fans, attribute the dramatic home run output at Coors Field to the effect of thin air on the flight of a baseball. In theory, the ball should travel about 10% farther in Denver (elevation 5,280 feet) than it would in a ball park at sea level, an elevation-enhancement that prompted prominent sports columnist Thomas Boswell to call Coors Field “a beautiful joke” that “turns the sport into a third-rate freak show” (Boswell 1998).
These comments are hardly atypical. Nationally syndicated radio talk show host Jim Rome routinely refers to the ball park as “Coors Canaveral.” Former Philadelphia manager Jim Fregosi calls baseball at altitude “arenaball” (Armstrong 2003). Throughout the nation, Coors Field is viewed as a curious anomaly that distorts our cherished national pastime and transforms mediocre hitters into stars.
But does the ball really fly that much farther in Denver? And, is thin air really to blame for the large number of home runs hit at Coors Field? We decided to put these assumptions to the test and came up with some surprising results: fly balls simply don’t travel as far as they should in Denver. In fact, the effect of thin air on the flight of the baseball at Coors Field is overestimated, owing to the influence of prevailing weather patterns in and around Coors Field. Altitude clearly plays a role in Coors Field’s home run rate, but it is not the only factor and it is perhaps not even the most important factor. Based on our research, a re-evaluation of the ball park’s reputation is in order.
HOW FAR DO BALLS FLY IN NATIONAL LEAGUE BALL PARKS?
According to scientists Robert Adair and Peter Brancazio, a baseball hit 400 feet at sea level should travel 440 feet in Denver—10% farther.2 Of course, not all National League ball parks are situated at sea level, so comparing Coors Field to the rest of the league requires an adjustment to reflect actual elevations around the league. Compared to the elevation-adjusted average of the other National League ball parks, the ball should fly 9.3% farther in Denver.
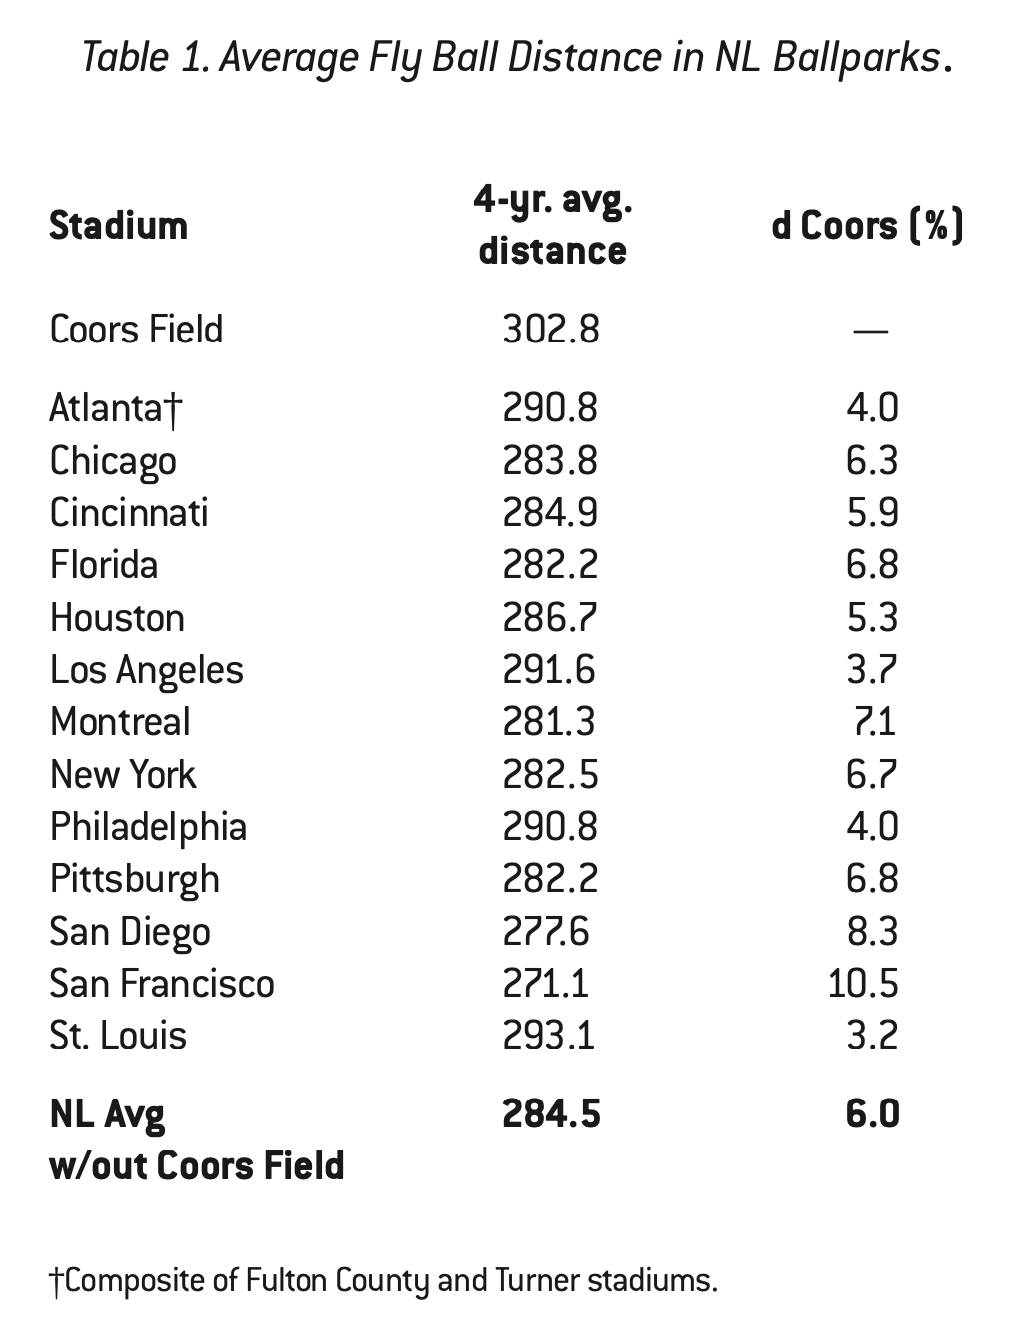
In order to determine if these theoretical relationships hold true on the field, we analyzed fly ball distance data for 14 National League ball parks for the years 1995-1998.3 These data provide an estimate of the distance traveled by every fly ball hit in fair territory for every game played in those ball parks over those four seasons. This is a total of nearly 8,000 fly balls per ball park and over 100,000 fly balls overall, more than enough to detect any systematic enhancement of fly ball distance due to altitude.
The fly ball distance data was obtained from STATS Inc. STATS records a wide range of information for each baseball game played in the major leagues, including the distance traveled by every ball put into play. Our analysis focuses only on fly balls, as these are the type of batted ball most affected by atmosphere and weather. In every major league ball park, STATS estimates the distance that each fly ball travels by locating the final position of the ball on a chart of the field.
This method yields estimated distance, not precise distance. However, we believe that this data is reliable because a consistent method is used at each ball park, and because the sample size is more than large enough to account for any individual errors in fly ball measurement (that is, cases of over-estimation or under-estimation will cancel each other out).
While this reduction is significant, keep in mind that the boosting effect of altitude in Denver is further minimized by the generous outfield dimensions at Coors Field, the league’s most spacious ball park. Indeed, in order to come up with a measure of just how much more likely it is for home runs to occur at Coors Field due to low air density, one must take into consideration actual field dimensions around the league. We made this adjustment by calculating average fly ball distance as a percentage of average outfield dimension for 14 National League ball parks (Table 2).4
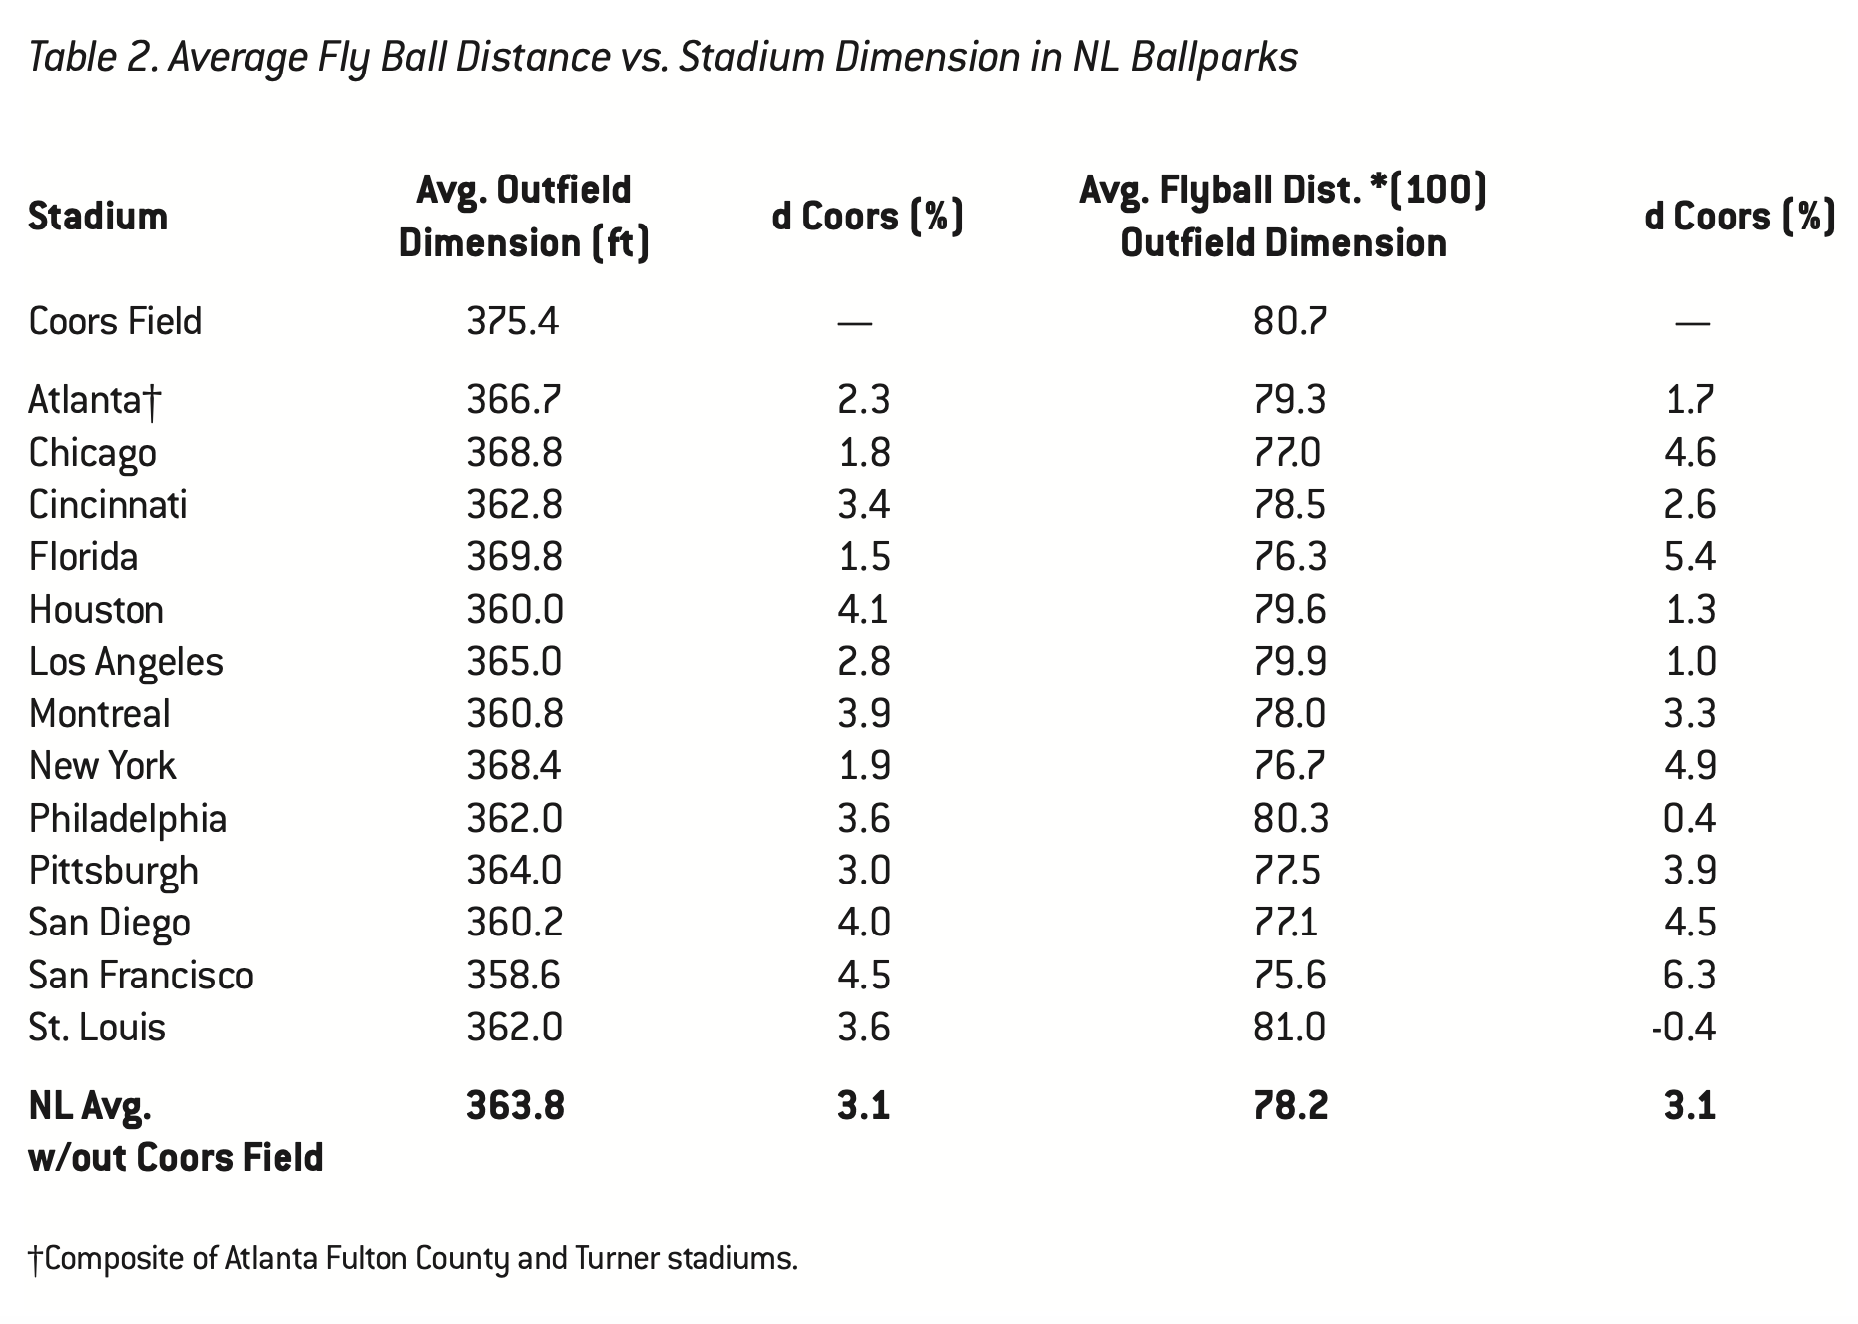
This calculation yields a measure of how far the average fly ball travels relative to the average position of the outfield fence in each ball park. As the table shows, when field dimensions are taken into account, the effective difference between Coors Field and the other National League stadiums is not even 6%—it is just 3%. Moreover, the difference between Coors Field and the stadiums in Philadelphia, Los Angeles and Atlanta is minimal, while the average fly ball actually carries closer to the outfield wall at St. Louis’ Busch Stadium than it does at Coors Field.5 Faced with these numbers, the facile assumption that elevation enhancement of fly ball distance alone is responsible for the large number of home runs in Denver vanishes into so much thin air.
This raises two important questions. First, why do baseballs not fly 9.3% farther in Denver as the laws of physics would predict? And, second, if altitude enhancement of fly ball distance is not the only factor, what else explains the impressive home run statistics at Coors Field?
COORS FIELD METEOROLOGY: SOMETHING IN THE WIND
To answer the first question, we explored the possibility that shorter than expected fly ball distances at Coors Field could be explained by baseball factors alone. After all, no two at-bats are alike, and the distance that any batted ball travels is the result of a complicated and unique set of circumstances having to do with the particular pitcher and batter involved. It depends, for instance, on the pitcher’s skill level and orientation (left or right handed), the type and speed of pitch thrown, the batter’s orientation, the batter’s hand-eye coordination, and so forth. For these reasons, we would expect fly ball distances to vary somewhat from ball park to ball park over the course of several seasons. To determine the influence of this routine, baseball-driven variation in fly ball distance, we analyzed average fly ball distances for just those National League stadiums located at sea level, thus eliminating the elevation factor. We found a standard deviation of plus or minus 6 feet in fly ball distance for this set of ball parks over the four- year study period, which is far short of the 18.3 foot difference between average fly ball Coors Field distance and average fly ball distance at the other National League parks. According to our statistical analysis (a single tailed student’s t-test) this means that the lower than expected difference between Coors Field and the other National League ball parks does not derive from baseball variables alone (at the 90% confidence level).
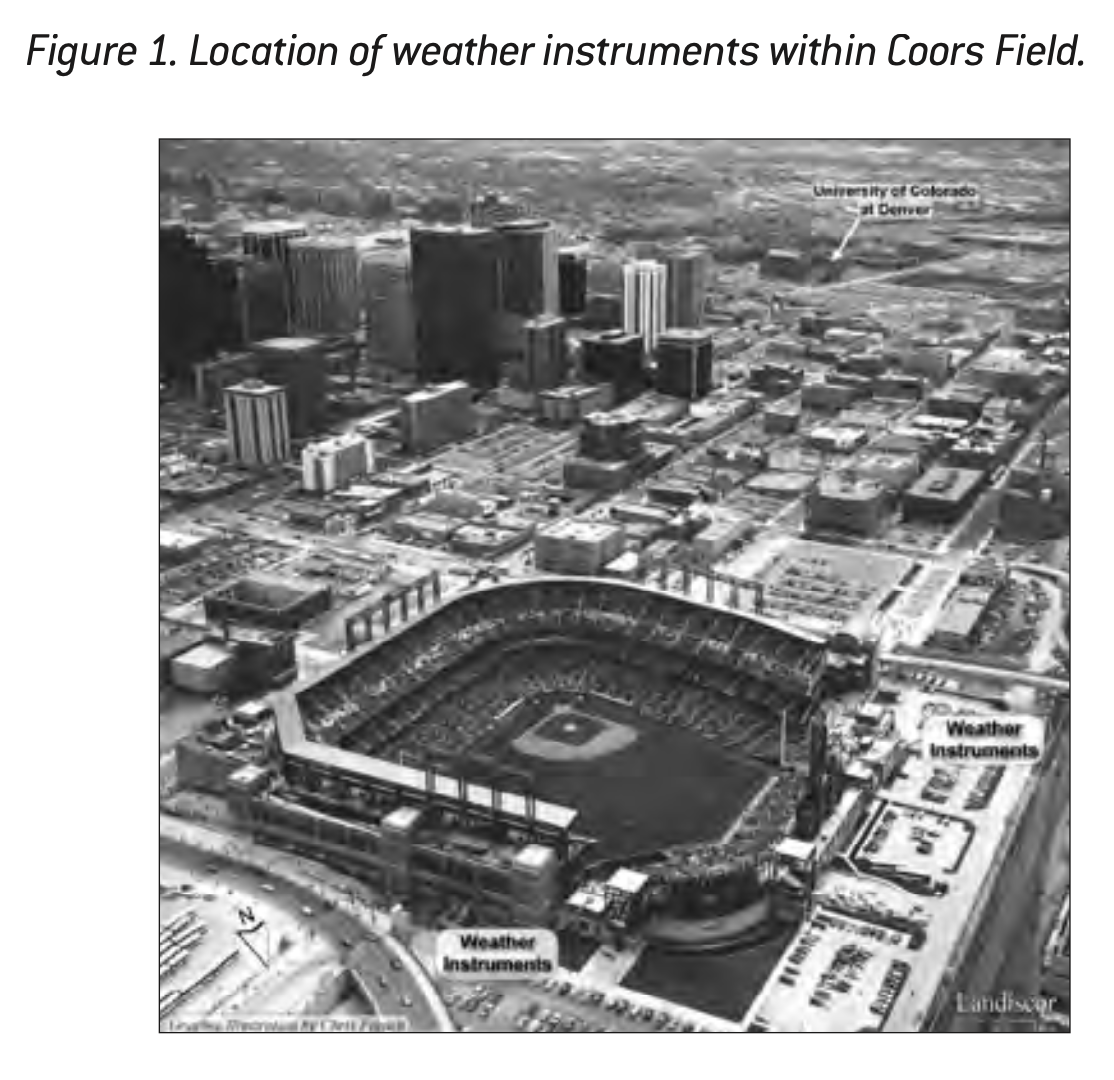
Next, we turned to an explanation based in the ball park’s geographic situation, particularly its weather. We set up two meteorological stations inside Coors Field for the duration of the 1997 baseball season.6 These stations were constructed atop concession stands along the rear concourse of the ballpark. One station was located down the left field line, while the other was in straight away center field just beyond and above the bullpens (Figure 1).
Measurements taken included temperature, relative humidity, barometric pressure, and wind as recorded by equipment that provides three-dimensional modeling of air flow. Measurements were taken continuously during game time and averaged every 15 minutes. For each game for which weather data was collected, averages of temperature, relative humidity, barometric pressure and wind were determined. This weather data was then related to average fly ball distance data for the same game.
There have been several previous attempts to link weather and baseball (Kingsley 1980; Skeeter 1988; Kraft and Skeeter 1995). These studies did not show any significant relationship between weather variables and fly ball distance. The results of our meteorological analysis indicate that of the measured variables, wind—especially the east-west vector—is the only statistically significant weather variable that is correlated with fly ball distance in Coors Field. In fact, almost 20% of the variation in fly ball distance at Coors Field can be attributed to differences in winds along the east-west vector.7 Average fly ball distances decreased with easterly winds (approximately 290 feet with easterly winds versus over 303 feet with a western component).8 Not surprisingly, easterly winds inside Coors Field were twice as strong as westerly winds—blowing at 12 versus 6 miles per hour.
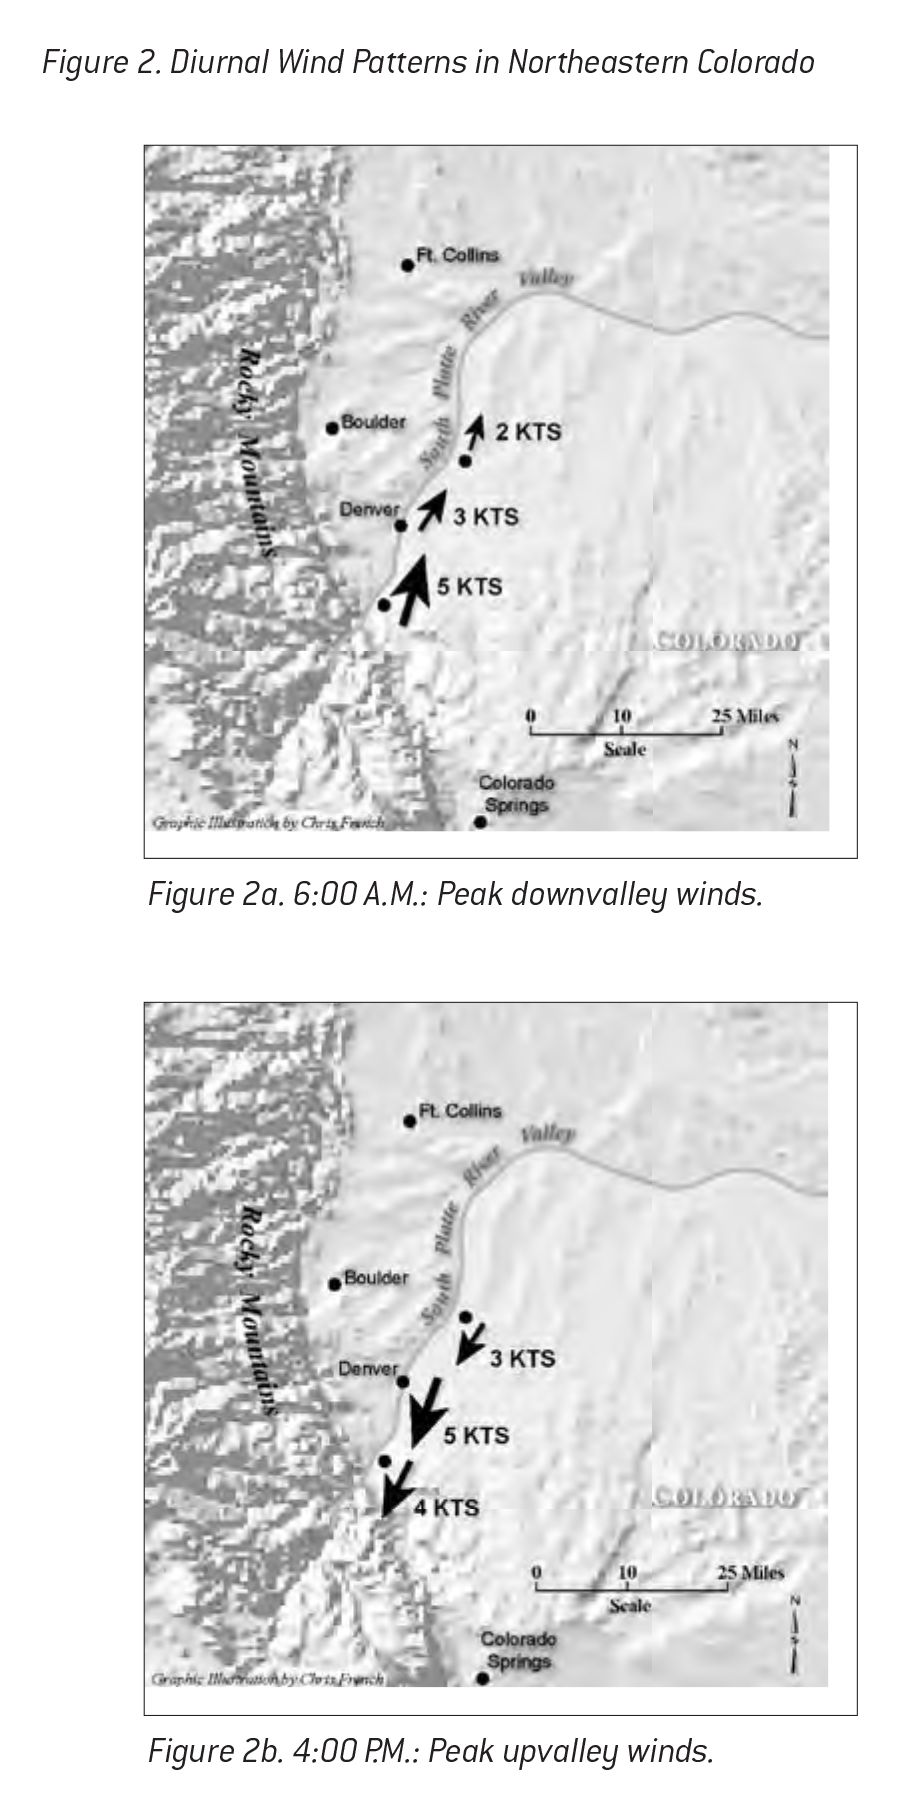
A look at the regional wind pattern shows that easterly winds do indeed predominate in the vicinity of Coors Field daily from 12:00 p.m. to 10:00 p.m. (the time period in which almost all Rockies games are played) throughout the baseball season (April through September). These seasonal winds result from the daily upslope and downslope flow of air along the Colorado Front Range (Toth and Johnson 1985). The heating of the east-facing foothills in the morning hours causes air to flow up the South Platte River valley in the late morning through the evening hours. This flow reaches a peak in downtown Denver at around 4:00 p.m. Thereafter, winds weaken and eventually shift direction down the valley, becoming westerly around Coors Field between 10:00 p.m. and midnight. This downslope pattern persists until the process reverses itself the following morning (Figure 2).9
Certainly, westerly winds do occur, as we found during our data collection inside Coors Field. But these westerly winds are the exception to the rule, occurring due to local thunderstorms or the passage of frontal systems. Thus, westerly winds seem to be relatively brief events followed by a return to the “normal” upslope-downslope pattern.
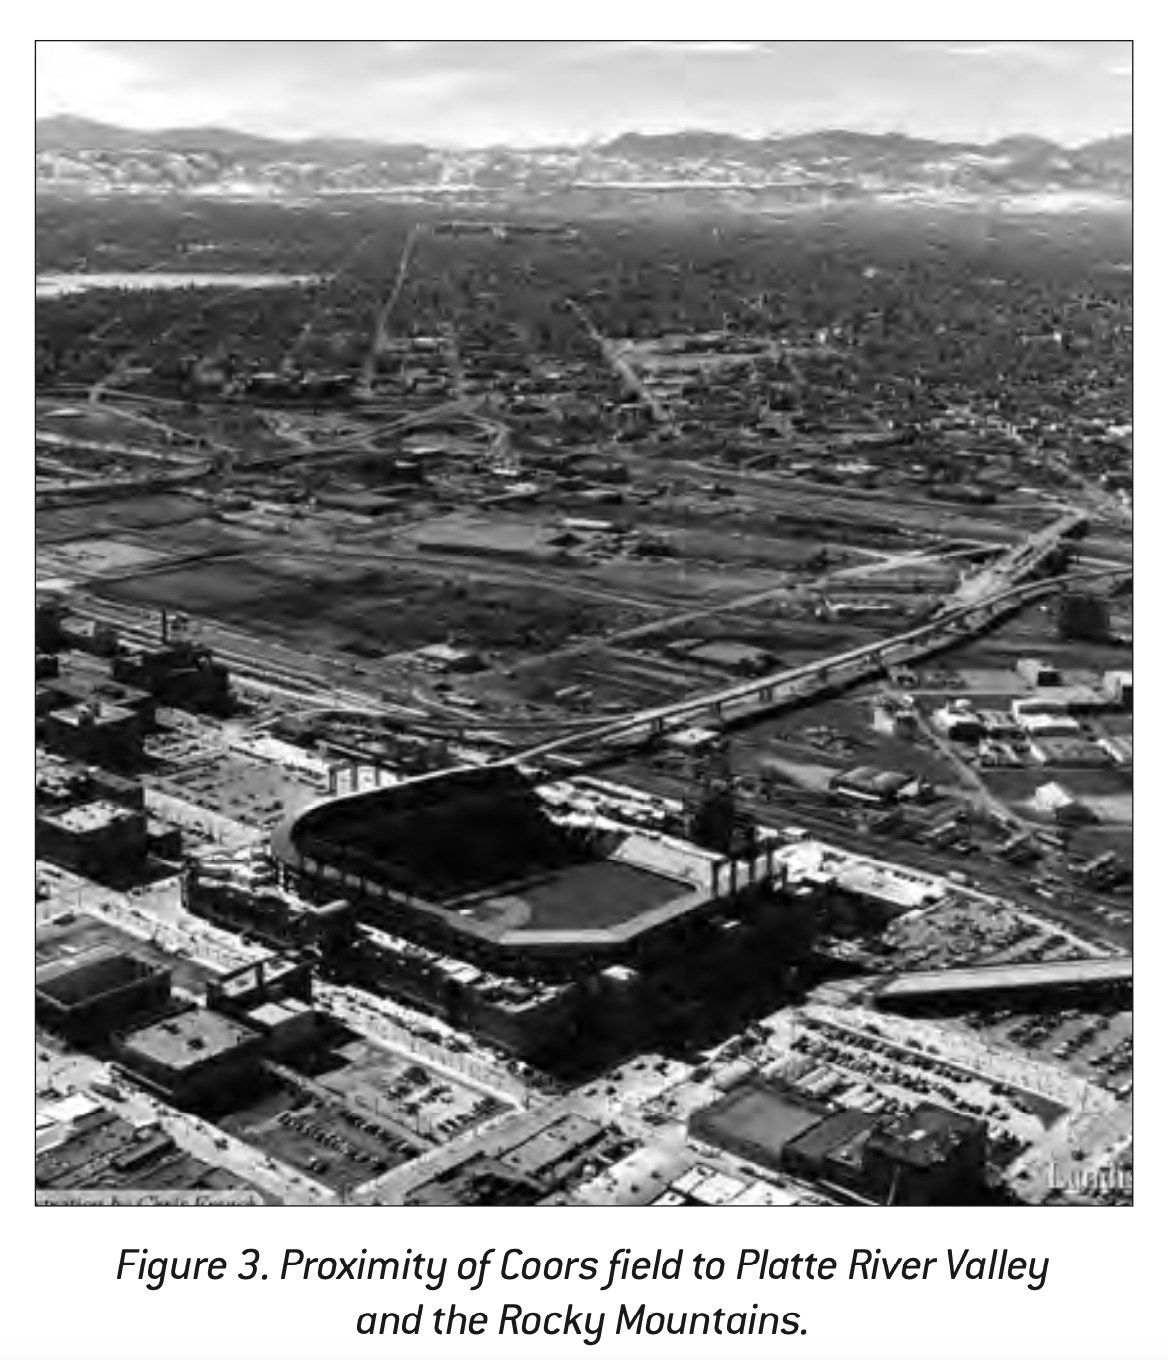
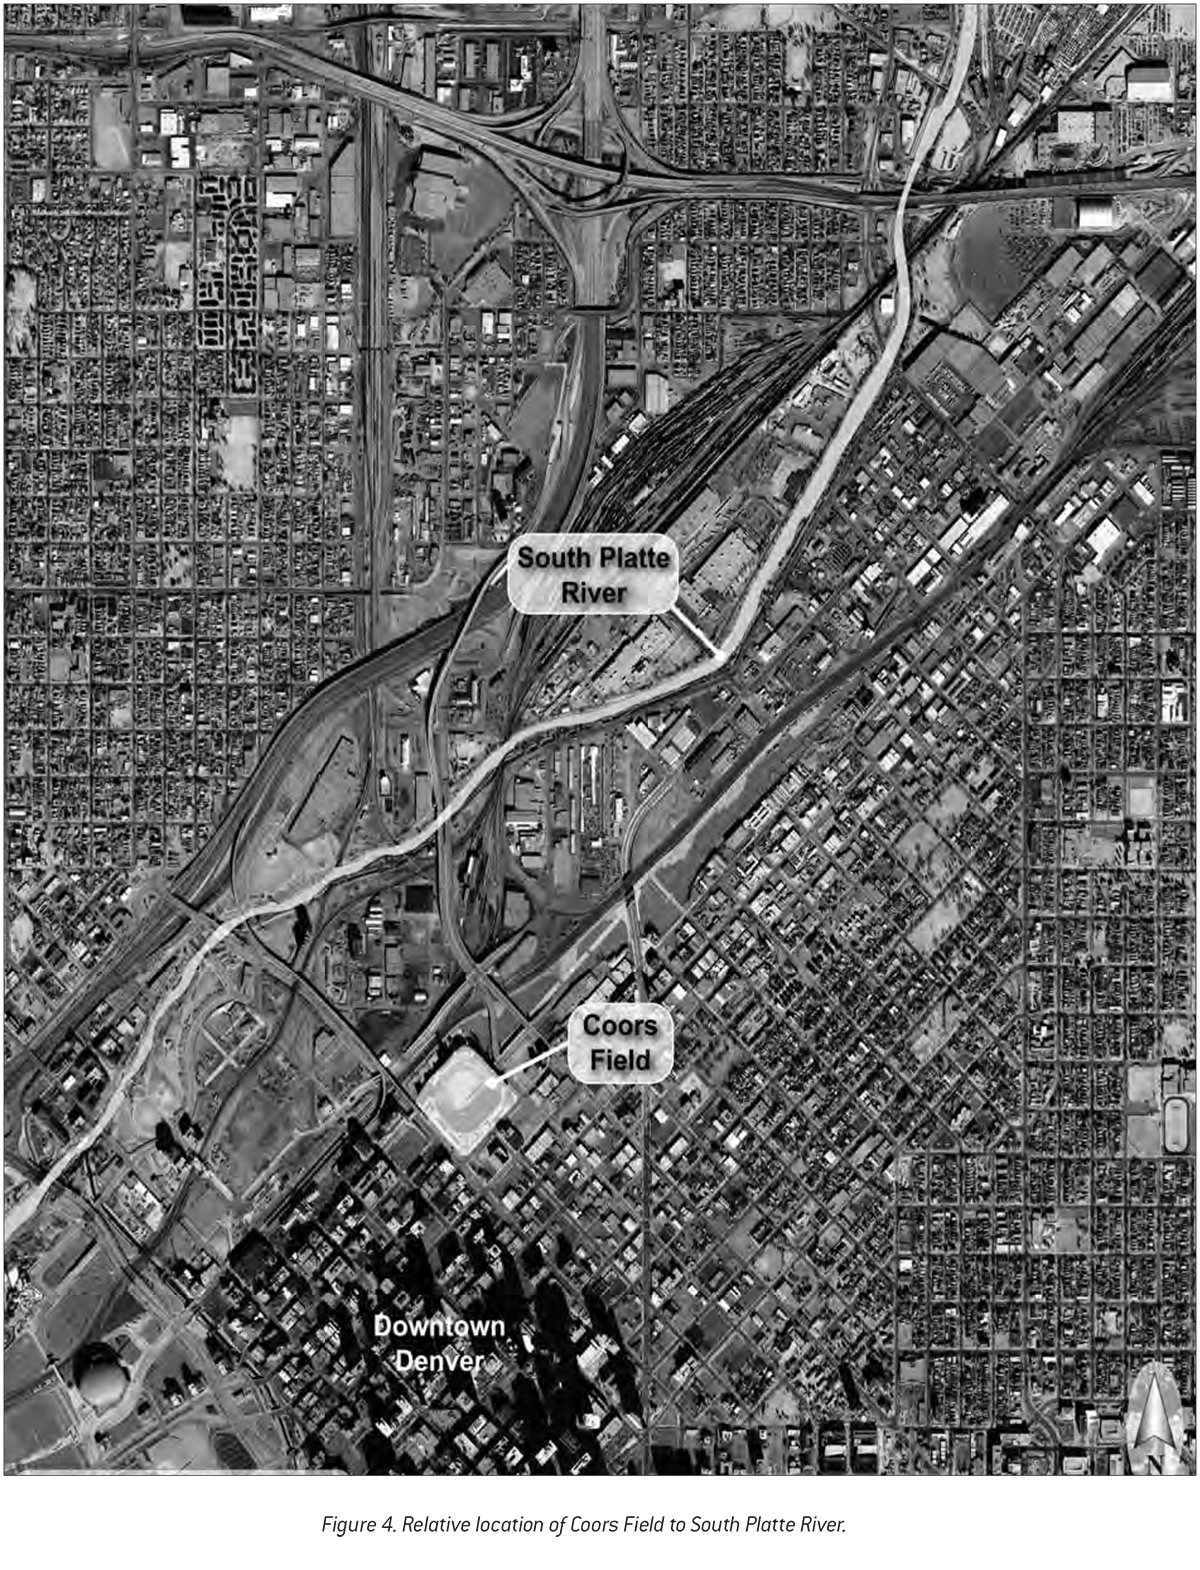
Our assessment is that these daily easterly winds suppress fly ball distances at Coors Field.10 Easterly winds flow up the South Platte River valley and enter the vicinity of the ball park from the northeast. Within Coors Field, northeasterly winds blow from center field toward home plate into the face of the batter and into the path of batted balls hit to all parts of the outfield (Figures 3 and 4).
The expected advantage of playing at mile-high elevation (as far as home runs are concerned) is decreased substantially under such conditions. However, when the winds are out of the west, the full advantage of altitude is realized, and then some. Thus, the effect of the wind is variable; during some games, the enhancement of altitude on fly ball distance will be realized and in other games it will be suppressed. However, it is our conclusion that over the course of a season—or several seasons—easterly winds act to minimize the effects of low air density and thus account for the shorter than expected fly ball distances at Coors Field.
THE COORS FIELD “EFFECT”
Now let’s turn to the second question: if not just thin air, then what else explains the impressive home run statistics at Coors Field? After all, during the 1995 through 2002 seasons, Coors Field witnessed a rate of .044 home runs per at-bat, while the combined average of the other National League parks was just .029 home runs per at-bat. In other words, home runs occur at Coors Field at a rate that is 52% greater than at the other ball parks—far more than would be expected even if the mile high atmospheric enhancement was realized to its fullest (James 1995-2000, STATS Inc. 2001, Carter et al. 2002). We believe that the answer to the question has to do with two factors: first, the personnel make-up of the Colorado Rockies ball club in terms of both hitters and pitchers; and, second, the general problems of pitching at altitude.
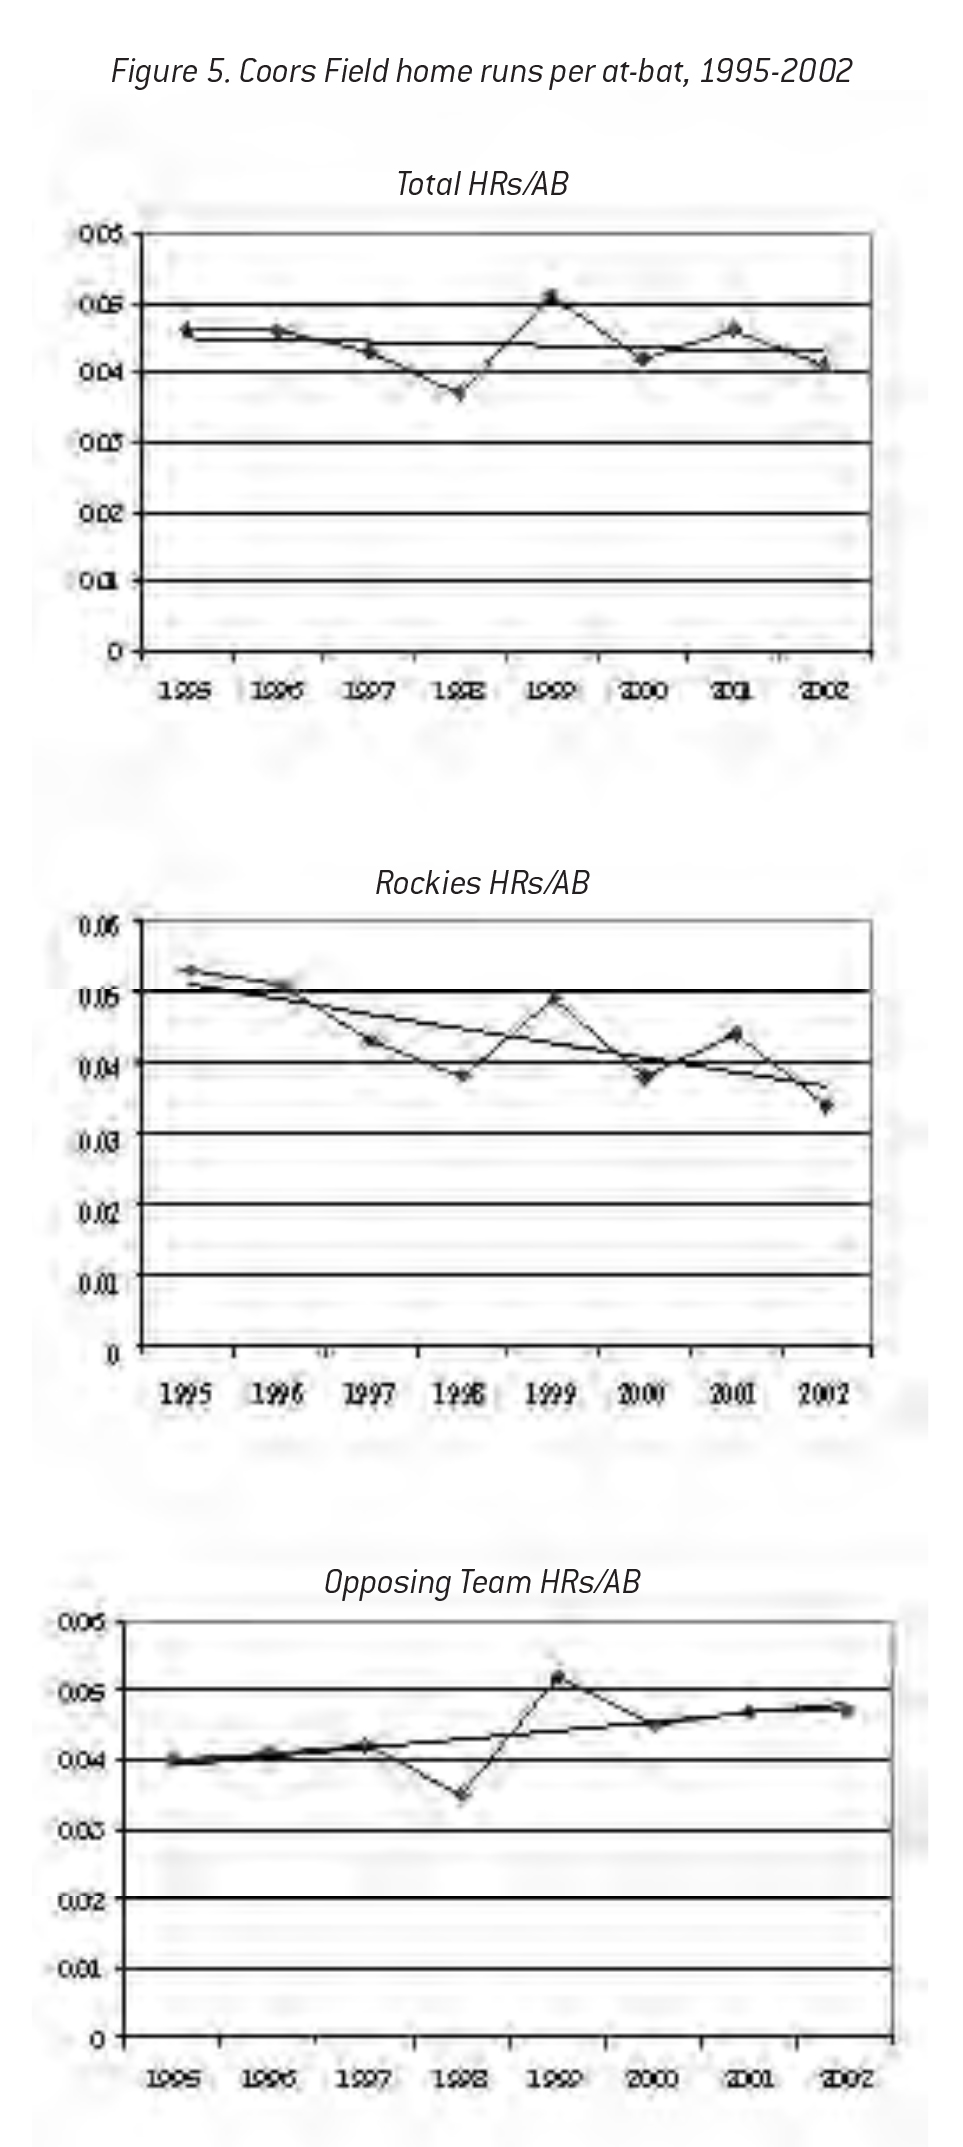
During the first several seasons played at Coors Field, the Rockies team was stacked with notable power hitters. Simply put, they were a team designed to produce large numbers of home runs. However, over the past several years, these “Blake Street Bombers” were traded or allowed to leave via free agency as team management shifted focus from home run hitters to high- average hitters with less power. This personnel shift is verified in the record of Coors Field hitting statistics. Since 1995, there is an overall downward trend in the number of home runs per at-bat—a trend that is accounted for by a reduction in the number of home runs hit by the Rockies (the trend in home runs per at-bat for the opposition at Coors Field has risen) (Figure 5).
In fact, during the 2000 season, Coors Field was surpassed in home runs per at-bat by both Busch Stadium in St. Louis and Enron Field in Houston. Thus, the large number of home runs hit at Coors Field can be attributed, in part, to the specific group of hitters assembled early on by the Rockies. Once the franchise changed the character of the team, the pre-eminence of Coors Field as the league’s ultimate home run ball park was somewhat diminished.
The Rockies have also lacked successful pitching for most of their history. Colorado pitchers have had more than their share of problems over the past eight years, both at home and on the road. Between 1995 and 2002, the team was either last or next to last in most pitching categories, leading the league in home runs allowed seven times. Had the Los Angeles or New York staffs pitched at Coors Field for 81 games per year, the ball park’s home run totals would most likely have been significantly less. Put Atlanta’s pitching staff in Denver for half of their games and this reduction is a virtual certainty. Remember that Atlanta’s Fulton County Stadium was known as the “launching pad” until the Braves put together the league’s premier group of pitchers in the early 1990s.
But perhaps the most important factor in explaining the home run numbers in Denver is the “Coors Field Effect”—the not so subtle influence of the ball park on pitchers from both the home and visiting teams. Most of these professional athletes are clearly intimidated by Coors Field. As one player recently observed, the ball park causes “an identity crisis” for pitchers, leading them to change their approach to the game, move away from their strengths, and ultimately lose confidence in their abilities.11 Even the league’s best pitchers often come unglued in Denver. Pitching is undeniably more difficult in Coors Field than in other National League ball parks because of the very limited foul ground and the cavernous outfield spaces. This field configuration gives hitters more chances, allows more balls to drop in front of outfielders, and permits more balls to find the gaps for extra-base hits. Yet, beyond this, most pitchers are beset with a range of other problems once they take the mound. Chief among these are a sudden lack of control, breaking balls that don’t break, and sinker balls that don’t sink. The result is more pitches thrown straight and over the heart of the plate, and more balls hit high, deep, and out the park. Thus, what we suggest is that more home runs are hit at Coors Field not because routine fly balls carry farther, but because a higher percentage of pitched balls are hit harder than in other ball parks.
These pitching problems in Denver have also been attributed to low air density. Theoretically, thin air reduces ball-to-air friction, cutting down on ball movement between the mound and home plate and thus decreasing the overall control of the pitcher and the effectiveness of the pitches thrown. In addition, the low relative humidity at altitude promotes evaporation from the baseball itself, making the ball lighter, drier, and more slick in Denver than in other parks around the league. Because of this, pitchers at Coors Field have a very difficult time getting a proper grip on the ball, which, in all likelihood, further reduces their control as well as the movement on their pitches.12 During the 2002 season, in an effort to counteract the presumed effects of thin air on pitching, the Colorado Rockies began using a “humidor” to store baseballs at Coors Field; this device maintains the balls in a controlled environment of 90 degrees and 40% humidity. According to the Rockies organization, the intent of the humidor is to ensure that the baseballs do not shrink to a weight less than the 5.0 to 5.25 ounce range specified by the league. The Rockies ball club also believes that these baseballs—having not yet lost water content to evaporation when they enter play—are easier to grip, and thus will ‘level the playing field’ for pitchers in Denver. But this might be just wishful thinking: a comparison of the statistics for the 2002 season versus the previous seven seasons indicates that the humidor had little if any effect upon games played at Coors Field.13
Ultimately, these altitude-related issues may prove to be important contributors to the poor pitching in Denver, but, for now, difficulties on the mound would seem to be more the result of the fragile psychology of pitchers faced with the imagined specter of baseballs floating out of Coors Field like weather balloons. Based upon the analysis presented above, we believe that the answer to why so many home runs are hit at Coors Field lies as much on the field as it does in the air.
COORS FIELD: KEEPER OF THE FLAME?
In 1998, the Colorado Rockies hosted the Major League All-Star Game. It was a very high-scoring affair won by the American League team. Upon departing Coors Field, the national sports media complained vociferously about the style of baseball played at the ball park. Baseball reporters and commentators focused on the large number of “cheap” home runs, and on the ways in which the ball park’s spaciousness allowed too many runners to circle the base paths.
Chief among these critics was Boswell of the Washington Post. He stated: “When baseball is played a mile in the air, all the game’s distances are suddenly off. Instead of being a thing of beauty, baseball suddenly becomes not only distorted, but actually defaced and displeasing. The activity conducted in Coors Field is simply not baseball any more. And, worse, it’s not some kind of new, novel, fun variant on baseball, either. What the All- Star Game put on display for tens of millions to see was a 20th century commerce-driven practical joke played on a 19th century American heirloom” (Boswell 1998: 6D). Thus, for Boswell—and for the many others that share these views—baseball played in Denver is “a confused, capricious mess” because it violates the game’s perfect dimensions.
There is no denying that the game played at Coors Field is a high-scoring, offensive brand of baseball. As we have shown, this is not the simple and direct result of Denver’s rare atmosphere, allowing routine fly balls to become home runs, but has as much or more to do with the personnel of the home team, the size of the outfield, limited foul territory, and assorted pitching problems. Yet, to dismiss Coors Field as an affront to baseball tradition is ludicrous and more than a little hypocritical. After all, what is Fenway Park’s beloved “Green Monster” if not a complete aberration of baseball’s perfect dimensions? Why is a short fly ball that ricochets off Fenway’s left field wall for a double thought to be charming while a bloop single in front of an outfielder at Coors Field is considered to be “an abomination”? To take this further, what was perfect about routine fly balls dropping for home runs over a short, waist-high right field wall at Yankee Stadium in its original configuration? And, could Willie Mays have made the most famous catch in baseball history anywhere but in the horribly distorted center field of the Polo Grounds?
In our view, the self-appointed guardians of baseball tradition like Boswell miss the point entirely. The very heart and soul of the game’s tradition lies not in some homogenous set of outfield dimensions, but in the individuality and distinctiveness of major league ball parks. This point was made forcefully when much of the game’s appeal was destroyed by the proliferation of multi- purpose stadiums in the 1960s and 1970s. Most of these “cookie- cutter” venues had perfect dimensions but had absolutely no character or soul, and are now being replaced by ball parks explicitly designed to recall the variation and peculiarity of turn- of-the-century fields.
Sure, baseball played at the Denver ball park is a little different by virtue of its location. But, in this sense, Coors Field is anything but an aberration; it represents a continuation of a long-standing and cherished tradition of quirk-filled ball parks, which gives baseball a unique charm in every city where the game is played.
Sources
Adair, Robert K. The Physics of Baseball. New York: Harper Perennial, 1990.
Adair, Robert K. The Physics of Baseball (2nd Ed.). New York: Harper Perennial, 1994. Armstrong, Jim. “Still Solving the Big Mystery.” The Denver Post, March 30, 2003: 3J. Boswell, Thomas. “Coors Field is a Mistake That Mustn’t be Repeated.” The Denver Post, July 10, 1998: 1D, 6D.
Brancazio, Peter J. SportScience: Physical Laws and Optimum Performance. New York: Simon and Schuster, 1984.
Carter, Craig, Tony Nistler, and David Sloan. Baseball Guide, 2003 Edition. 2002, St. Louis: The Sporting News.
Chambers, Frederick, Brian Page, and Clyde Zaidins. “Atmosphere, Weather, and Baseball: How Much Farther do Baseballs Really Fly at Denver’s Coors Field?” 2003. The Professional Geographer.
James, Bill. Major League Baseball Handbook. 1996-2001 Editions. Skokie, IL: STATS, Inc., 1995.
Kingsley, R.H. “Lots of Home Runs in Atlanta?” Baseball Research Journal 9. (Society for American Baseball Research, 1980): 66-71.
Kraft, Mark D. and Brent R. Skeeter. “The Effect of Meteorological Conditions on Fly Ball Distance in North American Major League Baseball Games” (1995). The Geographical Bulletin 37 (1): 40-48.
Moss, Irv. “Braves Contend Coors Baseballs are Slicker.” The Denver Post, May 9, 1999: 18C.
Renck, Troy. “Neagle Staying True to Form.” The Denver Post, March 5, 2003: 14D. Skeeter, Brent R. “The Climatologically Optimal Major League Baseball Season in North America” (1988). The Geographical Bulletin 30 (2): 97-102.
STATS, Inc. Major League Baseball Handbook 2002. Skokie, IL: STATS, Inc., 2001.
Toth, James J. and Richard H. Johnson. “Summer surface flow characteristics over northeastern Colorado (1985).” Monthly Weather Review 113 (9): 1458-1469.
NOTES
1. This paper is based on a lengthier research article forthcoming in The Professional Geographer, a publication of the Association of American Geographers (AAG). See Chambers, Page, and Zaidins (2003). Permission to reuse the research material presented herein was granted by the AAG (http://www.aag.org).
2. See Adair (1990, 1994) and Brancazio (1984). Ten% is the standard estimate of elevation enhancement for Denver versus sea level. We constructed a mathematical model for the fly ball based upon Adair and Brancazio. The key variable in this model is the drag coefficient, a measure of air resistance. We used various values for the drag coefficient and came up with predicted enhancements ranging from 7% to over 13%. Given this, the standard 10% prediction seems reasonably accurate. For further discussion see Chambers, Page, and Zaidins (2003).
3. Because the timeframe of our analysis is 1995-1998, we used only those cities with ballparks that were used for National League games during each of these four years. County Stadium in Milwaukee and Bank One Ball Park in Phoenix were excluded from the analysis because National League games were played in these cities only in 1998.
4. Average outfield dimension was obtained by averaging the distances at five points along the outfield wall for each ball park: the left field line, left center field, center field, right center field, and the right field line. In a few cases, the dimensions of the outfield were changed in an existing ball park during our four-year study, or a team changed ball parks altogether In these cases, we used an average of the old and new dimensions. The source used for establishing average outfield dimension was James (1995-1998).
5. If Mark McGwire had played for the Colorado Rockies during 1998, his pursuit of the single season home run record would have been hounded by the asterisk of elevation-enhanced play. Instead, McGwire conducted his quest in St. Louis, protected by a hallowed baseball tradition and unfettered by any lingering doubts, while nevertheless enjoying the advantages of a ball park that is every bit as conducive to home run production as Coors Field in terms of how far the average fly ball carries relative to the average position of the outfield fence.
6. The Colorado Rockies Baseball Club allowed us access to Coors Field in order to set up our weather stations and to periodically check on the equipment and download data. We would like to emphasize that the Rockies organization did not solicit this study nor did they offer or provide any support or remuneration for the research.
7. First, a correlation matrix was developed on the data, showing that temperature and relative humidity had little if any correlative value with fly ball distance. Only wind—specifically the “U” (east-west) vector—was correlative. Step-wise multiple regression analysis was then employed to determine the explanatory value (if any) that could be attributed to meteorological variables with respect to the fluctuation in fly ball distance at Coors Field. Only one variable, again the “U” (east-west) vector, was statistically significant (at a 95% confidence level) enough to enter the model in this test. This resulted in an r2 value of 0.223, or an r2 value of 0.192 when adjusted for degrees of freedom.
8. Correlation analysis of wind direction and flyball distances verified these results. Average fly ball distances displayed a negative correlation with east winds (r- value = -0.45); while a positive correlation was yielded with west winds (r-value = 0.49).
9. These conclusions are drawn from our examination of data provided by the Colorado Department of Public Health and Environment, Air Pollution Control Division (APCD) for the years 1995-1998. The APCD has several air quality monitoring stations in and around the Denver metropolitan area. These stations measure pollution as well as wind direction and velocity. Wind data was analyzed from the two stations closest to the ballpark; one of these stations is within two city blocks of Coors Field. Data on wind direction and velocity from these stations were averaged hourly for each month of the baseball season, April through September, for the years in question. Easterly winds dominated the afternoon and evening hours of this four-year-long period. In fact, our results showed that during this time, there never was a westerly component to the average wind vector between the hours of noon and 10:00 PM.
10. For a more detailed discussion of our meteorological analysis of CoorsField, see Chambers, Page and Zaidins (2003).
11. This quote is from pitcher Denny Neagle of the Colorado Rockies (Renck 2003).
12. For years, manager Bobby Cox of the Atlanta Braves has blamed Denver’s aridity for the pitching problems at Coors Field. He has claimed that the dryness of the ball causes pitchers to have problems with their grip (Moss 1999).
13. The statistics of the 2002 season do not provide much evidence that the humidified baseballs helped pitchers at Coors Field. On the one hand, supporting the idea that the humidor had an effect, runs per at-bat and hits per at-bat were down from 2001. However, there was no dramatic change, and these numbers were very similar to those for past seasons. On the other hand, home runs per at-bat were actually higher than some previous years, strike outs per at-bat were significantly lower than the previous season, and base-on-balls per at-bat did not register historic lows as might have been expected (James 1995-2000; STATS, Inc. 2002; Carter et al. 2002).