

Keith Hernandez and Cooperstown: A Data Synthesis and Visualization Project
This article was written by Stephen D. Dertinger
This article was published in Fall 2023 Baseball Research Journal
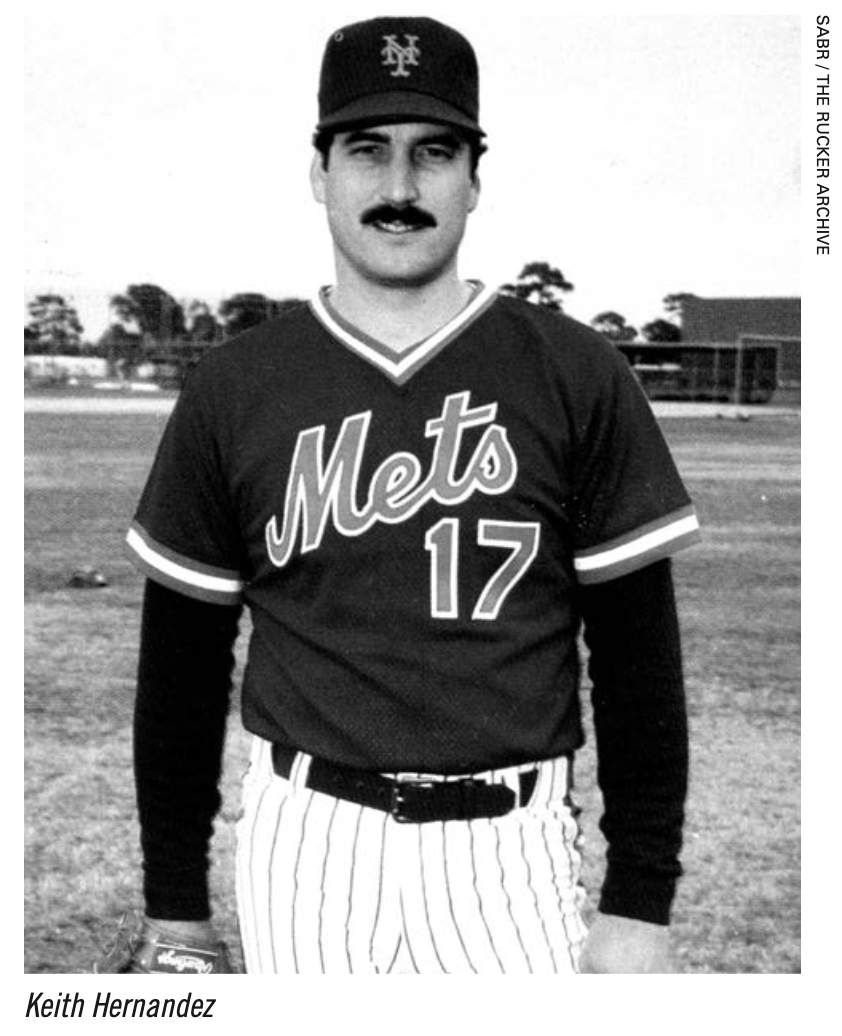
There is no shortage of arguments either for or against Keith Hernandez’s enshrinement in the Hall of Fame. I have no horse in this race. I am not a rabid Mets fan, and I did not know much about Hernandez prior to this project. I was aware he played an important role for the 1986 World Series champion Mets, appeared in two Seinfeld episodes, and served as a well-regarded color commentator for Mets baseball games. That’s about it. However, I was intrigued by Chris Bodig’s well-researched article at Cooperstown Cred, which stated the complex case for and against Hernandez’s enshrinement.1 Articles about Hall of Fame controversies often construct an argument by piling one statistic on top of another. I wondered whether a data synthesis and visualization tool described in a previous BRJ article might shed some light on the case.2
This approach analyzes the performance of MLB players using software originally intended for use in toxicology.3 The initial reports demonstrated that the program and its output are particularly useful for ranking, categorizing, and generally comparing the performance of multiple players. The Hernandez controversy encouraged me to investigate whether this flexible data analysis tool might help the baseball community consider Hall of Fame candidates objectively. The current project involves comparing Hernandez to his contemporaries, as well several Hall of Fame first basemen who did not overlap with him, in order to provide additional benchmarking opportunities. To my knowledge, Keith Hernandez is the first such player to be evaluated in this way and for this purpose.
METHODS
Software Overview.The Toxicological Prioritization Index, or ToxPi for short, is an analytical software package that transforms multiple sources of evidence into integrated visual profiles. It was developed by Professor David Reif and colleagues at the North Carolina State University. They have made the Java-executable script freely available at the Toxicological Prioritization Index website.4
Visually, ToxPi profiles are represented as circles that have been divided into a user-defined number of slices. For the analyses described here, each circle represents a different MLB player, and each slice within a circle represents a particular performance metric. The distance each slice protrudes from the center of a circle is proportional to a player’s performance. The lowest value found for any particular statistic within a dataset under consideration is given a value of zero, and the highest value is given a value of one. All intermediate values are scaled proportionally. The worst performer for any particular statistic will show a slice with no protrusion, and the best performer for any particular statistic will show a protrusion that extends all the way to the circle’s perimeter. The program also calculates an overall ToxPi Score. This is the sum of the slice scores, and is also rescaled to a value between zero and one.
It is possible to give different “weights” to each slice, but this feature was not utilized for the analyses described here.
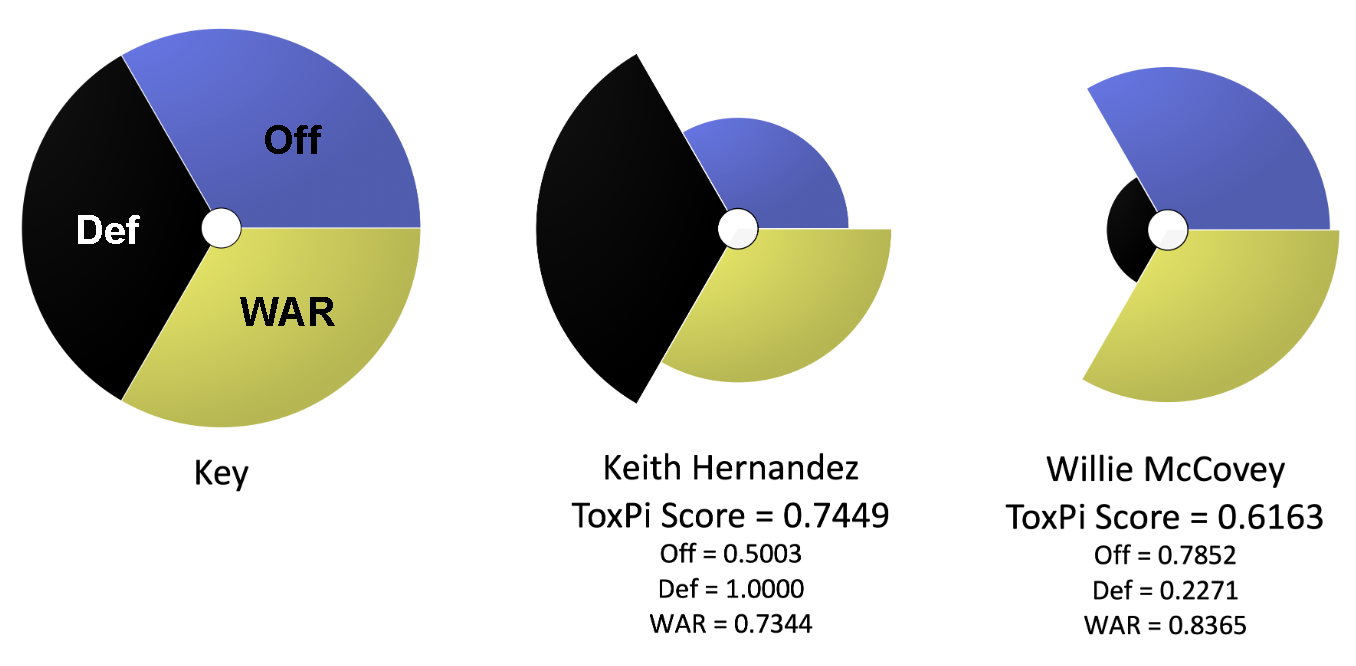
Figure 1 shows two player profiles and is provided to familiarize readers with the basic ToxPi structure. Besides the software’s ability to distill complex statistics into informative summary graphics, it provides quantitative results in the form of Slice Scores, which correspond to individual performance metrics, as well as an aggregate performance metric, the ToxPi Score.
The analyses presented here use FanGraphs data. Analyses focused on first basemen who played at least five seasons in a similar timeframe to Hernandez (between 1970 and 1995). To qualify as a season, the player needed to appear in a minimum of 100 games. Several Hall of Fame first basemen who came before or after Hernandez were also included. In total, 30 first basemen were evaluated, seven of whom are in Cooperstown: Harmon Killebrew, Orlando Cepeda, Tony Perez, Willie McCovey, Eddie Murray, Jeff Bagwell, and Frank Thomas.
Traditional Statistics.Two types of ToxPi-based analyses were conducted. The first relied on what we’ll refer to here as traditional statistics. This analysis considered the slash line statistics AVG, OBP, and SLG. Additionally, All-Star selections, Gold Gloves, and MVPs were tabulated and considered at the career level. Since many of the seasons considered pre-date the beginning of the Silver Slugger Award in 1980, it was not factored into the analysis.
Advanced Statistics.The second type of analysis is referred to here as advanced statistics. This analysis considered Def, Off, and WAR. As explained at FanGraphs, Def is Defensive Runs Above Average, which measures a player’s defensive value relative to league average.5 Unlike some other advanced statistics that provide information about a player’s value relative to league average, Def adds a positional adjustment to facilitate comparisons across positions. Off is Offensive Runs Above Average, which combines FanGraphs’ park- adjusted Batting Runs with Weighted Stolen Base Runs, Weighted Double Play Runs, and Ultimate Base Running in order to give players credit for the quality and quantity of their offensive performance.6 WAR is Wins Above Replacement, a widely utilized statistic that attempts to summarize a player’s total contribution to their team in one metric.7
Figure 1
Anatomy of a ToxPi profile; The key on the left indicates which slice represents each statistic. The middle and right profiles show the career-level statistics of Keith Hernandez and Willie McCovey. Hernandez exhibits the highest Def rating, whereas McCovey’s Off and WAR statistics are superior. The ToxPi Score shows Hernandez above McCovey, 0.7449 to 0.6163.
RESULTS AND DISCUSSION
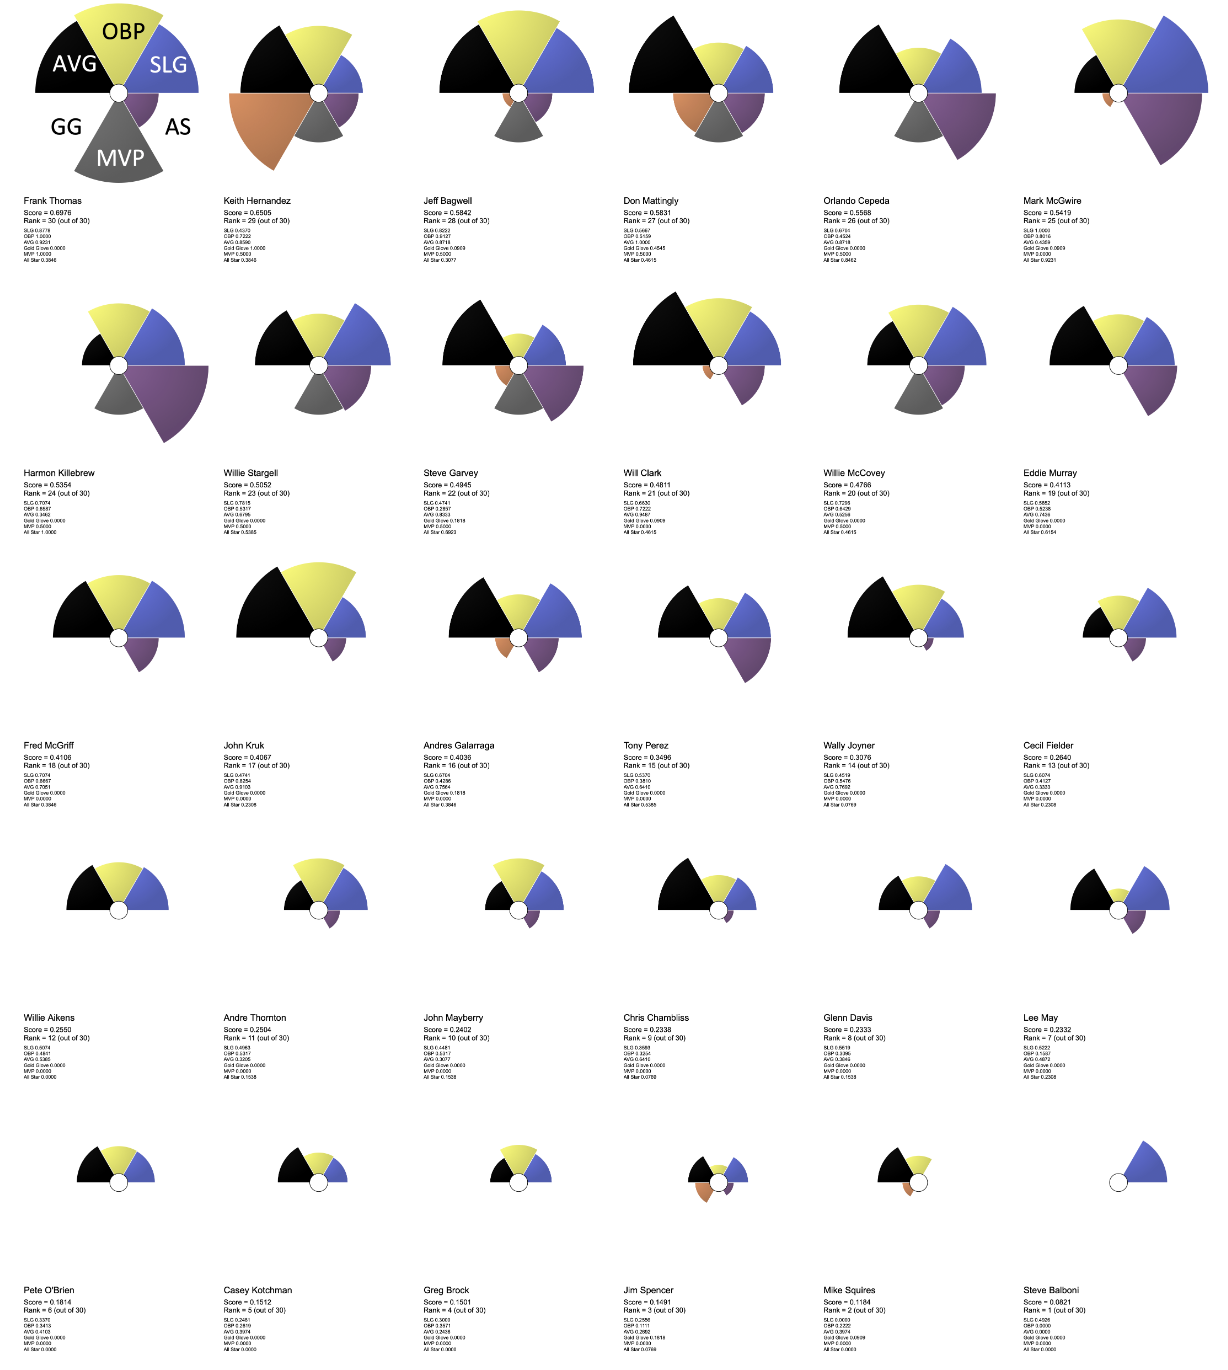
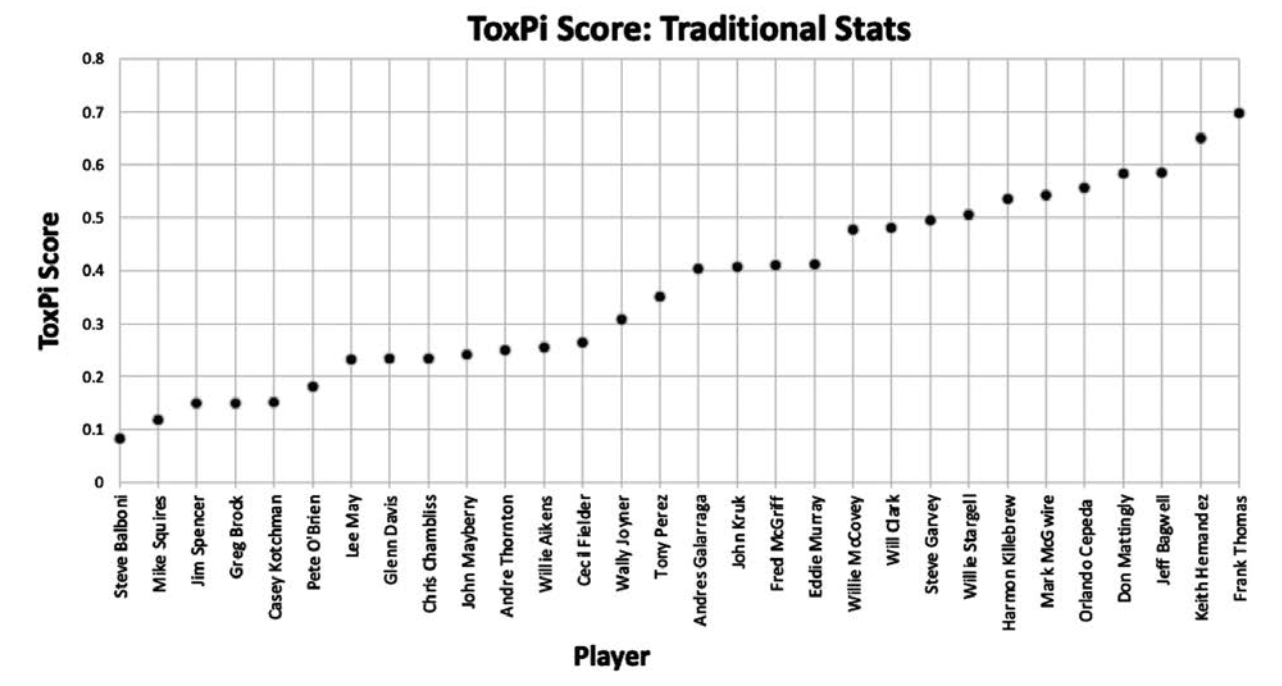
Traditional Statistics. The traditional statistics were evaluated for 30 MLB first basemen using ToxPi. The resulting ToxPi Profiles for every player are shown in Figure 2. Slice Scores and aggregate ToxPi Scores accompany each image. These images are arranged from highest to lowest ToxPi Score as one would read a page of a book—from left to right, top to bottom. Figure 3 plots the ToxPi Scores in ascending order. From these graphics, it is apparent that Hernandez has the second-highest aggregate ToxPi Score. Only Frank Thomas has a higher value. It is also noteworthy that Hernandez has a higher ToxPi Score than six of the Hall of Famers in this group.
Figure 2
ToxPi Profiles using traditional statistics AVG, OBP, and SLG, as well as Gold Gloves (GG), All-Star appearances (AS), and MVP awards. Disregard the “Rank” values which, confusingly rank the best performer as 30 and the worst as 1.
(Click image to enlarge)
Figure 3
Keith Hernandez exhibits the second-highest aggregate ToxPi Score using traditional statistics and accolades. Only Frank Thomas ranks higher.
(Click image to enlarge)
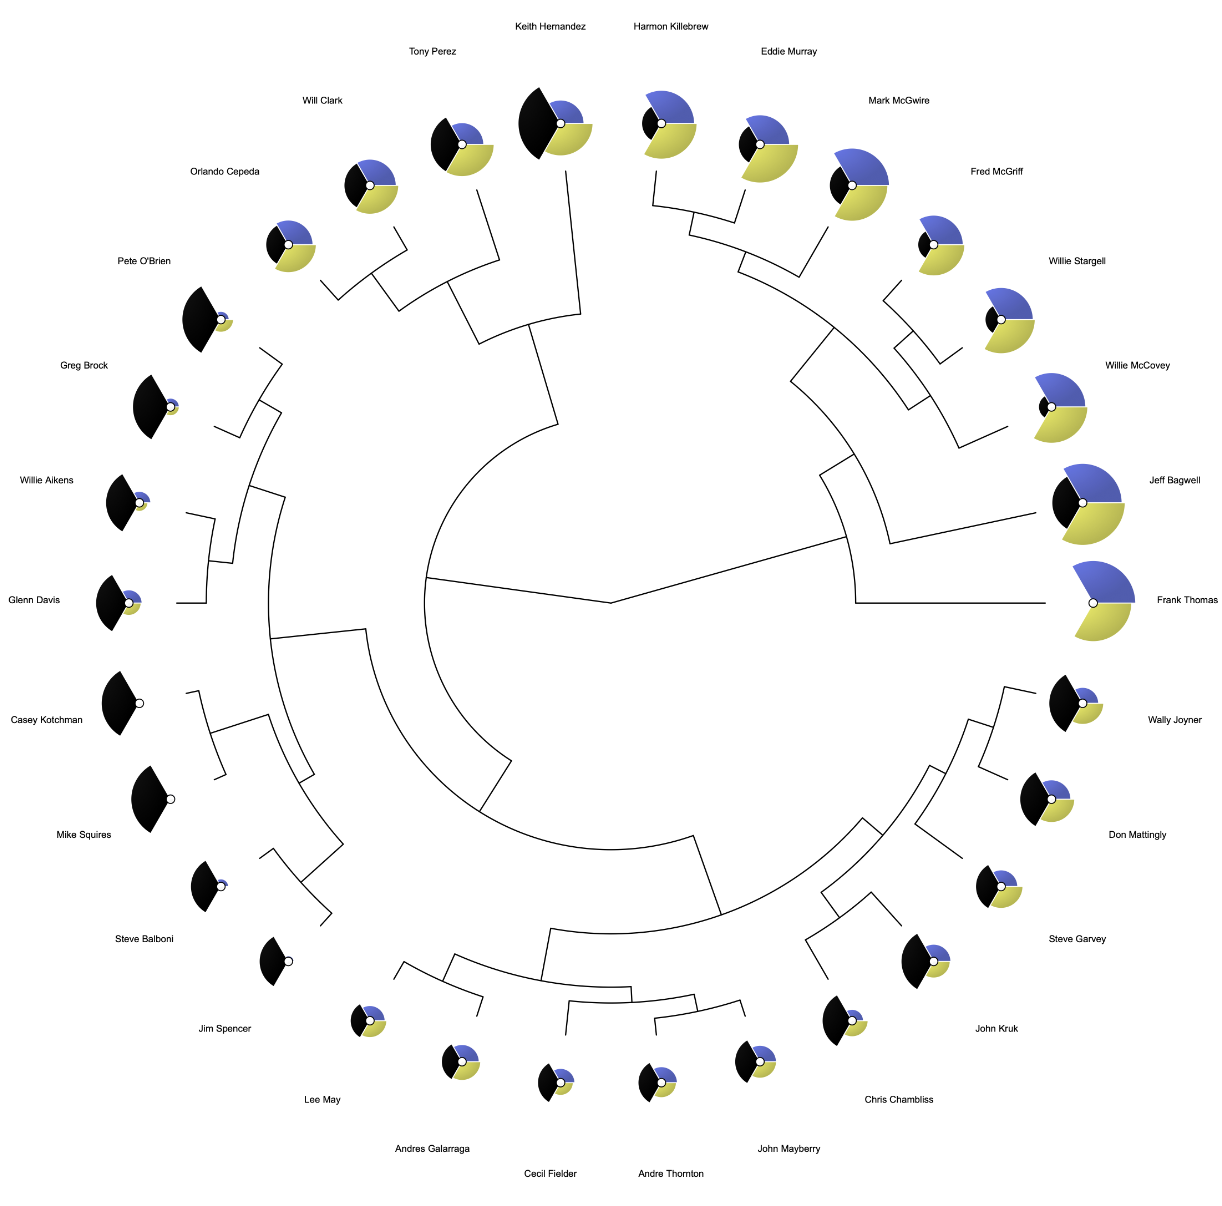
ToxPi has a hierarchical clustering module that automatically groups similar ToxPi Profiles. This module can be useful for evaluating similarity in performance characteristics. Hierarchical clustering results are provided in Figure 4. Keith Hernandez clusters next to Hall of Fame first basemen such as Harmon Killebrew and Frank Thomas. Interestingly, according to this analysis, Hernandez is most similar to Don Mattingly, another well-rounded first baseman who is currently experiencing a contentious Hall of Fame candidacy.
Figure 4
The hierarchical clustering module shows that Keith Hernandez belongs alongside high-performing first basemen, including current Hall of Famers.
Advanced Statistics. The ToxPi Profiles for advanced statistics are shown in Figure 5. Slice Scores and aggregate ToxPi Scores accompany each image. Figure 6 plots the ToxPi Scores in ascending order.
Figure 5
ToxPi Profiles using advanced statistics.
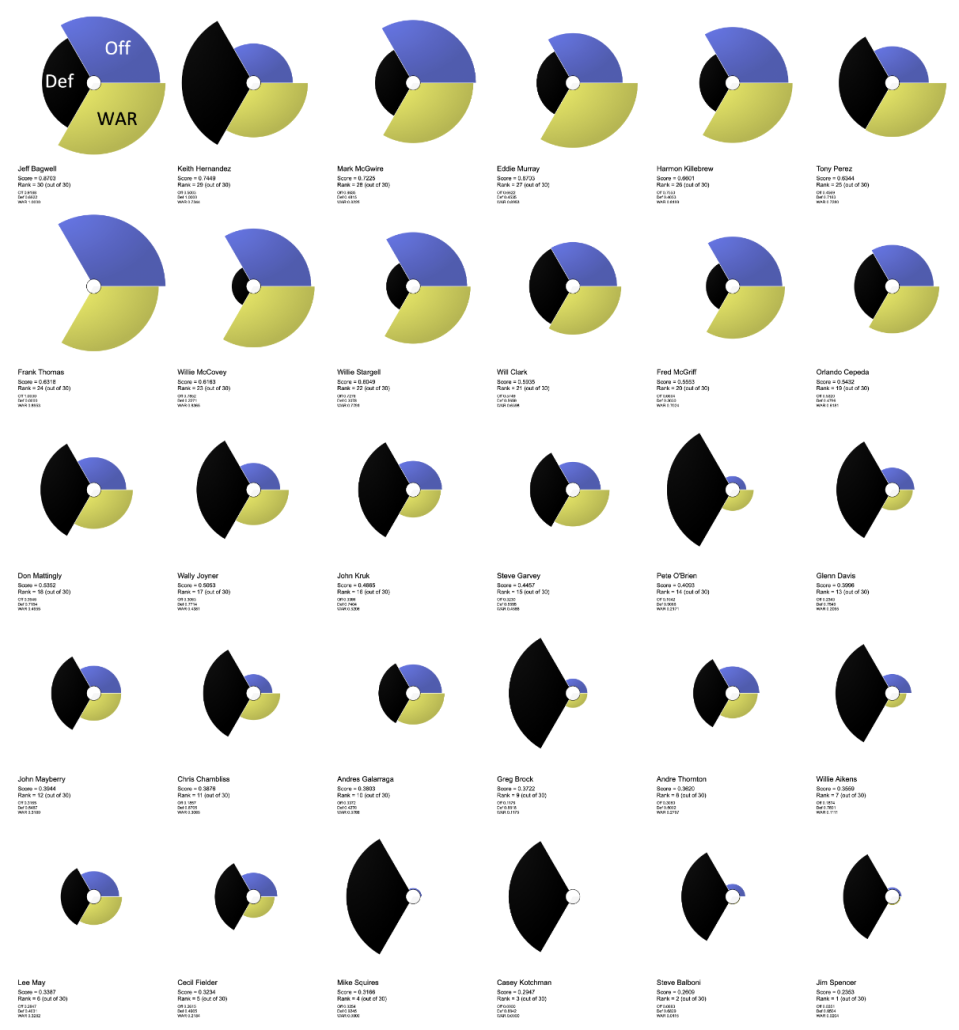
Figure 6
Aggregate ToxPi Scores using advanced statistics. Hernandez once again ranks second, this time to Jeff Bagwell.
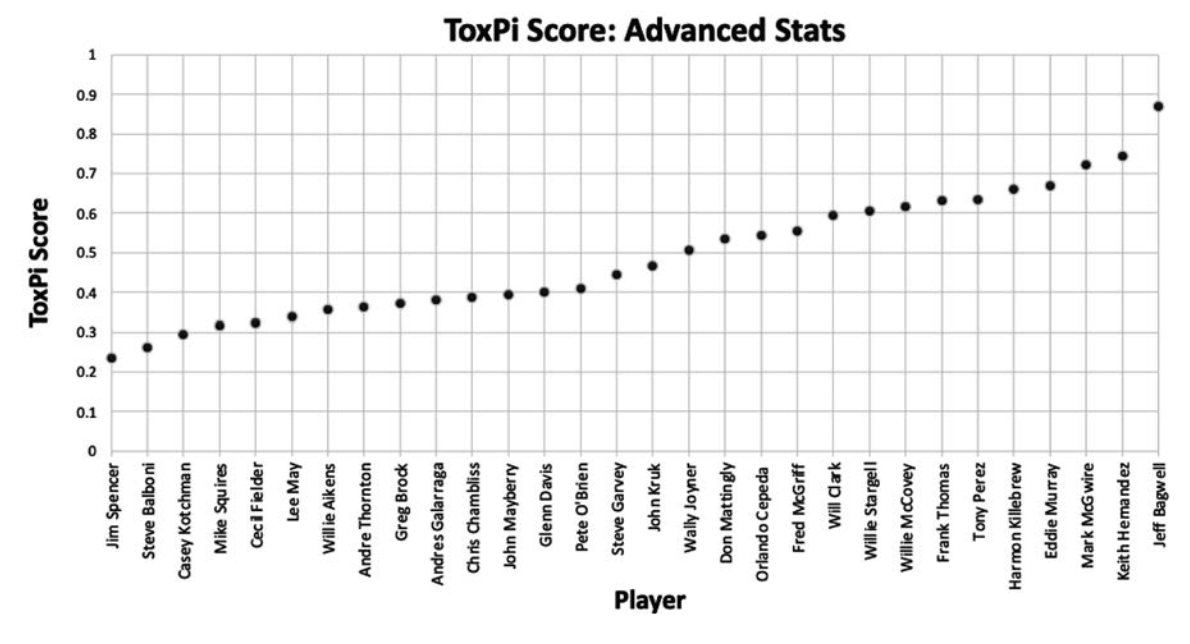
(Click image to enlarge)
Some rankings changed significantly when using advanced statistics rather than traditional statistics. For instance, Jeff Bagwell replaced Frank Thomas in first place, while Thomas fell to seventh. Although Thomas’s prodigious offensive contributions are still apparent, these ToxPi Profiles make it clear that his defensive skills were the weakest of the group. Interestingly, Hernandez’s ranking stayed the same. In both cases, he exhibited the second-highest ToxPi Score.
Prior to the publication of this article, a thorough review of the Advanced Statistics-based ToxPi profiles was conducted by a subject matter expert. This reviewer drew attention to the cases of Willie Aikens and Steve Balboni, both of whom possess reputations for stronger offensive capabilities compared to defensive skills. The reviewer highlighted the counter-intuitiveness of these players’ ToxPi profiles, specifically, the way the graphics show shorter projections for the Off slices and longer projections for the Def slices. Addressing this concern presents a valuable opportunity to discuss a key feature of this platform. That is, the focus of these analyses is inter-player comparisons, not intra-player. A related point to keep in mind is that we are comparing first basemen (historically, where weak defenders have been positioned), and Hall of Fame caliber players are highly represented. Thus, in light of this dataset’s composition, it is in fact accurate and insightful to represent these players as exhibiting relatively high defensive performance (Def values for Aikens, Balboni, and the average for all 30 players are -61.5, -84.6, and -107.6, respectively).
Conversely, while they may have had reputations for good offense, that is not the case when compared to the 28 other players in this dataset. (Off values for Aikens, Balboni, and the average for all 30 first basemen are 69.5, -1.6, and 228.9, respectively.) I hope this discussion of Aikens’ and Balboni’s results reinforce key aspects of the information being conveyed by ToxPi-based analyses—the focus is on inter-player comparisons, and the performance assessments are highly dependent on the range of player performances under consideration.
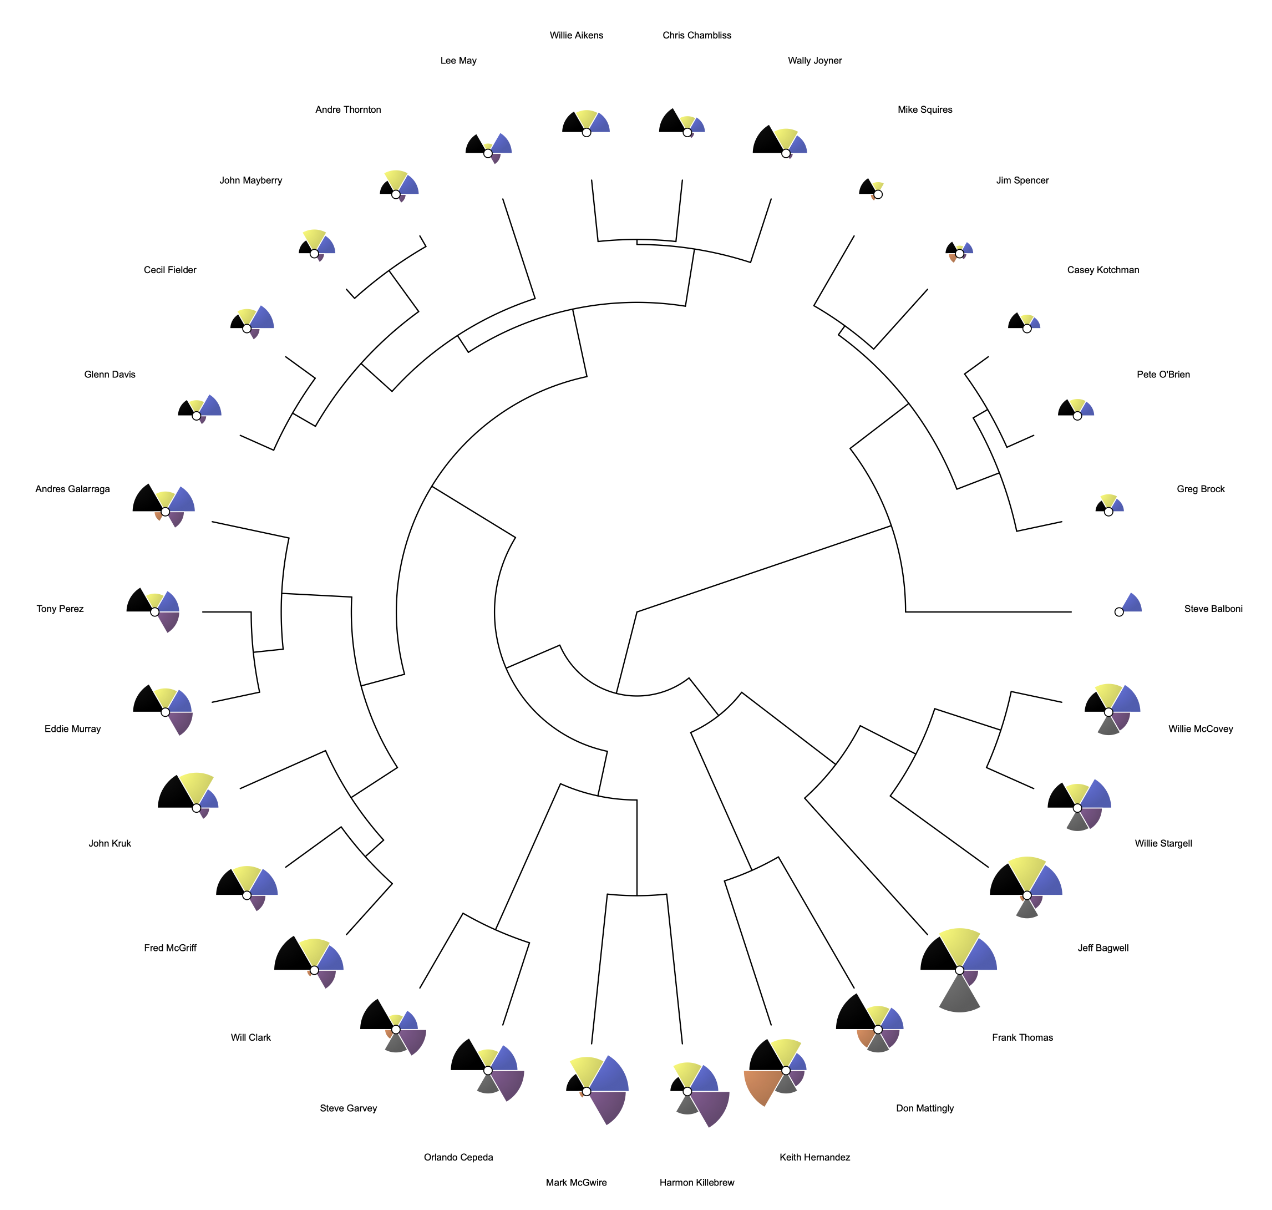
ToxPi’s hierarchical clustering results are provided in Figure 7. As with the traditional statistics, Hernandez clusters alongside Hall of Fame first basemen. This analysis places Hernandez in a subgroup that includes Tony Perez and Orlando Cepeda, though Hernandez’s profile is somewhat offset, owing to his remarkable defense.
Figure 7
Using advanced statistics, the hierarchical clustering module shows Keith Hernandez alongside high-performing first basemen, including current Hall of Famers.
(Click image to enlarge)
CONCLUSIONS
ToxPi-based player performance analyses provided interesting insights into Keith Hernandez’s Hall of Fame case. A key component of this methodology involved synthesizing carefully chosen performance metrics into composite scores. While player performances were distilled into single values, the associated ToxPi visuals provided a clear indication of where they excelled and where they did not.
Hernandez’s ToxPi Profiles revealed defensive excellence both compared to his contemporaries and compared to Hall of Fame first basemen. This supports the conclusions of the many knowledgeable fans who consider Hernandez one of the best defensive first basemen in the history of the sport. ToxPi analyses make it clear that his offense also contributes to his Hall of Fame case.
Whether considering traditional or advanced statistics, ToxPi-based integrated analyses support the contention that Keith Hernandez belongs in Cooperstown. This is clearly something that should be addressed and corrected by the Veterans Committee. Lastly, while the ToxPi-based assessments made no attempt to address sportsmanship, leadership, and other intangibles, general consensus indicates that Hernandez possessed these qualities, further supporting the argument for his enshrinement.
STEPHEN D. DERTINGER, PhD is Director of Research at Litron Laboratories, Rochester, New York. Stephen’s day job has taught him the importance of synthesizing multifactorial data into visuals that can be readily interpreted by a broad range of audiences. Stephen looks forward to fielding questions and receiving suggestions about his research at sderting@rochester.rr.com.
Notes
1 Chris Bodig, “Why Keith Hernandez Belongs in the Hall of Fame,” July 9, 2022, accessed August, 2023. https://www.cooperstowncred.com/keith-hernandez-belongs-hall-fame/.
2 Benjamin J. Dertinger, Stephen D. Dertinger, “Baseball, Hot Dogs, and ToxPi: An Approach for Visualizing Player Performer Metrics,” Baseball Research Journal Spring, 2022, accessed March 3, 2023. https://sabr.org/journal/article/baseball-hot-dogs-and-toxpi-an-approach-for-visualizing-player-performance-metrics/.
3 Skylar W. Marvel, Kimberly To, Fabian A. Grimm, Fred A. Wright, Ivan Rusyn, David M. Reif, “ToxPi Graphical User Interface 2.0: Dynamic Exploration, Visualization, and Sharing of Integrated Data Models,” BMC Blolnformatlcs 19 (2018) 80, accessed August 5, 2023. https://bmcbioinformatics.biomedcentral.com/articles/10.1186/s12859-018-2089-2/.
4 ToxPi: Toxicological Prioritization Index, accessed March 3, 2023, https://toxpi.org/.
5 Neil Weinberg, “Def,” FanGraphs, September 4, 2014. https://library.fangraphs.com/defense/def/.
6 Neil Weinberg, “Off,” FanGraphs, August 28, 2014. https://library.fangraphs.com/offense/off/.
7 Piper Slowinski, “WAR for Position Players,” FanGraphs, April 2, 2012. https://library.fangraphs.com/war/war-position-players/.