

Offensive Explosion: Trends in Hitting Production in Major League Baseball
This article was written by Eric Sickles - Laura Schreck
This article was published in Fall 2018 Baseball Research Journal
Abstract
 2014 was a record year for pitchers, but it was followed by an abrupt reversal in trends, with offensive numbers increasing steadily in 2015 and 2016, culminating in a record-setting year for hitters in 2017. This article explores similar offensive explosions throughout the history of major-league baseball in order to draw parallels to the current extraordinary increase in offense. Evidence of this increase is provided by analyzing the trends of 10 separate statistical categories, as well as the statistical trends of the top 40 hitters and 20 pitchers in the major leagues. This analysis and research provides the context for discussing possible reasons for such a profound offensive explosion. From steroid use to the changes in the manufacturing of the baseball itself, this article discusses the implications of a dramatically changing baseball landscape where offense reigns supreme.
Introduction
1968 was considered the Year of the Pitcher because of league-wide statistics for batting average, on-base percentage, home runs per game, earned-run average, walks and hits per inning pitched (WHIP), and bases on balls per game that had rarely been so low. Forty-six years later, the Year of the Pitcher moniker was revived by baseball pundits as offensive stats dropped to levels that hadn’t been seen since the early ’80s. The glaring difference between 1968 and 2014, however, is that the original Year of the Pitcher was intrinsically anomalous. In other words, there was no significant trend that would lead one to infer such a dramatically favorable year for pitchers. In 1969, statistics generally returned to a level more reflective of those from 1967 and before, though the causes of that may have been Major League Baseball lowering the mound height to the current 10 inches and the shrinking of the strike zone. On the other hand, there is clearly a pitcher-friendly trend in the years leading up to 2014 that hits its apex of pitcher dominance in that season. Indeed, data from the previous 10 years show a trend that favored pitchers in several different measures of pitcher efficiency—batting average, ERA, home runs allowed, WHIP, on base plus slugging percentage (OPS), bases on balls per game, and runs per game.
What can account for the trends that favored the pitcher up to 2014, and their abrupt reversal in 2015? Notably, Robert Manfred became commissioner in 2015 and baseballs manufactured by Rawlings for use in major-league games needed to be redesigned in order to accommodate his signature. This redesign was not intended to otherwise alter the ball, yet still, Manfred joked, “Actually, if there is a surge in offense, we’ll all be happy.”1 Manfred’s joke became reality in the 2015–17 seasons. As offensive records were being set in 2017, Houston Astros pitcher Justin Verlander said, “I know Mr. Manfred said the balls haven’t changed, but I think there’s enough information out there to say that’s not true. Whether he has the say-so or not, I don’t know.”2 A report on the 2015-17 home run surge released in May 2018 by a committee formed by the commissioner said that “the increases in home runs are primarily due to better ‘carry’ for given launch conditions. . . . Analysis shows that the better carry is not due to changes in temperature but rather to changes in the aerodynamic properties of the baseball itself, specifically to those properties affecting the drag.”3
Literature Review
Despite Commissioner Manfred joking about a surge in offense, those marketing baseball may have had the goal of increasing offensive output since the game’s infancy. In 1884, the Chicago White Stockings played at White Stocking Park, where the fences at the foul lines were just under 200 feet from home plate. As if playing in a park smaller than a standard Little League field wasn’t enough to substantially increase power statistics, the organization made the decision to count balls hit over the fence that year as home runs rather than doubles, as it had in the past. This resulted in Chicago’s season home run totals jumping from 13 to 142, which was only the most startling datum in the trend of home runs increasing across the major leagues to their nineteenth-century peak of 764 in 1890.4
Perhaps the most comprehensive research done on the topic of offensive potency in professional baseball was done by the late David Vincent in his book Home Run: The Definitive History of Baseball’s Ultimate Weapon. Vincent outlines the effect of several rule changes in the 1920s that had an impact on offensive production. The nineteenth century ended with Roger Conner atop the career leaders in home runs with just 138. Even still, prior to 1920, league-wide home run production in the twentieth century had been significantly lower than home run production in the nineteenth. This led to three rule changes before the 1920 season that aimed to increase offensive production in order to balance out the dominance of “dead ball” pitching and fielding. The first of these was judging whether a home run was fair or foul not by where the ball landed, but by where it crossed over the fence. This revolutionary rule did not last long however: On June 25, 1920, with fewer than 60 games per team played, the rule was changed back to its 1919 version, thus returning the judgement of a home run by where it “disappears from view.”5 The rule would not return again to its present form until 1931.
The second rule change affected the way that walk-off home runs were scored. Previously, only the number of bases needed to score the winning run would be awarded. In other words, if the game was tied and a runner was on second base, a ball hit out of the park became a double, since, when the runner on second scored, the game ended.6 This new rule allowed walk-off home runs to be scored as such. Interestingly, Babe Ruth is the only player who hit a would-be walk off home run prior to 1920, and also hit one in 1920.
The third and perhaps most hitter friendly rule change was the elimination of instances where a pitch’s natural movement is altered by a foreign substance, such as spit or mud. This rule, after some adjustments over the next year, ended up allowing 17 pitchers to continue throwing spitballs for the rest of their careers.7
Though these rules have had long-term effects on the level of offensive production since their 1920s conception, one key change to the game of baseball was fundamental when looking to the cause of that decade’s power boom: the baseball.
The live-ball era of baseball began in 1920, when baseball manufacturers began importing a higher quality wool from Australia, allowing the baseballs to be more tightly wound. This change in the manufacturing process made the balls more elastic and thus allowed them to travel farther. The new ball and rules resulted in the home run production rate more than doubling in just 10 years, from 630 in 1920 to 1,565 in 1930.8
Similar to 1920, there were also several preseason rule changes in 2015. However, where the 1920 changes, as well as the lowering of the mound in 1969, were specifically designed to increase offensive production, the 2015 changes were focused primarily on increasing the pace of play. The efforts to increase the pace of play included adding an in-stadium clock to limit the time of inning breaks and pitching changes (analogous to a play clock in football). Players would also allegedly be fined if they removed both feet from the batter’s box during an at-bat, though little evidence can be found regarding how much, or how frequently, players have been fined for such offenses. A minor amendment to the existing instant replay rules was also added, stating that managers would no longer be required to leave the dugout in order to challenge a play. Less specific to pace of play alterations, Major League Baseball did increase the number of challengable plays, as well as allowing managers to keep their challenges after every overturned call, rather than the pre-2015 version of the rule that allowed managers to only keep their challenge after one overturned call.9
 The issue of a “live” or “juiced” ball was revived when the 1987 season yielded unprecedented production with the bats, earning it the nickname the “Rabbit Ball Year.” The conspiracy of a juiced ball gained so much steam that MLB conducted internal tests to determine whether its baseballs had been tampered with in the hopes of increased offense output. Not surprisingly, despite the unusually high level of offense, MLB concluded that there was nothing unusual, or “juiced,” about the baseballs.10
In the most recent examination of MLB’s possible attempt to increase offense, Ben Lindbergh and Michel Lichtman in the Ringer note that offensive production increased intensely in the second half of the 2015 season. Strikingly similar to 1987, MLB conducted an internal investigation to determine if the baseball had indeed been made easier to launch. Again, similarly to 1987, the University of Massachusetts, Lowell, Baseball Research Center (BRC), carrying out research for MLB, determined that not only were the baseballs not juiced, but they were in fact 95 percent confident that the results were comparable to previous compliance data.11
Still another possible explanation for the increased number of home runs that many scholars point to is the style of hitting that’s come into vogue, where emphasis is placed on fly balls. In theory, more fly balls would translate to more home runs given the fact that a ball must have a certain amount of loft to carry enough distance to get over the fence. This would explain the dramatic increase in home runs if more fly balls were in fact being hit. In reality, according to Fangraphs, 2015 actually saw a lower percentage of fly balls hit compared to 2014.
Further, Lickman and Lindbergh note that in addition to the BRC and MLB’s independent study in 2017, Washington State University conducted a study to determine if the coefficient of restitution (COR) measurements, essentially a measure of a baseball’s bounciness, were truly different. The study found that Manfred’s new baseball traveled, on average, an additional 7.1 feet.12
While the previous research has provided substantial explanation of previous instances when MLB has made efforts to increase offense, our own research hopes to shed light on the current rise in offense that has greatly affected the game of baseball.
Method
Using data on pitcher efficiency in 2004–17, we ran one-sample t-tests to determine the likelihood that the 2014 data represented an outstanding year for pitching. We examined four key statistics using one-sample t-tests for the 20 top performing pitchers and five key statistics for the top 40 performing batters to see if the same trends held true for their performance as was generally seen in the major leagues. The significance of our results will be measured by “P-Values”; a value of p less than 0.05 (p ≤ 0.05) typically indicates that the results are at least 95 percent significant, or unlikely to be due to chance. A P-Value of p ≤ 0.0001 would mean the results of a t-test are 99.9999 percent significant, or highly unlikely to be due to chance fluctuations.
Data
We gathered statistical data measuring league-wide pitcher performance between 2004 and 2017 in seven key areas—ERA, R/G, HR, WHIP, AVG, OPS, and BB/G—from Baseball-Reference.com. The league-wide data gathered begin in 2004 in order to capture statistics outside of the “Steroid Era” of the early- to mid-2000s which included offensive production that skyrocketed allegedly as a result of illegal use of performance enhancing drugs. Additional data examined included data from the top 20 pitchers and top 40 hitters of 2014 as determined by WAR, to determine whether trends for all players had an equal impact on the statistics of top performers, as well as the home run by pitch type data from Baseball Savant.
Results
Figure 1: ERA, 2004–17
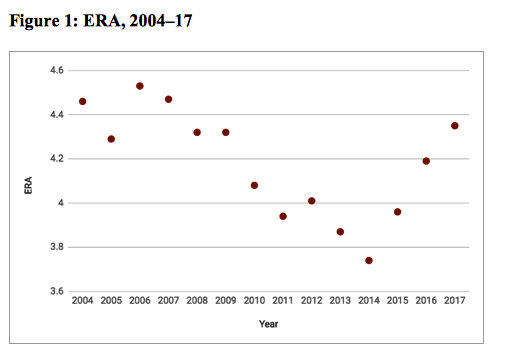
One-sample t-tests (p < 0.0001) indicated a significant difference in ERA in 2014 compared to the 2004–17 sample.
Figure 2: OPS, 2004–17
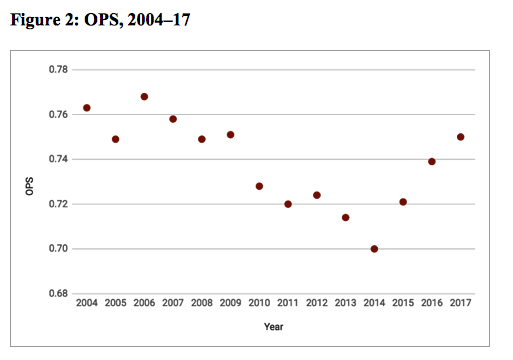
One-sample t-tests (p < 0.0001) indicated a significant difference in OPS in 2014 compared to the 2004–17 sample.
Figure 3: Home Runs, 2004–17
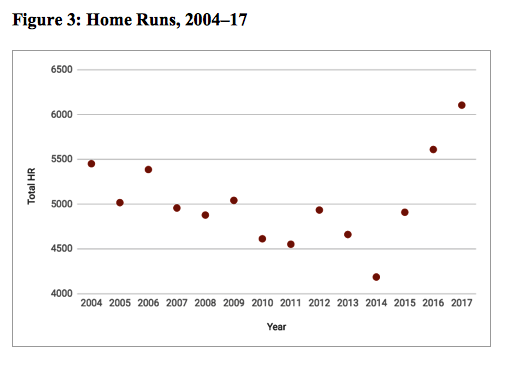
One-sample t-tests (p < 0.0001) indicated a significant difference in HR in 2014 compared to the 2004–17 sample. A time series analysis shows significant difference in the trend of data between 2014 and 2015.
Figure 4: Runs/game, 2004–17
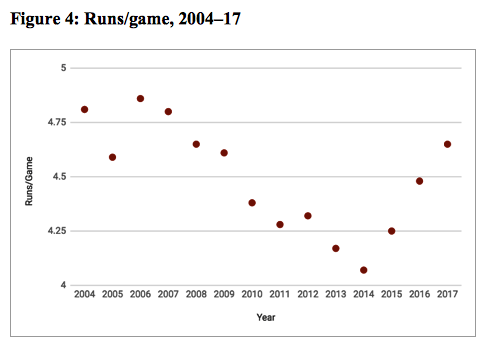
One-sample t-tests (p < 0.0001) indicated a significant difference in runs/game in 2014 compared to the 2004–17 sample.
Figure 5: HR per hits allowed, 2004–17
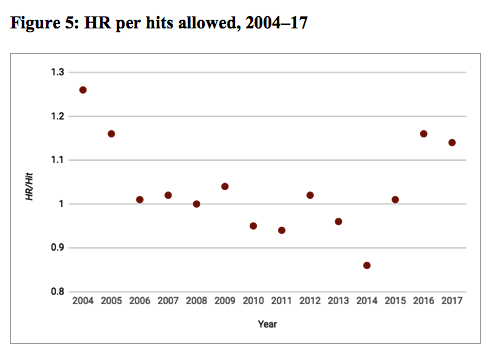
One-sample t-tests (p < 0.0001) indicated a significant difference in HR/hit allowed in 2014 compared to the 2004–17 sample. Moreover, the graph shows the same trend of steady decrease between 2004 and 2014 with a reversal of this trend in 2015.
Figure 6: WHIP, 2004–17
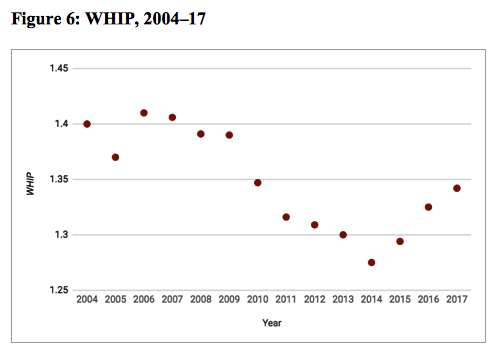
One-sample t-tests (p < 0.0001) indicated a significant difference in WHIP in 2014 compared to the 2004–17 sample.
Figure 7: Bases on balls per game, 2004–17
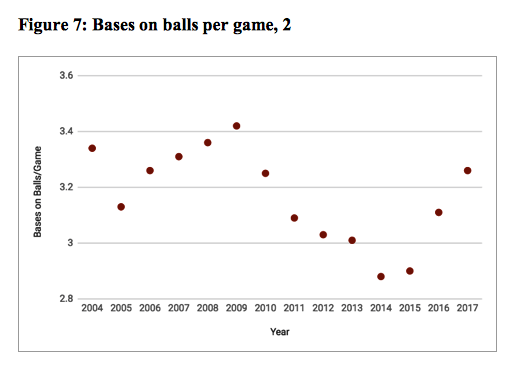
One-sample t-tests (p < 0.0001) indicated a significant difference in BB in 2014 compared to the 2004–17 sample.
There are several factors to be considered that cannot account for either the anomaly of 2014 or the reversal of the trends favoring pitching in 2015.
The only ballpark to change its dimensions in 2015 was Citi Field in New York, which shortened the distance from home plate to the right field fence by 10 feet; while this did result in 38 additional home runs, it represents only 5 percent of the 723-home run increase in 2015 and the additional 701-home run increase in 2016. Admittedly, this change in dimensions was brought about due to analytics that suggested the shift would result in more home runs for the Mets.13 While changing dimensions of ballparks to increase offensive production for the home team may be the next frontier in analytics, it cannot explain the offensive explosion of 2015. Likewise, Marlins Park in Miami was adjusted in the hopes of creating more offense in 2016, bringing in the center-field fence by 11 feet and lowering walls.14 In 2017, the Atlanta Braves moved from Turner Field to the newly opened SunTrust Park, where the fences are 5 feet closer to home plate in left-center, 15 feet closer in right-center, and 5 feet closer in the right-field corner, with the decreased dimensions of right field compensated for by a wall that’s 7½ feet taller.15
Some pundits have suggested that the increasing number of home runs in 2015, ’16, and ’17 can be attributed to hitters catching up to the increasing velocity of pitchers. To examine this theory, home runs as a percentage of pitch type are examined.
Table 1: HR as a percentage of pitch type, 2009–17
|
Fastball HR |
Slider HR |
Changeup HR |
Sinker HR |
Curve Ball HR |
|
|
2009 |
0.7653 |
0.6541 |
0.7571 |
0.6725 |
0.4845 |
|
2010 |
0.6828 |
0.6025 |
0.7132 |
0.6252 |
0.5350 |
|
2011 |
0.6745 |
0.6279 |
0.7089 |
0.6515 |
0.4152 |
|
2012 |
0.7422 |
0.6808 |
0.8068 |
0.6519 |
0.4978 |
|
2013 |
0.7017 |
0.6484 |
0.7273 |
0.5875 |
0.4682 |
|
2014 |
0.6217 |
0.5858 |
0.6736 |
0.5461 |
0.4827 |
|
2015 |
0.7483 |
0.6356 |
0.7391 |
0.6769 |
0.5548 |
|
2016 |
0.8325 |
0.7669 |
0.8583 |
0.7316 |
0.5887 |
|
2017 |
0.8908 |
0.8095 |
0.9129 |
0.8375 |
0.6235 |
In 2015, ’16, and ’17, there are increases in the percentage hit in every pitch type; the increase is not limited to fastballs. One-sample t-tests reveal that 2017 was a statistically significant anomalous year for every pitch type: fastball (p<0.0006), slider (p<0.004), changeup (p<0.0005), sinker (p<.0003), and curveball (p<0.0011).
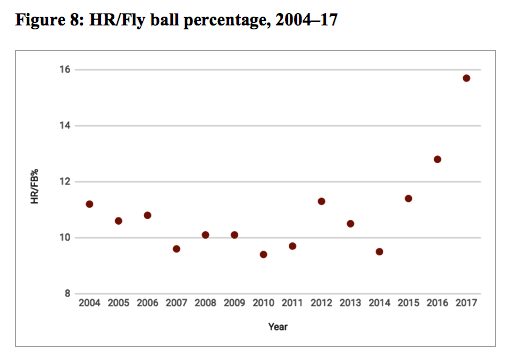
Data regarding the percentage of home runs per fly ball thrown do not mirror the trends seen in the other data. The increase in 2015, ’16, and ’17 suggests that balls are traveling farther (see Figure 8).
Figure 8: HR/Fly ball percentage, 2004–17
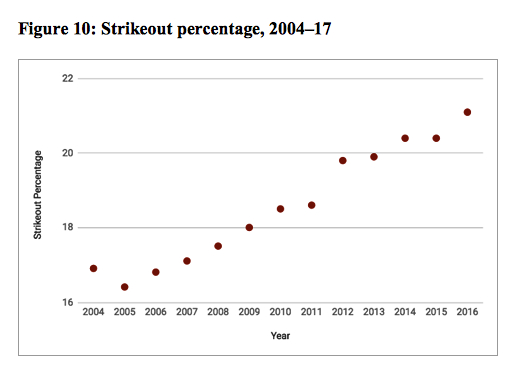
Interestingly, the swinging strike percentage has also been trending upward every year since 2010 (see Figure 9), but the data do not follow the same trend, negating the possibility that batters began offering at more pitches since 2014. Likewise, strikeouts have increased steadily since 2005 (see Figure 10).
Figure 9: Swinging strike percentage, 2004–16
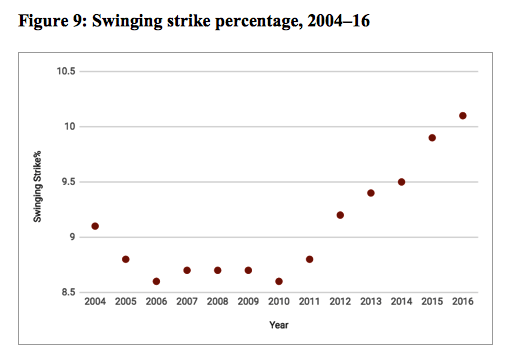
Figure 10: Strikeout percentage, 2004–17
To examine whether the trends seen across all of major-league baseball hold true for the top performing pitchers, AVG, WHIP, ERA, and HR/9 data were collected for the top 20 pitchers of 2014 as determined by WAR values.
Table 2: Top 20 pitchers of 2014 performance, 2014–17
|
AVG |
WHIP |
ERA |
HR/9 |
|
|
2014 |
.229 |
1.09 |
2.77 |
.654 |
|
2015 |
.235 |
1.17 |
3.23 |
.904 |
|
2016 |
.238 |
1.18 |
3.56 |
1.075 |
|
2017 |
.232 |
1.17 |
3.66 |
1.132 |
These data reveal negligible increases in opponent AVG (and WHIP), suggesting consistency in these elite pitchers’ effectiveness based on one-sample t-tests. However, there is a marked increase in ERA (p < 0.0314) and HR/9 (p < 0.0305) within this group of elite pitchers that is likely not due to chance fluctuations from one season to the next.
Similarly, to examine whether the trends seen across all of major-league baseball hold true for the top performing hitters, AVG, OBA, OPS, HR, and strikeout (SO) data were collected for the top 40 hitters of 2014 as determined by WAR values.
Table 3: Top 40 hitters of 2014–17
|
AVG |
OBA |
OPS |
HR |
SO |
|
|
2014 |
.291 |
.362 |
.833 |
20.10 |
106.38 |
|
2015 |
.275 |
.344 |
.797 |
18.45 |
93.38 |
|
2016 |
.270 |
.344 |
.792 |
20.63 |
104.35 |
|
2017 |
.267 |
.349 |
.792 |
19.45 |
90.58 |
Data from the hitters do not show the same trends as the data from the pitchers. In fact, they show slight decreases, which may well be due to chance, based on one-sample t-tests.
Discussion
The data show a clear trend of increasing pitcher dominance between 2004 and 2014. This trend is abruptly reversed in 2015, most remarkably in the category of home runs.
Certain explanations can be dismissed based on the data available. The changing dimensions of the two ballparks, Citi Field and Marlins Park, and the Braves’ move from Turner Field to SunTrust Park are not sufficient to explain the offensive increases of the past three seasons. This leads us to look to the plausible explanations based on previous increases in offense. Historically, home runs have increased for three reasons: rule change, use of steroids, and changes in the baseball itself.
There have been no rule changes in 2015–17 that would increase offense. The rule changes pertained to pace of play.
Major League Baseball only releases results results of failed steroid tests. Details of which players are tested and what the test specifically screens for are not released. Given the sudden improvement in hitting performance, performance enhancing substances as an explanation cannot be dismissed out of hand. Fewer players have been suspended for failed testing in 2015–17 than were suspended in 2012–14.16 However, insufficient data are available to make any claims beyond commenting that this is a possible explanation for the significant increase in offense.
Measures of plate discipline—bases on balls, swinging strikes percentage, and strikeouts—do not suggest that there has been an increase in batters’ skills in this area. In fact, swinging strike outs have been increasing steadily since 2010, suggesting that batters may be attempting an all-or-nothing approach; while this may be their intention, it seems to be a strategy that has been in place since 2010, a full five years before the reversal of trends in runs. If a strategy of swinging for the fences could account for the dramatic increase in home runs, one would expect to see runs increasing concurrently, rather than starting to pay dividends six years down the road. Given that plate discipline appears to be decreasing, the bases on balls coupled with increasing home runs and earned runs suggests that pitcher control is decreasing or that umpires may be calling the strike zone differently. Such a statistically significant shift in pitcher control is likely not due to an overall decrease in pitching skill but may be due to an overall more cautious approach by pitchers—though if this is case, this approach is not successful at mitigating home runs. Home runs are up on every pitch type, so increased velocity is not a likely explanation.
The performance of the top 20 pitchers of 2014 is illuminating as to the changes that have occurred. Their opponent average and WHIP have remained steady, but there was been a statistically significant increase in their ERA and HR/9. They remain equally effective at keeping the ball out of play; the only difference is that the balls are flying out of the park. That is, they are traveling a greater distance. The Washington State University study that suggested that the new baseballs, on average, traveled an additional 7.1 feet could explain this phenomenon. Additionally, the top 40 hitters of 2014 actually show a non-significant decrease in performance between 2014 and 2017. This could be due to a decline in the performance of the top 40 hitters of 2014 as they aged, but given the consistency in the data from the top pitchers of 2014 over the following three seasons, it is the most valid comparison to measure against the ongoing performance of the same individual batters. This is particularly true given that the performance of pitchers over the course of time declines more precipitously than that of batters due to the wear and tear on pitchers’ arms.
Given the shift in the numbers, it is not possible to ignore what the players, particularly the pitchers, are saying. Verlander, a Cy Young Award-winner, said, “So on one hand you can have somebody say, that manufactures the ball, they’re not different. And on the other hand you can say that the people that have held a ball in their hand their entire life, saying it’s different. You value one over the other. You take your pick.”17 While Rawlings did insist that it continues to manufacture the balls within the specified parameters, this does not preclude a shift in the average. That is to say it is possible for a ball to still fall within the acceptable parameters, but closer to one end of the spectrum such that it will travel farther. Indeed, the May 2018 report noted “a decrease in the ball’s drag properties, which cause it to carry further than previously, given the same set of initial conditions—exit velocity, launch and spray angle, and spin.”18 These properties undeniably have an effect on home run production.
Conclusion
Having examined multiple possible explanations, we can conclude that the historical record offers the best potential explanations for what is clearly an offensive surge, with the increase in home runs being most notable. It is no secret that the commissioner of baseball has made increased offense a goal. The data support the proposition that offense has increased in ways not due to changes in rules or dimensions. This leaves the explanations of steroid usage or a change in the composition of the baseballs.
Ultimately, Major League Baseball can choose to make changes to promote offense in order to make the sport more marketable and appeal to a larger audience. In the past, these changes have been made with transparency. It is not necessarily wrong to alter the baseball to promote offense, but if such a change has occurred, there are significant implications for teams. Had teams been informed in advance of the changes in the ball, it could have affected choices they made in payroll allocations for pitching versus position players, draft strategies, and trade decisions. While all teams arguably were equally disadvantaged by this lack of information, it is undeniable that some teams do invest more in their pitching and thus will be more affected by the change, at least in the short term. The decision to make a change to the baseballs without transparency also alters the dynamic between Major League Baseball and the franchises and players, as it is now clear that there was an imbalance of information for teams and individuals hoping to compete.
To remain competitive moving forward, major-league franchises will need to change their approach in building a team. The balance of investment in hitting and pitching may shift. Alternately, teams built around pitching could consider alterations to their ballpark dimensions in order to offset the additional distance batted balls travel. Other changes that may affect the way a ballpark plays may also be considered. While opening or closing a roof is ostensibly a weather-based decision, it also alters how the ball carries in the park. Perhaps, if not forbidden by the rules, teams could consider putting in walls with adjustable height that could be set before the game based on the particular data of the pitchers scheduled to start—a shift of the park itself rather than the defense. Pitchers can continue to reject balls that feel as though they are wound more tightly by tossing them back. Teams may implement a humidor in their home park, though whether this would mitigate the changed aerodynamic properties of a baseball would remain to be seen.
Within games, the reality that the ball travels farther can change the way managers approach situations. Teams may want to try to hit the ball in the air. For example, rather than simply allowing the ball to be put in play, pitching for a ground ball may be a sound strategy. Defensive shifts, in addition to responding to a hitter’s tendencies, may also be able to compensate and adjust for additional distance. The future success of teams may be affected by how they are either able to exploit or compensate for the change in the baseballs.
LAURA SCHRECK is an administrator at a high school in the San Francisco Bay Area. A graduate of UC Berkeley with a degree in Rhetoric, she went on to receive Master’s degrees in Education and Sport Management from Loyola Marymount University and University of San Francisco, respectively. She interned with the World Champion San Francisco Giants during the 2012 season.
ERIC SICKLES is a graduate student studying Sport Management at the University of San Francisco. He completed his B.A. in History in 2016 at Purdue University Northwest where he played collegiate baseball. He currently works for the San Francisco Giants as the Special Events Intern.
Notes
1 David Waldstein, “Rob Manfred puts his stamp on the game and an era,” New York Times, April 7, 2015. https://www.nytimes.com/2015/04/08/sports/baseball/a-signature-moment-as-a-new-baseball-season-begins.html.
2 Kevin Kernan, “Justin Verlander dumps fuel on Ball-gate: Can feel the difference,” New York Post, October 29, 2017. https://nypost.com/2017/10/29/justin-verlander-dumps-fuel-on-ball-gate-can-feel-the-difference/.
3 Jim Albert et al., “Report of the Committee Studying Home Run Rates in Major League Baseball,” Office of the Commissioner of Baseball, May 24, 2018. http://www.mlb.com/documents/7/9/4/278128794/Full_Report_of_the_Committee_Studying_Home_Run_Rates_in_Major_League_Baseball_052418.pdf.
4 Christopher D. Green, “Baseball’s first power surge: Home runs in the late 19th-century major leagues,” SABR Baseball Research Journal, Fall 2011. http://sabr.org/research/baseball-s-first-power-surge-home-runs-late-19th-century-major-leagues.
5 David Vincent, Home Run: The Definitive History of Baseballs Ultimate Weapon (Washington: Potomac Books, 2008), 35.
6 Vincent, 38.
7 Herman Weiskopf, “The Infamous Spitter,” Sports Illustrated, July 30, 1967. https://www.si.com/vault/1967/07/31/609382/the-infamous-spitter.
8 Vincent, Home Run, 42.
9 Major League Baseball, “MLBPA, MLB announce pace-of-game initiatives, game modifications,” Press release, February 20, 2015. http://mlb.mlb.com/pa/releases/releases.jsp?content=022015.
10 Larry Granillo, “Living through the rabbit ball in 1987,” Sport Business Nation, June 13, 2012. https://www.sbnation.com/2013/6/13/4426478/japan-juiced-baseball-power-mlb-1987-rabbit-ball.
11 Ben Lindbergh, “The Juiced Ball Is Back,” The Ringer, June 14, 2017, https://www.theringer.com/2017/6/14/16044264/2017-mlb-home-run-spike-juiced-ball-testing-reveal-155cd21108bc.
12 Lindbergh.
13 Tim Rohan, “Mets Bring in Fences, Again,” New York Times, November 18, 2014. https://www.nytimes.com/2014/11/19/sports/baseball/mets-fences-citi-field.html.
14 Joe Frisaro, “Marlins will lower and move in fences in 2016,” MLB.com, October 7, 2015. https://www.mlb.com/news/c-153568328.
15 Alan Carpenter, “Atlanta Braves Reveal SunTrust Park Dimensions, New Wall,” Tomahawk Take, March 10, 2016. https://tomahawktake.com/2016/03/10/atlanta-braves-reveal-suntrust-park-dimensions-new-wall/.
16 Tom Verducci, “The numbers—and the truth—about baseball’s PED problem and why it may never go away,” Sports Illustrated, May 16, 2017. https://www.si.com/mlb/2017/05/16/ped-suspensions-home-run-rate.
17 Kernan, “Justin Verlander dumps fuel.”
18 Jim Albert et al., “Executive Summary of the Report of the Committee Studying Home Run Rates in Major League Baseball,” Office of the Commissioner of Baseball, May 24, 2018. http://www.mlb.com/documents/2/3/4/278129234/Executive_Summary_of_HR_Committee_Report_by_Dr_Leonard_Mlodinow_052418.pdf