

Optimizing Outfield Positioning: Creating an Area-Based Alignment Using Outfielder Ability and Hitter Tendencies
This article was written by Anthony Montes
This article was published in Spring 2021 Baseball Research Journal
Columbia University’s Society for Baseball Research group includes the following contributors: Anthony Montes, Anthony Argenziano, Brian O’Sullivan, Charles Orlinsky, Drew Posner, Matthew Chagares, Anna Flieder, Bennett Bookstein, Jack Chernow, and Teddy Brodsky.
The shift has been a part of baseball for as long as the sport has existed. From a crisp “give me two steps back” when the cleanup hitter steps up, to analytically placing defenders in the ideal spots, defensive configurations have drastically changed over the years. As baseball has evolved toward the creative, data-driven game seen today, managers have attempted to leverage advanced batting statistics to position players to give their teams the best chances of getting outs. Defensive statistics that account for a specific fielder’s tendencies have fallen behind these complex hitting statistics. Shouldn’t a team consider the individual abilities of their outfielders—eg. UZR (Ultimate Zone Rating), Sprint Speed, etc.—as well as those of opposing hitters in determining how defensive alignment looks?
Although teams have had success positioning infielders to minimize the hit probability of the opponent, hitters have also continued to adapt against these tactics. There will soon be a pressing need for defenses to advance said tactics. It is incumbent upon the next generation of managers and GMs—those who have grown into a game that has welcomed the use of advanced analytics—to continue to push the game forward defensively. The next frontier for defensive metrics appears to involve teams positioning their outfielders based on personnel.
Such placement will surely have great ramifications for many decisions. Maximizing defensive value may be dependent on moving players to all parts of the field, which could result in a complete overhaul of the player development process. Organizations may be incentivized to change players’ positions, alter training programs, overhaul their draft, free agent, and scouting strategy, and ask players to contribute in unorthodox ways. In extreme cases players may begin to find that their value is maximized at a position that they’ve never played. Optimization of outfield positioning will also help teams evaluate defensive production and compensate players more accurately, properly weighing important skills against others.
Offense is more of a priority in the valuation of players on the open market than defense (fielding, exclusive of pitching). Teams have created a variety of ways to evaluate players based on their offensive contributions, using statistics such as wRC+. In 2017, FiveThirtyEight’s Rob Arthur examined the relative price teams paid in free agency for offensive and defensive contributions. Arthur’s findings suggest that teams attribute only 28% of a player’s total value to his fielding—teams paid an average of $84,000 per defensive run compared to $215,000 per offensive run.1 By finding a more efficient way to place outfielders to counter offensive production and maximize the abilities of defenders, teams could more accurately evaluate defense and reduce the premium placed on offense. The below study stands on the shoulders of excellent work contributed by the baseball analyst community over the last decade-plus.
In his presentation to the 2019 SABR Analytics Conference, Brian Reiff developed a formal definition for outfield shifts as any configuration where three outfielders stand at least 110 combined feet from their average reference points.2 In that same year, Mark Simon, in a piece for Bill James Online, documented an 89% increase in outfield shifts in 2018 compared to just two years prior, underscoring the need for further investigation of novel outfield alignment strategies.3
Recent baseball analyses have also made tangible strides towards exploring and measuring the impacts of uniquely devised outfield alignments on team defense. In his 2013 Baseball Prospectus article, Russell Carleton considered the marginal effects of outfield performance if teams were to swap their corner outfielders with one another, determining that teams would save a handful of runs per season by placing the better of the two at each hitter’s opposite field.4 Reiff, in his same 2019 SABR presentation, expanded upon Carleton’s work by using batted ball tendencies of hitters via Statcast data, rather than handedness alone, to analyze recent cases in outfielder realignments (such as those deployed against Joe Mauer). Finally, Carleton’s 2017 analysis, also available on Baseball Prospectus, measured the degree to which outfielders overlap while chasing fly balls, determining that the greatest overlap generally occurs between two outfielders of disparate defensive abilities.5
Ultimately, fielding defense in baseball will look dramatically different in twenty years, perhaps even in five years. So how can teams do better, both before the game when constructing the team, and during the game when placing defenders on the field?
In an attempt to best answer these overarching questions, a major component of the study involved the development of a data tool, the Outfield Player Positioning Optimizer (OPPO). Constructed via a series of functions in R, OPPO takes as its inputs data on three outfielders and one hitter. Each outfielder is distinguished by his “Jump,” extracted from Baseball Savant’s Outfielder Jump leaderboard. More specifically OPPO uses “feet covered,” the distance traveled by a given outfielder in the correct direction within three seconds of contact, as a proxy of his reaction, burst, and route efficiency.6 Upon input, each outfielder is represented by a circle, with a movable center, and a radius equal to his feet-covered metric. Each hitter, on the other hand, is represented by his 2019 spray chart of balls hit to the outfield (using Baseball Savant’s Statcast Search tool), in the form of coordinates superimposed onto the image of a generic baseball diamond.7
Using iterative looping techniques in the programming language, the model acts to maximize the number of balls in a particular hitter’s spray chart that an outfield-represented by a set of three circles—covers. The model places the fastest outfielder among the three—denoted by the largest feet covered metric— onto the field first, maximizing the amount of balls that circle can cover alone. It then follows by placing the second fastest outfielder to maximize the previously unreached balls, and the same for the third. In practice, OPPO loosens the restrictions on where outfielders play relative to one another, while also challenging the conventional positioning of outfielders denoted on the lineup card as left, center, and right field.
Once performing this iterative maximization task, the model provides two main outputs—one numerical and one visual. Numerically, it provides the total balls covered by the set of three outfielders, which is then converted to a percentage of balls reached. Furthermore, it provides a graphical representation of the coordinates at which outfielders have been placed: the fastest outfielder is represented by a red circle, the intermediate by a black one, and the slowest in blue. Each is also overlaid onto the spray chart of the hitter in question. These two main categories of output allow us to compare quantitatively the difference in outfields’ performances with different sets of fielders against original positioning practices. The model also provides visual evidence as to how outfields ought to be spaced against different types of hitters when different outfielders are playing.
Placing outfielders using OPPO will produce results different from conventional placement. It is hypothesized that the fastest outfielder for each team will not be placed in his typical position (often center field), but instead at the location where the density of batted balls is greatest for a particular hitter. Furthermore, it is predicted that players with opposite-field power profiles will yield the greatest changes in defensive positioning compared to balanced hitters and pull hitters, because teams already repositioned more often against pull hitters than others.
It is hypothesized OPPO will impact the performance of individual outfielders. The area of a circle, as seen in its mechanics, involves a squared term: Area = π x r2. Replacing “r” in this formula with feet covered results in a circle that represents the total theoretically reachable space of an outfielder in three seconds in all directions.
Noting this simple yet crucial principle, it is now easy to see that a one-unit increase in feet covered has more than a one-square-foot effect in total area covered. For example, George Springer achieved an average of 34.0 feet covered after three seconds in 2019, and Starling Marte’s measure was 35.0 feet.8 Assuming uniform movements in all directions, as this study does, each player covers 3632 and 3848 square feet, respectively—a difference of 216 square feet. This is a non-trivial sum, the size of a large bedroom’s worth of additional coverage by Marte. Therefore, it is predicted there will be an increasingly large positive effect of outfielders with marginally better feet covered, and increasingly large negative effects of those with marginally worse measures.
METHODS
For each experiment, the following assumptions have been made given the constraints and limitations of the study:
- Circles are created by maximizing first touch—that is, the players are placed to get to each ball faster, which helps to both reduce the total bases and increase total outs.
- OPPO does not discriminate based on outfield position—the model places players based on speed. This assumes a fielder’s ability remains constant across each outfield position.9
- Spray chart data are from Baseball Savant, and coordinate points are collected by stringers. Coordinates represent the point at which the ball is touched by an outfielder.
- Circles are used with constant time of travel for each outfielder of three seconds from when the hitter makes contact. While Russell Carleton of Baseball Prospectus has shown that the average flyball remains in the air for 4.56 seconds, it was determined to be sufficient to use three seconds, as this duration is likely lower when accounting for hard-hit line drives and ground balls. Furthermore, 77 percent of balls in Carleton’s aforementioned 2017 analysis were caught by outfielders, a stark deviation from the data used in this study, which records all balls to the outfield regardless of put-out status. Both tests ignore the reality that outfielders move at different rates and abilities in certain directions.
- The stadium space, which was constructed by Bill Petti, is arbitrary in size and shape, and not representative of any particular stadium.10 The OPPO model does not account for park factors nor variance in outfield areas across different stadiums.
- Home runs are excluded from the data set as they are not categorized as balls-in-play.
- Spray charts of hitters, the basis by which outfielders are positioned, are inherently retrospective and cannot be assumed to accurately predict a hitter’s future spray chart.
- All experiments assume that the outfielder has a “first-mover advantage”—hitters do not adjust, in this analysis, to the changes in outfield configuration.
- Each event is treated as having occurred under equal conditions, rather than under specific ingame contexts including but not limited to inning, pitcher, pitch type, outs, injury, wind, and runners on base.
- Hitters inputted as test subjects serve as representatives of different hitter archetypes (e.g. dead-pull lefty, all-fields righty). While no one hitter is representative of these groups, assigning representatives according to strict categorization criteria proved most feasible given the computational demands of each test.
- For the purpose of these studies, arm accuracy and strength are disregarded. This does not reflect the importance of this particular skill in determining the quality of an outfielder’s fielding.
- The model disregards the effect of hitters compensating against defensive positioning by bunting, hitting to the opposite field, or otherwise trying to nullify the effects of strategic defensive positioning.
The order of this list does not reflect the relative importance of each assumption. The dataset includes all batted ball data from the 2019 regular season. Batted Ball data and Outfield Jump data were collected from Baseball Savant (specifically, using the Statcast Search tool to download custom datasets),11 and summary data used to categorize hitters were compiled from FanGraphs.12
The following eighteen hitters were selected for both experiments: Adam Eaton, Freddie Freeman, Rafael Devers, Jeff McNeil, Max Kepler, Cody Bellinger, Alex Gordon, Michael Brantley, Juan Soto, Whit Merrifield, Tim Anderson, Miguel Cabrera, Paul DeJong, Eugenio Suarez, Pete Alonso, Starling Marte, Dansby Swanson, and Anthony Rendon. These hitters were selected to represent a right-handed and a left-handed hitter from each subgroup based on exit velocity and spray. Exit velocity is broken into the bottom third, middle third, and top third of the league in 2019. Spray is broken into heavy opposite field hitters, dead pull hitters, and average spray hitters which served as the control group. Those categorized in the opposite field group were amongst league leaders in Oppo% (a FanGraphs metric) in 2019, and hit at least 28% of total balls in-play to left, center, and right field. The criterion for dead pull hitters is that they pull the ball at least two times more frequently than they go to the opposite field. Average hitters, while still leaning slightly pull-heavy, fit into neither of the above categories as they use the middle of the field and the opposite field at an intermediate rate. Hitters selected and sub-groupings are represented in Table 1.
Table 1. Hitters selected sorted by exit velocity, tendency, and handedness
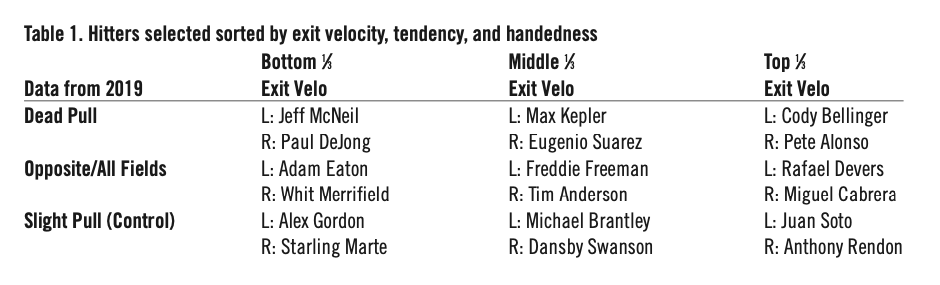
(Click image to enlarge)
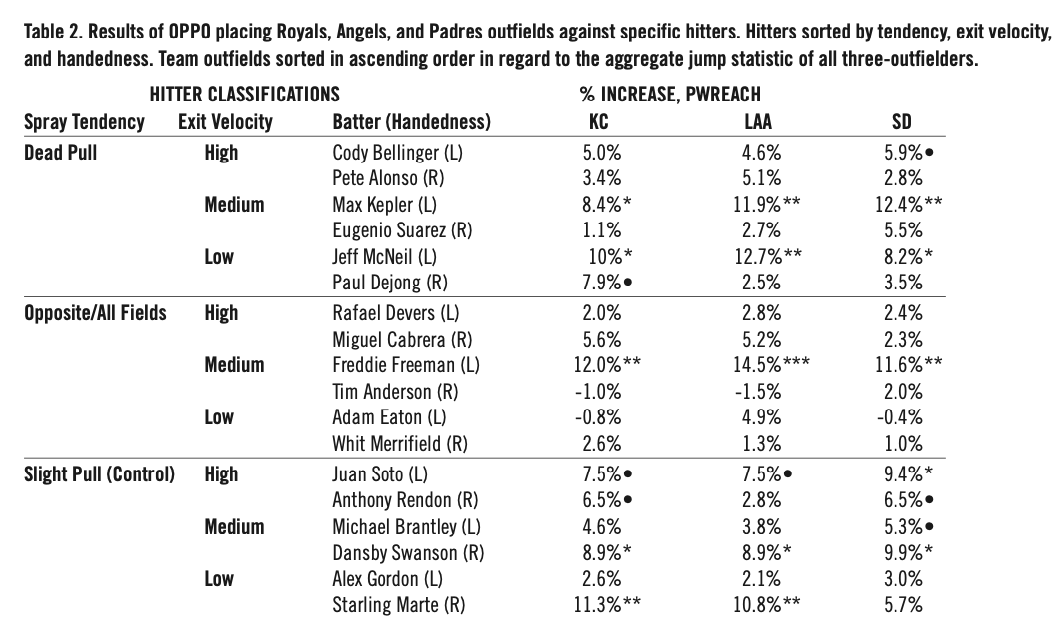
In order to test the effect of OPPO against straight-up outfield configuration, experiment one tested eighteen hitters against the worst, average, and best outfields based on their aggregate average feet covered. The Royals outfield of Whit Merrifield, Jorge Soler, and Alex Gordon was the worst. The Angels outfield was average, consisting of Mike Trout, Brian Goodwin, and Kole Calhoun. The best were Manuel Margot, Wil Myers, and Hunter Renfroe of the Padres.
Test one determined the difference in number of plays within reach for each individual hitter against an outfield playing with conventional positioning and an outfield aligned using OPPO. These two values were then compared. Results—represented in Table 2—were recorded as a percent difference of plays covered between the conventional outfield and OPPO-modified outfield for each hitter and team outfield, respectively.
In order to test the marginal effects of OPPO on individual performance, test two determined a baseline percentage of plays covered by inputting three clones of the Major League average outfielder—Ketel Marte— in terms of feet covered into OPPO against all eighteen hitters represented in Table 1. Then, one average outfielder—Marte again—was substituted for outfielders with the 100th, 75th, 25th, and 0th percentile feet covered from 2019—Kevin Kiermaier, Jason Heyward, Alex Gordon, and Melky Cabrera respectively—against all eighteen hitters. Data were recorded as the percent change in balls covered between the control group and each experimental group in order to measure the impact of a substitution of outfielders with different ranges.
Table 2. Results of OPPO placing Royals, Angels, and Padres outfields against specific hitters. Hitters sorted by tendency, exit velocity, and handedness. Team outfields sorted in ascending order in regard to the aggregate jump statistic of all three-outfielders.
(Click image to enlarge)
RESULTS Experiment One
Table 2 contains values for the percentage point improvement in balls reached for each of three 2019 sample outfields—Royals, Angels, and Padres—against eighteen different hitters. In the chart, the hitters are classified first by their 2019 spray profile (extreme pull hitters, opposite field hitters, and slight pull types—the control group). Within those groups, hitters are then sorted by their 2019 exit velocities, where High denotes the 67th percentile and above, Medium the 34th to 66th percentile, and Low the 33rd percentile and below.
To achieve the percentage-point improvement made by OPPO compared to traditional outfield placement, the difference in proportion of balls reached by each of these outfields was found by subtracting the proportion of balls reached of the conventional outfield from the proportion of balls reached using OPPO to align outfielders. Results are reflected in Table 2.
After computing these observed differences, significance tests were conducted to determine whether or not there was substantial improvement made by OPPO. In each, the null hypothesis was that OPPO would provide no significant increase in proportion of balls within reach, compared to the control configuration. The alternative hypothesis, however, was that OPPO significantly increased the proportion of balls reached. Following a one-sided difference in proportions test for each of the 54 computed differences, it was determined that 20 different hitter and outfield combinations—37% of cases—saw significant improvement using OPPO at the 90% confidence level or greater. Furthermore, 15 of these 20 saw significant improvement at the 95% confidence level or better. Significance is denoted in Table 2 using the following key: • (90%), * (95%), **(99%), and *** (99.9%).
The results above describe the extent to which outfields of varying abilities can improve the number of balls within reach, and how those potential improvements grow or diminish depending on the type or handedness of the hitter at bat. Most notably, the data show that if one team can significantly neutralize a particular hitter, then it is likely that the other teams can also. As seen in Table 2, 15 (75%) of the statistically significant improvements are against five particular hitters—Dansby Swanson, Juan Soto, Freddie Freeman, Jeff McNeil, and Max Kepler. This means that, for each of these hitters, all three tested outfields saw statistically significant positive gains from repositioning using OPPO.
While there are not many patterns to indicate this custom alignment has varying degrees of effectiveness across different hitter classifications, the strongest example to the contrary is the relatively different impact OPPO has on pull and opposite field hitters. The opposite-field group, located in the middle of Table 2, is almost uniformly unaffected by the use of OPPO. Other than Freddie Freeman, whom outfielders cover significantly more balls against with the use of OPPO and who will be discussed further later, no significant improvements were made in the opposite-field group. In fact, OPPO yielded its only two negative effects against members of this group—Adam Eaton and Tim Anderson— albeit statistically insignificant. Via the results, it can be concluded that the opposite-field group is more difficult to successfully reposition against than the control and dead-pull groups. This does not support the original hypothesis, which asserted that pull hitters, due to already increased levels of reshuffling of opposing outfielders, would yield a lower percentage point increase than opposite-field hitters after implementing OPPO.
Using the results presented in Table 2, specific figures were extracted from OPPO’s output to provide visual evidence for the varying degrees of OPPO’s effects against hitters of different types and across outfields of varying range ability. In examining the differences between the Angels’ and Padres’ suggested positioning against Mets All-Star Jeff McNeil—which provided 12.7% and 8.2% improvement, respectively—the data showed that the OPPO suggested configurations end up looking similar to one another. Figure 1 and Figure 2 show the relative similarity of OPPO-modified alignment against McNeil for both the Angels and Padres.
As can be easily seen, there is an interesting deviation from the norm brought forth by OPPO’s suggested alignment. Manuel Margot and Brian Goodwin, both team leaders in feet covered (and thus the largest circles), are situated in right field against the dead-pull oriented McNeil. Neither Margot nor Goodwin typically plays right field—they usually play center and left, respectively. This observation, coupled with the incredibly large magnitude of improvement, shows that teams would be best served placing their outfielder with the best jump in right field against left-handed pull hitters like McNeil.
Furthermore, the fact that OPPO, while improving the reach of both outfields by a significant percentage, has improved the Angels more than the Padres, shows that OPPO appears to help the median outfield relatively more than it does the fastest outfield against McNeil. This conclusion is further supported by just how equal these two outfield configurations look, proving that the circles of the Padres were reaching relatively more balls than the Angels.
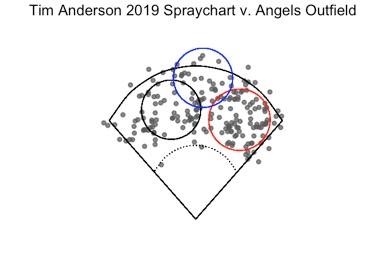
The examination across team outfields against McNeil shows the prowess of the OPPO model in improving the range against a hitter regardless of the speed of the outfielders. There are instances in which OPPO produces decidedly disparate levels of improvement across players of very similar profiles. The differences in spray between Anderson and Freeman raise the problem that OPPO is extremely successful against Freeman (12%, 14.5%, 11.6%), but almost categorically worse against Anderson (-1%, -1.5%, 2%).
Using the Angels outfield as constant, it appears that each of the three circles is located in different locations against both hitters. Most notably, the fastest player is again placed in a corner—not surprisingly in left field against Freeman, as he is categorized as an opposite field hitter.
Regarding the differences in efficacy, it is puzzling at first. However, a better look at the spray charts shows a potential justification for this difference. Figure 3— Freeman—shows a higher concentration of balls hit in what would traditionally be considered in the “gaps,” while Anderson does not have a high concentration of his balls in any particular portion of the field. It thus stands to reason that, for Anderson, the placement of outfielders in a tight bunch in right field is the most beneficial positioning that OPPO can provide, as the result will likely be slightly better than playing in conventional positions. Therefore, OPPO’s ability to move circles into gaps without regard for these traditional configurations does better to neutralize Freeman, who can no longer utilize the deep gaps to hit balls out of the reach of outfielders. Furthermore, while Freeman qualifies for the opposite-field group—based on criteria noted in Methods—he has a stronger pull tendency than all other members of his group. This further validates OPPO’s relative strength against pull profiles versus opposite-field profiles.
Figure 1. Jeff McNeil 2019 batted-ball data (n = 220) are plotted against the Los Angeles Angels outfield repositioned by OPPO. Outfielders depicted: Brian Goodwin (red circle), Kole Calhoun (dashed circle), Mike Trout (blue circle).
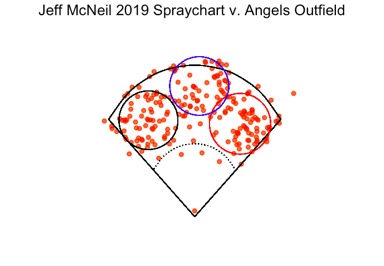
Figure 2. Jeff McNeil 2019 batted-ball data (n = 220) are plotted against the San Diego Padres outfield repositioned by OPPO. Outfielders depicted: Manuel Margot (red circle), Hunter Renfroe (black circle), Wil Myers (blue circle).
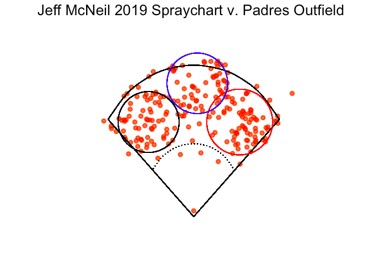
Figure 3. Freddie Freeman 2019 batted-ball data (n = 242) are plotted against the Los Angeles Angels outfield repositioned by OPPO. Outfielders depicted: Brian Goodwin (red circle), Kole Calhoun (black circle), Mike Trout (blue circle).
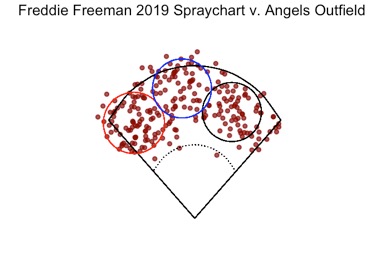
Figure 4. Tim Anderson 2019 batted-ball data (n = 201) are plotted against the Los Angeles Angels outfield repositioned by OPPO. Outfielders depicted: Brian Goodwin (red circle), Kole Calhoun (black circle), Mike Trout (blue circle).
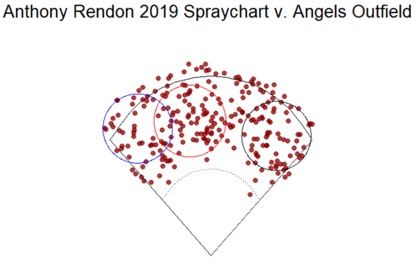
In some cases there were significant disparities among hitters with seemingly similar profiles in the extreme spray groups. The control spray group proved no different, in that players who lean slightly pull but hit more to the opposite field than dead-pull hitters, also yielded a disparity in balls covered after the use of OPPO. Unlike the two experimental groups, the control group found little disparity in the placement of outfielders between two similar hitters by tendency— Starling Marte and Anthony Rendon.
Again holding the Angels outfield constant, outfielders appear to be placed fairly similar to conventional outfield alignment, with the exception of the positions at which each outfielder plays. Notably, the fastest outfielder, Brian Goodwin, is in right field, Kole Calhoun is in center field, and Mike Trout is in left field against Marte—contrary to expectation. Most strikingly, the left fielder for Marte is playing closer to the foul line than a conventional left fielder would play. Rendon was expected to have a similar alignment and increase in percentage of balls within reach due to the similarity in tendency. But outfielders are placed in different portions of the field for Rendon in comparison to Marte. Goodwin, the fastest player, is placed in center field. Calhoun is placed in right field and Trout is placed in left. Most notably, both Trout and Calhoun are placed deep into the corner of the outfield.
As expected, OPPO generated similar placement for the Angels outfield for both Marte and Rendon. But OPPO produced a ten-percentage point increase in balls within reach for Marte and only a two-percentage point increase in balls within reach for Rendon. Similar to the experimental groups, in the control group there was significant variation between players despite similarity in tendencies. The discrepancy in percentage point increase in balls within reach can be explained by the disparity in exit velocity and significant clusters of plays evenly distributed throughout the outfield for Marte and lack of such clusters for Rendon.
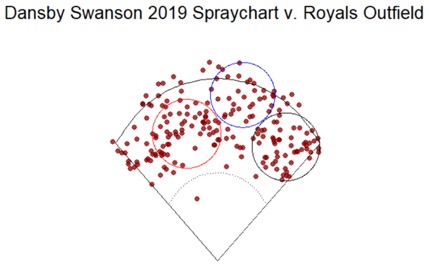
Finally, from an exclusively visual standpoint, no OPPO realignment looks more unusual than that of the Royals against Dansby Swanson. Swanson, a very average player in terms of his pull tendency and exit velocity, is placed in the control group. Against the Royals outfield, OPPO yields an 8.9% increase, which is statistically significant at 95% confidence. This alignment is visually represented in Figure 7.
Ultimately, what this panoply of visuals communicates is that the effect of OPPO, while showing some similar effects against hitters of similar profiles, is unique to the player. While this may seem like a shortcoming of the model, it is in fact a strength. In reality, OPPO can be deployed against each opposing hitter—as in the experiment—and will provide a unique solution for where exactly teams ought to place outfielders. For example, a hitter’s incremental increase in power compared to another may not require linear movements in the same previously conceived directions, but instead a unique approach catered to the density of one’s batted balls across the surface of the outfield.
Figure 5. Starling Marte 2019 batted data (n = 194) are plotted against the Los Angeles Angels outfield repositioned by OPPO. Outfielders depicted: Brian Goodwin (red circle), Kole Calhoun (black circle), Mike Trout (blue circle).
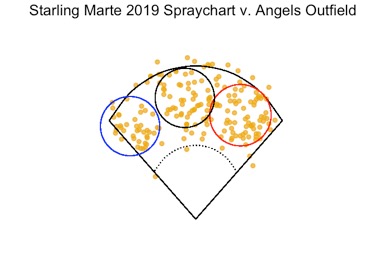
Figure 6. Anthony Rendon 2019 batted-ball data (n = 247) are plotted against the Los Angeles Angels outfield repositioned by OPPO. Outfielders depicted: Brian Goodwin (red circle), Kole Calhoun (black circle), Mike Trout (blue circle).
EXPERIMENT TWO
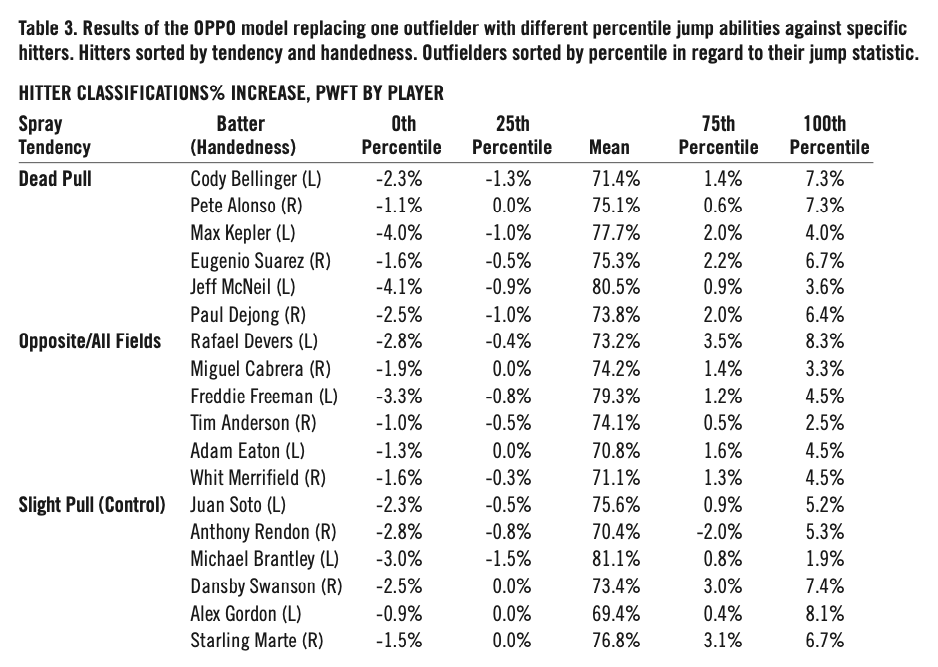
To determine the impact on balls reached by replacing an average outfielder with a marginally improved outfielder within OPPO, the 0th, 25th, 75th, and 100th percentile outfielders were each inserted into OPPO along with two league-average outfielders based on jump—for which this experiment was represented by clones of Ketel Marte (33.1 feet covered). It is worth noting that Marte represents the mean jump based on feet covered amongst qualified outfielders; the mean was used because it was extremely close to the median. The 0th percentile had the greatest percent decrease in plays within first touch in relation to replacement level, and 100th had the greatest percent increase of the same. Distribution of percent of plays within reach varies based on the player, and shows similar distribution by spray tendency. Table 3 (next page) represents the mean percentage of plays within reach and percent increase yielded by the replacement of one outfielder with the 0th, 25th, 75th, 100th percentile outfielders—Cabrera, Gordon, Heyward, and Kiermaier, respectively—for all eighteen hitters outlined in Table 1.
Results vary across the three spray tendencies of hitters in regard to the spread of percent increases between the 100th and 0th percentiles. Outfields against dead pull hitters have an average spread of 8.5% which is fairly similar to the average 7.9% against slight pull hitters. Outfields against opposite or all-fields hitters have a smaller average spread of 6.6%. Therefore OPPO may have similar effects against all spray tendencies on the individual player level.
Figure 7. Dansby Swanson 2019 batted-ball data (n = 203) are plotted against the Kansas City Royals outfield repositioned by OPPO. Outfielders depicted: Alex Gordon (red circle), Whit Merrifield (black circle), Jorge Soler (blue circle).
In most cases, the value of adding the 75th percentile outweighs the percent decrease that is produced by adding the 25th percentile player to the outfield. The same observation can be seen with adding the 100th percentile and 0th percentile players to the outfield. Thus, it can be inferred that OPPO, consistent with the hypothesis, greatly optimizes the abilities of players whose jump statistic lies over the mean while minimizing the damage done to an outfield by adding players whose jump statistic lies below the mean.
It should be noted that there is a case in which including the 75th percentile player produces a negative improvement. This is a result of the way in which OPPO orders the placement of each player. The model focuses on optimizing each individual player, one at a time, with the assumption that it is best to optimize in regard to the jump statistic in descending order. Thus, in this example, Heyward—75th percentile—is placed first against Rendon such that his ability to be within reach of a ball is optimized. From there, the two average outfielders are sequentially placed such that their abilities are optimized based on the placement of the previous player. As illustrated in Table 3, OPPO produces an outfield with lesser improvement than a traditionally placed outfield with the same fielders in a few rare cases.
(Click image to enlarge)
In Figure 8, the distributions of the observed percent changes in balls covered for each of the four replacement outfielders is portrayed by a series of vertical box plots. The leftmost box represents the distribution of these differences when the replacement outfielder is the league-worst in jump. The rightmost box, however, represents this distribution when the replacement outfielder is the league-best by their feet covered metric.
Figure 8. Box-plot depicts the spread of percent change in balls reached upon the replacement of the 0th, 25th, 75th, and 100th percentile outfielder in terms of feet covered.
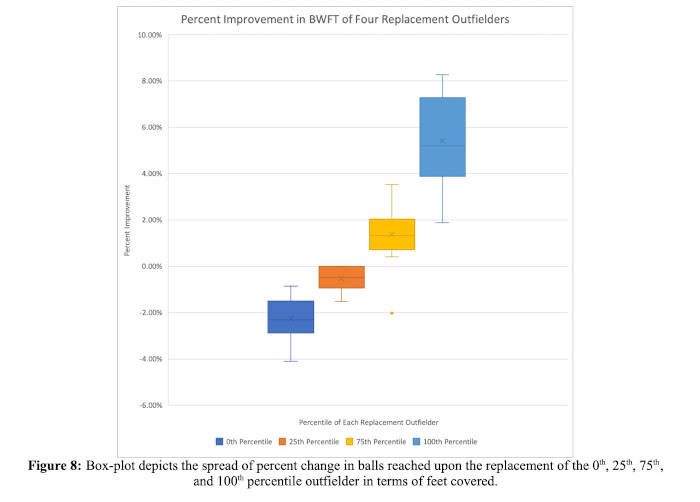
Looking at the two rightmost boxes, it appears that the maximum of the upper quartile of the 75th percentile outfielder—represented by the line above the second box from the right—does not even reach the uppermost portion of the 100th percentile outfielder’s lower quartile. Therefore, there appears to be a clear jump in percent improvement when using the league’s best outfielder compared to its 75th percentile one. In practice, this means that a player with a jump akin to Kiermaier’s—the MLB leader in the statistic in 2019— provides increasing marginal returns to an outfield’s balls reached, compared to what an outfielder with an average jump provides. Meanwhile, there is no indication of a sizeable gap between other adjacent groups. Most notably, the median of percent improvement of both the 0th and 25th percentile outfielders is less than one percentage point from another—and likewise, even true between the 25th and 75th percentile outfielders. Ultimately, this shows that the change in improvement is the flattest between 25th and 75th percentile players—showing that the marginal improvement on an outfield’s balls reached by replacing the former with the latter is minimally effective.
As roster evaluation adapts to new traits that make a player a strong outfielder as well as how to utilize OPPO to construct an outfield, there will be a need to compensate players for their defensive performance. As seen in Table 3, there are significant jumps throughout the data—that is, there is an exponential correlation between a player’s range and the increased output on the whole outfield. This could cause a far more sectored market for defensive outfielders. Top-tier defenders were shown to increase outfield output by over 4% compared to 75th percentile defenders, which only increased outfield output by about 1.4% above replacement. Thus, securing an elite defender has become even more valuable, as OPPO allows for the maximization of this player’s skill set. In contrast, the discrepancy between the 75th percentile outfielder and the 0th percentile outfielder is a 3.63% increase in plays within reach. Just as OPPO allowed for maximizing the advantage of having an elite defender, it also allows teams to hide the inabilities of a weaker defender. Therefore, general managers will likely opt for a lower-graded defensive player, as it is likely not worth the financial burden to pay for an above-average defender, especially if there are tradeoffs in offensive production.
DISCUSSION
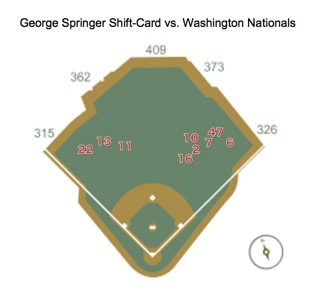
The most practical application of OPPO is as an effective advanced scouting tool used to position outfields on a game-by-game basis. Prior to a game, teams could input the lineup of the opposing team-one hitter at a time—as well as their own starting outfielders in order to maximize the odds that balls in play are reached. Where OPPO improves upon standard positioning is that it offers outfield placement that is tailored to individual hitters and outfielders. While implementing OPPO in-game, however, it may not be as simple as giving typical shift-cards to each outfielder because the outfield alignment is area-based. In addition to briefing players pregame as per usual, one way to modify these cards could be to superimpose the jersey number of each opposing hitter at the coordinate of the field OPPO suggests that one outfielder should play. Figure 9 represents a hypothetical OPPO shift-card for George Springer while he plays alongside Josh Reddick and Michael Brantley in World Series Game 7 against the Washington Nationals in 2019.
Ultimately the details of deployment and use of OPPO as an advanced scouting tool would be up to each team and what the coaches and players deem the easiest way to digest the information. Furthermore, front offices may face difficulty in convincing personnel of the benefits of a more fluid positioning system such as OPPO. To get the outfielders and pitchers to buy in, teams should explain the individual and collective improvements yielded by the new system. Thus, players will have an incentive to buy in as more front offices begin to strategize defensively in a data-driven way. Players who accommodate new tactics will increase their value on the open market.
Not limited to only in-game strategic insights, OPPO and subsequent analysis also provides the potential to evaluate outfielders on a different basis from that which they are currently assessed by front offices. Rather than using DRS and other more complex— albeit robust—proxies of defensive ability, focusing on a player’s jump seems to improve the understanding of the first half of every defensive event: reaching the ball put in play. A further analysis should study the relative importance of an outfielder’s ability to reach a ball, compared to other unrelated skills, such as his ability to catch, throw with power, and throw with accuracy. Perhaps if such analysis shows a large relative importance of jump alone, teams will value arm strength and other skills differently, and the conception of what defines an “elite” outfielder might be weighted in favor of a player’s ability to cover ground. Furthermore, while certain aspects of jump can be taught—particularly one’s route efficiency—burst and reaction are, to an extent, innate to one’s body-type and athleticism. Locating players with these raw traits, even if they do not play the outfield, could indicate their future success as an outfielder, assuming they can be taught a new position.
Teaching a player to play outfield, whether entirely new to the position or adjusting to a position-fluid outfield, will require changes in player development. In all likelihood, every outfielder needs to be comfortable playing in each outfield spot—some conventional and others not. While there are some outfielders today who play multiple outfield positions, those who do not will likely face a steep learning curve. For example, the straight trajectory of batted balls towards center field is very different compared to batted balls hit to the corners, which have a propensity to dip and dive. One would assume that center fielders, who are typically the most athletic outfielders, would adapt fairly well to changing positions. But others may initially struggle reading the path of the ball as it slices down a foul line. Teams considering using OPPO should build in additional practice time during spring training to account for the adjustment period.
Figure 9. Outfield shift-card for George Springer against the Washington Nationals in Game 7 of the 2019 World Series created by OPPO. Positioning is represented by placement of a hitters’ uniform number. Ballpark configurations depict Minute Maid Park.
Insofar as OPPO indicates the values of outfielders relative to one another, the model can form a basis by which teams assign monetary value to outfielders—in the open market and within the organization. After placing outfielders using OPPO, it was determined that the model yields the greatest jump in improvement from replacing the 75th percentile outfielder with the league’s best outfielder. Therefore, it stands to reason that the largest premium between two outfielders should be placed between the “good” and “great” outfielders rather than between the “bad” and “good.” Likewise, if an organization is not willing to shell out big money for an elite defensive outfielder—like Kevin Kiermaier—settling for a slightly below average defender is warranted as the gains made by improving towards the average are small.
It appears the market has begun to move towards recognizing great outfield fielding as an asset: a recent FanGraphs article by Tony Wolfe highlights trends amongst free-agent outfielders. He argues that outfielders, particularly ones with high offensive production but poor defensive statistics, have remained unsigned longer into the offseason. While this may be a sign that fielding is beginning to be valued a bit more fairly in the market, it also raises questions about how that evaluation manifests itself. One of the article’s examples is Bryce Harper, who remained unsigned into February of 2019 after posting a season with -26 DRS with the Nationals in 2018. His next season with the Phillies, he posted a DRS of +10. Statistics like DRS evidently vary from year to year depending on an outfielder’s teammates, pitching staff, and stadium. Jump data—with further analysis—may prove to be less variable year to year, due to its connection to players’ physical tools. Utilizing OPPO, teams could begin to get a clearer picture of how players would fit into the current personnel and perhaps use their team’s makeup to mask the poor defensive play of an incoming free agent.
LIMITATIONS AND AREAS OF FURTHER STUDY
Data from Baseball Savant used in this study provide the coordinates of outfield batted balls for every hitter in 2019. Hit coordinates denote where the ball is first picked up, not where it lands. Therefore, one cannot assume that a ball reached in OPPO is a ball caught. With the data available, outfielders are placed in the best possible position in order to be within reach of as many possible balls. Furthermore, even if data provided where the balls landed, there is no indication of the velocity and trajectory, thus no way of determining whether it would be caught or not. If given data that provided the coordinates of where a batted ball landed, exit velocity, and launch angle, OPPO could maximize outs in the outfield instead of merely maximizing plays within reach. In another experiment with the above variables included in the data, outfielders would be placed in the best position to create the most outs—perhaps eventually going as far as to minimize opponent xwOBA.
Another limitation caused by the data’s constraints is that a player’s jump is assumed to be equal in feet covered regardless of the direction he moves. In reality, while circles present the friendliest shapes to represent with code, outfielders ultimately move in different directions at different speeds and abilities. Thus, the true coverage zone of an outfielder would likely be an oblong shape that is unique to his ability. One way to achieve a more accurate portrayal would be to construct a player’s coverage using his directional Outs Above Average (OAA) in each of the six directions that it is measured. By making this change, players previously treated equally by OPPO—such as Trout and Calhoun, who are virtually equal by feet covered—would be represented by shapes unique to his own skillset.
Limitations restricted the findings beyond the availability of data. The iterative placement of outfielders coded into the model maximizes balls within reach for individual players in descending order based on the number of feet covered. OPPO moves players individually with the assumption that it is best to maximize the ability of the best outfielder and then sequentially place the other two fielders in descending order to create the optimal outfield formation. This yields some overlap of outfielder coverage in the model, which could be remedied by an alternate optimization approach. A model that places all three outfielders simultaneously ensures that true maximization is achieved. While this methodology was considered in the early stages of this analysis, doing so ran the risk of producing results quite similar to a standard alignment which moves outfielders uniformly in groups. Furthermore, placing outfielders in ascending order by jump statistic could produce potentially improved but certainly different results as well. One possible justification for this tactic is that if the slowest fielder is placed first, then the fastest outfielders can make up for lack of coverage in specific areas.
Ultimately, the categorization of hitters within both tests limited the conclusions drawn from the study as a whole. A more granular and robust method of distinguishing hitters is likely required to truly understand which demographic of hitter OPPO works against best and worst. While splitting up hitters into groups of three by both exit velocity and spray tendencies proved a decent method of categorization, choosing criteria that prove to better map a hitter to his type of spray chart would allow for such categorizations to result in more accurate groups. Alternatively, if OPPO were tested against every eligible hitter, relationships between hitters previously undrawn can be parsed out. Quite possibly, hitters that were not conceived to be similar could belong to the same group or the profiles of each individual hitter could be so specific to each player that groups could even become obsolete.
Altogether, this study is the latest attempt to stay ahead of the curve in developing specific analytics-driven defensive strategies. While consequential insights were attained in this research, it marks only the start of the process of outfields reclaiming the “first-mover advantage” over constantly adapting hitters. Ultimately, the implementation of the methods detailed above in live major-league action would represent a massive leap for an already analytically driven industry.
COLUMBIA UNIVERSITY SOCIETY FOR BASEBALL RESEARCH is an interdisciplinary undergraduate student group affiliated with Columbia University founded by Anthony Montes and Charles Orlinsky. The mission of the club is to curate, create, and publish novel baseball research from the greater Columbia community and foster an accessible learning environment for Columbia students and faculty to grow baseball knowledge. If you have any questions or interest in collaborating, feel free to contact current President Anthony Montes via email at ajm2273@columbia.edu.
Notes
1. Rob Arthur, “Do MLB Teams Undervalue Defense—Or Just Value It Differently?” FiveThirtyEight.com, April 18, 2019, accessed February 10, 2021. https://fivethirtyeight.com/features/do-mlb-teams-undervalue-defense-or-just-value-it-differently.
2. Brian Reiff , “The Effectiveness of Strategic Outfield Positioning” [Conference Presentation], SABR Analytics Conference, Phoenix, Arizona, March 8, 2019, accessed February 10, 2021. https://sabr.org/latest/2019-sabr-analytics-conference-research-presentations.
3. Mark Simon, “The Rise of Outfield Shifts,” Bill James Online, February 22, 2019, accessed February 4, 2021. https://www.billjamesonline.com/the_rise_of_outfield_shifts.
4. Russell A. Carleton, “Baseball Therapy: The Corner-Outfield Inefficiency,” Baseball Prospectus, November 25, 2013, accessed February 4, 2021. https://www.baseballprospectus.com/news/article/22295/baseball-therapy-the-corner-outfield-inefficiency.
5. Russell A. Carleton, “Baseball Therapy: Is the Whole the Sum of its Parts?” Baseball Prospectus, May 2, 2017, accessed January 31, 2021. https://www.baseballprospectus.com/news/article/31734/baseball-therapy-is-the-whole-the-sum-of-its-parts.
6. Statcast Jump Leaderboards, Baseball Savant, accessed May 9, 2020. https://baseballsavant.mlb.com/leaderboard/outfield_jump.
7. Statcast search, Baseball Savant, accessed May 9, 2020, https://baseballsavant.mlb.com/statcast_search.
8. Statcast Jump Leaderboards.
9. Statcast search.
10. Bill Petti, “Data Visualization Functions,” baseballr, accessed May 9, 2020. http://billpetti.github.io/baseballr/articles/plotting_statcast.html.
11. Statcast Jump Leaderboards.
12. FanGraphs Leaderboards (Batted-Ball), FanGraphs, accessed May 9, 2020. https://www.fangraphs.com/leaders.aspx?pos=all&stats=bat&lg=all&qual=y&type=2&season=2019&month=0&season1=2019&ind=0&team=0&rost=0&age=0&filter=&players=0&startdate=2019-01-01&enddate=2019-12-31.
13. Minute Maid Park (Houston): Ground Rules, Major League Baseball, accessed May 9, 2020. https://www.mlb.com/groundrules/venue-2392.
14. Tony Wolfe, “Are Defensive Concerns Holding Up the Outfield Market?” FanGraphs, January 17, 2020, accessed February 10, 2021. https://blogs.fangraphs.com/are-defensive-concerns-holding-up-the-outfield-market.