

Pitch Counts: Hurlers Now Toss Fewer Innings But Do Just As Much Work
This article was written by Daniel R. Levitt
This article was published in 2000 Baseball Research Journal
In 1997 Roger Clemens and Pat Hentgen tied for the American League lead in innings pitched with 264; John Smoltz led the National League with 256. In 1919, three hurlers pitched over 300 innings, and the 1997 league leaders would not have finished in the top five in either league. Many reasons have been suggested over the years for this decrease in starting pitcher innings. They range from pitchers not throwing enough as youngsters to build arm strength, to the evolution of a more complex relief pitcher strategy.
With the availability of pitch count data in recent years, we can take a fresh perspective on pitcher use. These days, a pitcher’s workload is assessed by how many pitches he actually threw, rather than the number of innings he pitched. This information can now be found in most newspaper boxscores. Unfortunately, because historical pitch count data is not available, comparisons with previous eras are difficult.
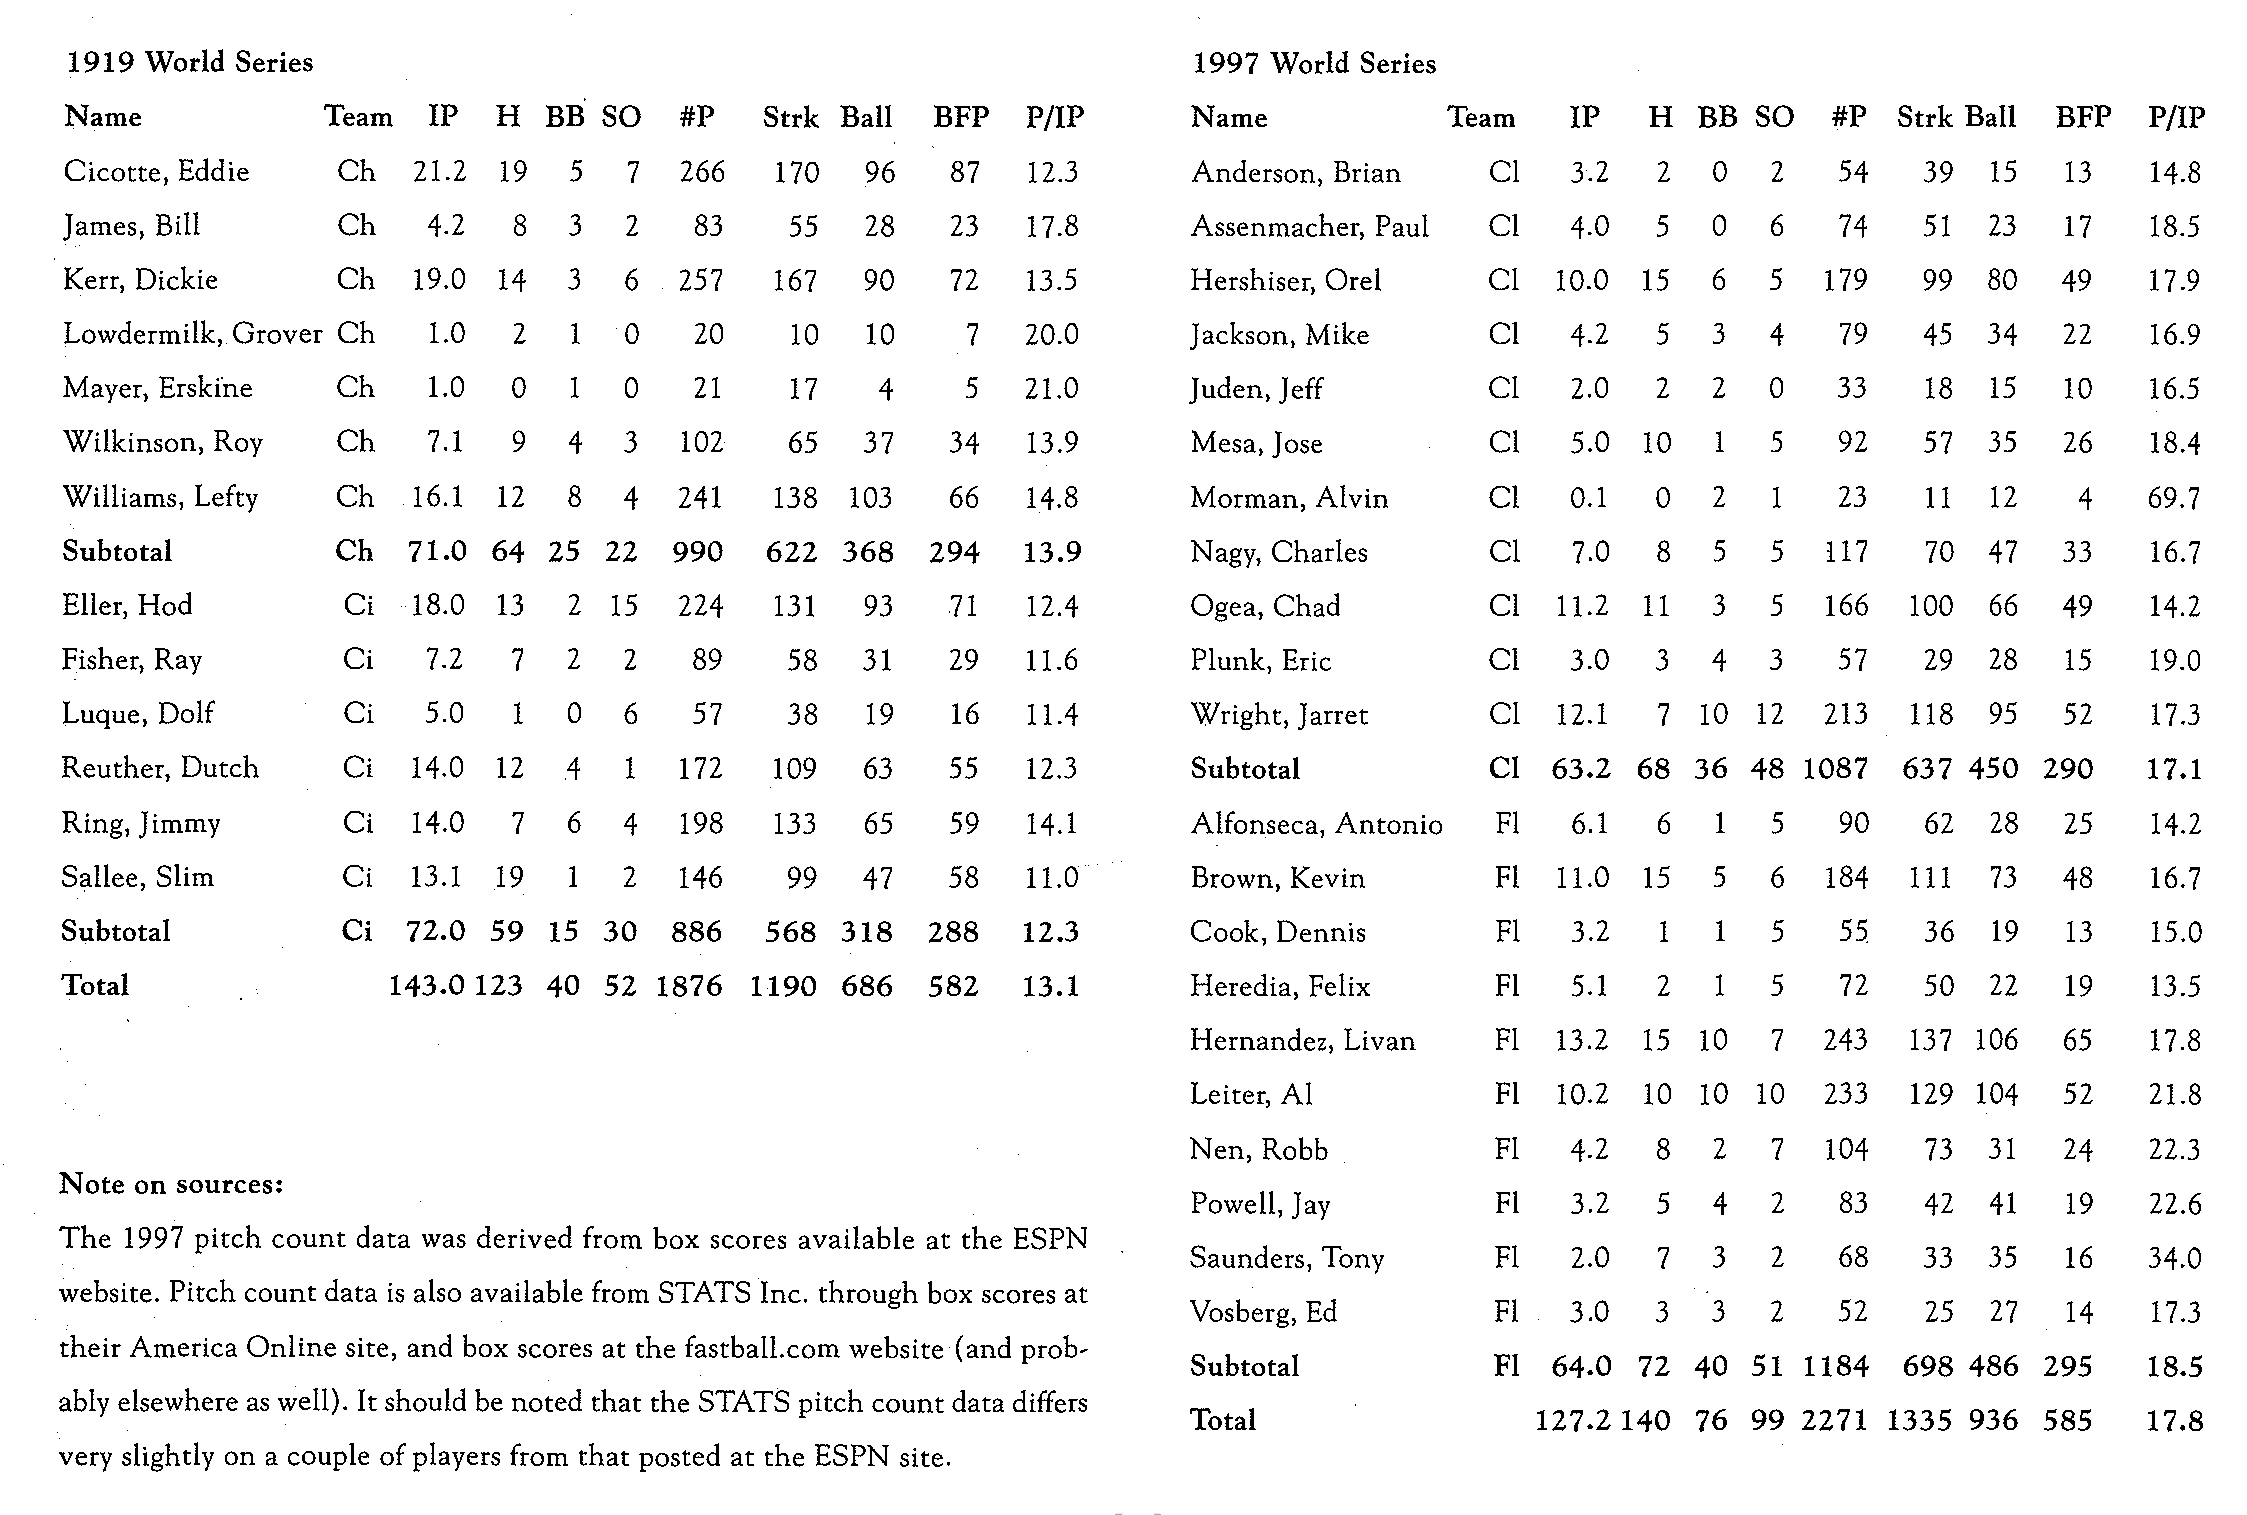
The 1920 Spalding’s Guide, fortunately, contains pitch count data for all pitchers in the eight-game 1919 World Series. The analysis below compares this data with that from the seven-game 1997 World Series to examine the changes over time. Obviously, the 1919 World Series included games whose results are tainted. I hope and assume that any deliberate misdeeds did not materially affect the overall pitching style of the time. Pitching patterns may differ in the World Series as compared to the regular season, but I think that concern is mitigated by comparing Series to Series.
In Game 5 in 1919, Lefty Williams pitched eight innings, gave up four hits and two walks, struck out three and threw a total of 105 pitches. In Game 4 in 1997, Jaret Wright pitched six innings in which he surrendered five hits and five walks and struck out five; this performance also required 105 pitches. It’s clear from the data that this is typical — pitchers today throw significantly more pitches per inning than their 1919 counterparts.
The summary pitching statistics for the two World Series read as follows:
| Year | IP | H | BiP | BB | so | Pitches | Strikes | Balls | BFP |
|---|---|---|---|---|---|---|---|---|---|
| 1919 | 143 | 123 | 500 | 40 | 52 | 1876 | 1190 | 686 | 582 |
| 1997 | 127.2 | 140 | 424 | 76 | 99 | 2271 | 1335 | 936 | 585 |
*BiP = Balls in Play and BFP = Batters Faced by Pitcher
The above table indicates the increased number of pitches thrown per inning by modern hurlers. Despite throwing only ninety percent as many innings as their 1919 counterparts, pitchers in the 1997 World Series threw 114 percent as many pitches. As the table below indicates, the increase in pitches per inning from 13.1 in 1919 to 17.8 in 1997 is a function of both an increase in batters faced per inning and pitches thrown per batter. Note that all references to either 1919 or 1997 refer to World Series data only.
| Year | BFP/IP | P/BFP | P/IP |
|---|---|---|---|
| 1919 | 4.1 | 3.2 | 13.1 |
| 1997 | 4.6 | 3.9 | 17.8 |
Mathematically, the pitches per inning equals the batters faced per inning multiplied by the pitches thrown per batter. As you can see, both have increased rather dramatically. The increase in pitches per batter can be at least partially explained by the increase in walks and strikeouts per batter.
| Year | BB/BFP | SO/BFP | Total/BFP |
|---|---|---|---|
| 1919 | 6.9% | 8.9% | 15.8% |
| 1997 | 13.0% | 16.9% | 29.9% |
The total percentage of strikeouts and walks per batter faced nearly doubled from just over fifteen percent to nearly thirty percent. Given that plate appearances that end in a walk or strikeout typically require more pitches than those that end in a ball in play, it seems likely that much of the increase in pitches per batter can be accounted for by the increase in walks and strikeouts. Interestingly this change occurred without much of a change in the overall strike-to-ball ratio. In 1919 strikes accounted for sixty-three percent of the pitches; by 1997 this figure had only fallen to fifty-nine percent.
Walks, of course, can affect the number of pitches per inning in two ways. They don’t just involve higher pitch counts per plate appearance; they also increase the number of batters per inning. In 1919, the two opponents combined for 163 hits and walks in 582 BFP, or .280 per batter faced. By 1997 this had increased to 216 hits plus walks in 585 BFP, or .369 per batter faced.
In 1997 pitchers tossed 1.36 times as many pitches per inning as their 1919 counterparts. A nine-inning game in 1919 averaged 118 pitches while one in 1997 averaged 160. Of the pitchers who threw at least ten innings in the World Series, not one averaged more than 14.1 pitches per inning in 1919, while in 1997, not one pitcher averaged less than that. Assuming the number of pitches as the correct measure of pitcher workload, on average, a 300-inning season in 1919 would be the equivalent of 221 innings today. Using the available World Series pitch count data, pitchers today work just as hard as their Deadball Era brethren, they just do it in fewer innings.
DANIEL R. LEVITT is past president of the Halsey Hall chapter and plays on the chapter’s nineteenth century baseball team, the Quicksteps. He lives in Minneapolis with his wife and family.
(Click image to enlarge)