

Ranking Baseball’s Best Single-Season Home Run Hitters
This article was written by Kyle Bang
This article was published in 2003 Baseball Research Journal
Seventy-three home runs in a single season would have been considered absurd only a few years ago, yet Barry Bonds accomplished this astounding feat in 2001. Bonds’ record-breaking season, eclipsing the mark of 70 set by Mark McGwire only four years earlier raises the question of which ballplayers truly own the greatest single-season home run performances in baseball history. Although Bonds and McGwire shattered the previous standards, their numbers may be somewhat tainted as home run totals in recent seasons have experienced significant inflation
Prior to 1998, only two players had ever hit 60 home runs in a single season. The 60-home run barrier, virtually unattainable for decades, was surpassed six times between 1998 and 2001. This rapid rise in the number of home runs creates complications in comparing the statistics of Babe Ruth to those of Barry Bonds or other recent players. In order to compare home run statistics of recent seasons to those from years ago in a straight forward manner, a method that accommodates for the fluctuations in home run totals throughout baseball’s history is desirable. This is done by calculating the number of standard deviations an individual’s home run statistics were above the average player’s statistics for that particular season.
Accounting for the disparity in home run totals created by the era in which a hitter played is an effective way to compare various players and determine the best single-season home run performances of all time.
The Z-Score Calculation
A z-score is a calculation of how many standard deviations a statistic is above or below the mean. The standard deviation is a measurement of dispersion from the mean. The following formula is used to produce the z-score:
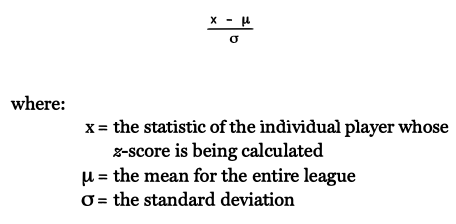
Instead of examining home run totals directly, we use home run rates in the z-score calculation. This is the percentage of at-bats that result in home runs. The use of home run rates places all players on an equal level, so a player with a high number of at-bats will not receive a favorable z-score simply because he had more opportunities to hit home runs. This does not penalize Bonds, Ruth, or other sluggers who frequently received bases on balls because pitchers refused to pitch to them and risk the more serious damage of being taken deep. The use of home run percentages has the added benefit that a player who missed games due to injury is not disadvantaged. Since every player is on a level playing field, the home run rates produce a more accurate ranking of the greatest single-season home run performances.
Strengths and Weaknesses of The Method
The z-score is best considered a measure of domination since it only determines how well a hitter performed with respect to his contemporaries within the same season. This is perhaps both the greatest strength and the major weakness of using this method to rank home run hitters. The primary strength is that the era in which a hitter played should have no influence on where he is ranked. This is essential for developing an accurate ranking since a variety of factors have severely inflated home run totals in recent years. These factors include:
- Smaller ballparks
- Advances in training and medicine
- A smaller strike zone and lower pitching mound
- Great protection such as batting helmets and elbow guards
- Better lighting
Conversely, players from earlier eras had advantages over current players, Among these are:
- Fewer relief pitchers
- Less travel
- Less competition due to the absence of African American and Latin player
These factors will not affect the z-score since players are only measured against contemporaries that played under the same conditions.
However, there are a few shortcomings. It cannot adjust for home run discrepancies created by variations in the sizes of ballparks within a single season, and this will have an evident impact on the list. Some parks are simply easier to hit home runs in than others. A modern example involves the Colorado Rockies. Players for the Rockies rank artificially high due to inflated home run rates caused by the high elevation and thin air in Denver. Another flaw that can skew rankings is an abnormal talent level during a particular season. If there was an unusual abundance or absence of prodigious power hitters, every z-score in the league could be understated or overstated because of a very high or low league home run rate. This appears to have taken place at several points throughout history, most notably during the 1950s and 1960s, when many legendary sluggers were active.
Ranking The Greatest Single-Season Performance
The mean home run rate and standard deviation for each season are computed using the statistics of all players with at least 400 at-bats, and the z-score calculation is performed for the individual players with the highest home run rates in each respective season. The resulting z-score is used to develop a list that ranks the most dominant single-season home run totals.
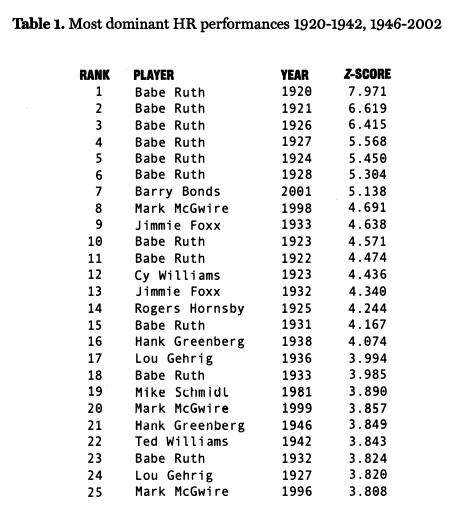
Table 1 lists the top 25 single-season home run performances according to z-score. The z-score calculation has been made for the top performers in every season from 1920 to 2002, Seasons prior to 1920, commonly referred to as the Deadball Era, are excluded from calculations because the enormous size of most of the era’s ballparks, combined with the “dead” baseball, made home runs rare. The years 1943 to 1945 are also excluded when many of the game’s best hitters served in World War II. A list of the 100 greatest seasons can be found at www.d.umm.edu/~jgallian/zscore.html.
Ruth and His Contemporaries
The results prove that Babe Ruth is undoubtedly the most dominant home run hitter ever in terms of z-score, as no other player even approaches Ruth’s numbers. Ruth occupies the top six positions on the list and 11 of the top 25. His 1920 season produced an absolutely astronomical z-score of 7.971, drastically outdistancing the next highest z-score, Ruth’s 1921 season of 6.619. Ruth obliterated the home run record by hitting 54 home runs in 1920, nearly doubling his old record of 29 set the previous season.
Ruth utterly dominated the early 1920s, but his numbers became less stunning as the decade progressed and several players began to rise and challenge Ruth by producing comparable home run figures. Ruth does possess the top rate for each year during the decade except for 1925 when he missed a significant portion of the season due to an illness. Ruth ranks among the top 50 for all 13 seasons of his career in which he had at least 400 at-bats.
The 1920s and 1930s is the golden age of dominant power hitters. Besides Ruth, the best seasons of Jimmie Foxx, Lou Gehrig, and Hank Greenberg rank very high on the list. Foxx dominated the early 1930s, as his 1932 and 1933 seasons both rank among the top 15. Foxx’s 48 home runs and home run percentage of 8.38 in 1933 placed ninth on the list, trailing only Ruth and the record-shattering performances of McGwire and Bonds in 1998 and 2001, respectively. Hank Greenberg appears near the top of the list despite missing nearly five entire seasons at the peak of his career due to his participation in World War II. Both Greenberg’s 1938 and 1946 seasons are among the 25 best seasons.
The major surprise from Ruth’s era is the 1923 season of the Phillies’ Cy Williams. Williams tied Ruth with 41 home runs and had a home run rate just slightly below Ruth. Williams had several outstanding seasons throughout the 1910s and 1920s, but his home ballparks made a significant contribution to his statistics. Williams began his career with the Chicago Cubs prior to the construction of Wrigley Field and was then traded to the Philadelphia Phillies. In each instance, he took advantage of extremely short fences in right field as a left-handed pull hitter.
Current Players
Two of today’s superstars fared exceptionally well when the z-score was applied to their statistics. The historical seasons of Barry Bonds and Mark McGwire rank seventh and eighth, respectively, following only the six best seasons of the unparalleled Ruth. Although home run rates have skyrocketed to astounding new heights over the past few seasons, both Bonds and McGwire are still off the charts. Bonds’ 2001 z-score of 5.138 places him alongside Ruth as the only player to surpass five standard deviations above the mean home run rate. Bonds had an absolutely ludicrous home run rate of 15.34, meaning he would have hit .153 solely with home runs.
McGwire, who consistently places in the top 50, is the only other recent player found among the all-time leaders. Based on z-score, McGwire is arguably the second-greatest power hitter in baseball history, behind only Babe Ruth. McGwire makes five appearances in the top 50, and he would have more had he not struggled with injuries for the bulk of his career. For example, McGwire’s incredible 32 homers in only 236 at-bats in 2000 gave him a home run percentage of 13.56, just slightly behind his record pace of 1998. This would have been the third-highest home run rate ever had he not missed half of the season battling injuries
The remainder of active sluggers do not produce impressive z-scores like Bonds and McGwire. Sammy Sosa, who possesses three of the top six single-season home run totals of all time, failed to place any of his performances among the top 50 in terms of z-score. His best z-score of 3.252 in 2001 ranked 52nd. Sosa’s memorable 1998 season is hurt by his unusually high number of at-bats for a power hitter, which lowers his home run percentage. Also, Sosa amazingly did not lead the league in home run percentage in any of these three seasons, guaranteeing that at least one player must be ranked ahead of him from all three years. The z-score, a measurement of domination over competitors, shows that Sosa’s statistics are not as incredible as they may initially appear
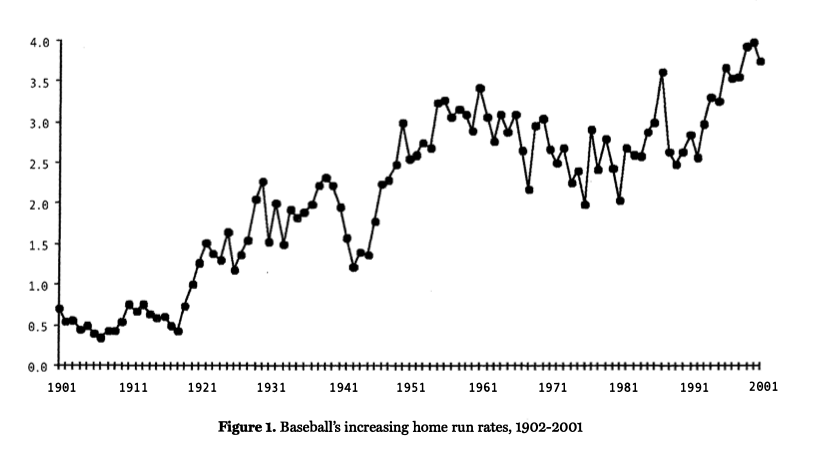
Sosa is not alone in this category. The home run statistics of most active players are considerably less impressive after the z-score calculation is performed. The dramatic rise in the mean home run rate, depicted in the graph on the following page, has lowered z scores. Consequently, home run totals that initially seemed remarkable are just typical statistics. One of the most telling figures that demonstrates this inflation is that 36 of the top 100 single-season home run totals have occurred since 1996. A prime example of a low z-score resulting from high inflation is Luis Gonzalez’s 57 home runs in 2001. He ranks twelfth on the single-season home run list, but his z-score of only 2.4 standard deviations above the mean does not come close to cracking the list of the top 100 z-scores. Obviously, when compared only to his counterparts of 2001, Gonzalez cannot compete with the home run statistics of Bonds or even Sosa
Ken Griffey Jr., who is frequently mentioned in the same breath with baseball’s most legendary hitters, is another active player with zero appearances in the top 100. Griffey did have some outstanding seasons, but none where he is distinctly separated from the competition, which is essential for achieving a high ranking in a method that measures domination. In general, z-score accurately depicts where each current player truly ranks among the great home run hitters. B Bonds and Mark McGwire, the two players who do possess dominating home run totals and rates, rank very high on the list, and the remaining players whose figures are elevated due to home run inflation are found far down the list in their proper location.
Problems With The Method
The ranking based on z-score is a vast improvement from the basic home run list, where it is virtually impossible to compare any statistics from different eras. However, this method does have its flaws. A problem that arises throughout the 1950s and early 1960s is the best example of the deficiencies of this method. With 61 home runs in 1961, Roger Maris held the single-season home run record for 37 years until it was shattered by McGwire.
Maris’s 1961 performance ranks 77th on the list, between players such as Hal Trosky and Bob Horner. Maris totaled nearly 600 at-bats for the season, making this home run percentage relatively low compared to his actual home run total because of his uncommonly high number of at-bats for a power hitter. Nevertheless, ranking 77th is peculiarly low for a season of 61 home runs under any circumstances. Home run rates did soar to previously unseen levels in 1961, partly due to the remarkable performances of Mickey Mantle and Roger Maris and partly because of the American League expansion.
Both home run percentage and total home runs in 1961 were actually comparable to today’s figures, as the 1961 season has the highest overall league home run rate excluding 1987 and the past seven seasons. even excluding Mantle and Maris, home run rates in 1961 and throughout the entire era were abnormally high. Consequently, no player from the 1950s or 1960s produces a very high z-score.
The Talent Factor
It’s strange that the 1950s and 1960s, an era famous for its wealth of power hitters, did not produce a single z-score that ranks high on this list. Harmon Killebrew’s 1963 season and Willie Mays’ 1965 season are the only two seasons between 1950 and 1970 that rank among the top 50.
Throughout these two decades, a group of nine of ten players consistently separated themselves from the remainder of the league. This group includes legendary sluggers like Mickey Mantle, Ted Williams, Willie Mays, Hank Aaron, Harmon Killebrew, Ralph Kiner, Ernie Banks, Rocky Colavito, Frank Robinson, and Eddie Mathews.
These legends were clustered together at the top of the home run chart, raising the league home run rate for the season by a considerable amount. Since the z-score method favors a situation in which only one or two players distance themselves from the pack, no player between 1950 and 1970 is found near the top of the list. With the overwhelming talent that existed during this time, no individual player was capable of notably distinguishing himself from the remainder of the league and producing a high z-score.
This is the biggest weakness of using z-scores, since an unusually strong year or era or an unusually weak year or era will distort figures because of the abnormal overall home run percentage. This happened as home run rates peaked during the 1950s and 1960s, and the effect seems to disappear as the 1960s came to a close and rates declined. Home run rates would not return to the levels seen during this era until the mid-1990s.
The sharp decline in home runs as baseball entered the 1970s might be partially due to the opposite effect of what happened in the 1950s and 1960s. The 1970s and 1980s are not remembered as an era with an abundance of talented power hitters. Home run rate leaders include mediocre players such as Dave Kingman, Gorman Thomas, Ron Kittle, and Rob Deer. These players took vicious swings and occasionally hit tape measure blasts, but they also compiled astonishing strikeout totals.
The one legitimate slugger of the time was Mike Schmidt, whose best season of 1981 places 19th on the list. Schmidt’s extraordinary performance is frequently overlooked since he tallied only 31 home runs in this strike-shortened season. Several z-scores from this era rank much higher than one would expect, including Schmidt’s 1981 season and Dave Kingman’s 1976 season. Kingman’s seemingly mundane 37 home runs and 7.81 home run percentage rank 32nd all-time. The years 1976 and 1981 happen to be the two seasons with the lowest overall home run rates since World War III and in each case the rate plummeted from the previous season
The overall talent level is definitely the chief cause of inaccurate rankings. The list appears accurate for the past 15 years and from the 1920s through World War II, but the degree of clustering at the top of the home run leaderboard from 1950 through the mid-1980s seems to distort the z-scores for these seasons. For instance, Mickey Mantle makes only two appearances in the top 100 despite being widely considered one of baseball’s greatest home run hitters. Still, in spite of this slight distortion created by the talent factor, the z-score method is an excellent technique for accurately determining the greatest single-season home run performances.
Conclusions
Several conclusions can be drawn from this study. The obvious conclusion is that Babe Ruth is far and away baseball’s most dominant home run hitter. To this day, we often hear sports announcers use phrases such as “Ruthian numbers.” Besides Ruth’s dominance, here are other important conclusions from this research:
-
The historic seasons of Barry Bonds and Mark McGwire do not approach Ruth’s numbers, but they are still among the finest performances ever despite the major inflation home run statistics have experienced in recent years.
-
The era with perhaps the most elite home run hitters fared miserably by this method because the league home run rate rose high enough that it was nearly impossible for any individual player to produce an outstanding z-score.
A question that is raised almost every day during baseball telecasts and radio talk shows as current superstars continue to chase and set new records can now be answered. How do today’s players compare to Babe Ruth?
Although it is impossible to say how Ruth would perform under today’s conditions, he is definitely in his own league in terms of dominance of his contemporaries, but Barry Bonds and Mark McGwire have come closer to matching Ruth’s dominance than any other player has. Ruth consistently doubled and nearly tripled the home run totals of his closest competitors, a feat nobody else has even approached. He totally changed the face of the game and was the first player to make the home run an integral part of baseball.
It is a guarantee that no player will ever dominate the sport the way Babe Ruth did. If Barry Bonds’ 73 home runs do not approach the level of dominance that Ruth experienced in his best seasons, it is reasonable to argue that Babe Ruth will always stand alone as the greatest home run hitter in baseball history.
KYLE BANG graduated from the University of Minnesota-Duluth in 2003. This is his first article for a SABR publication.