
Reviewing Instant Replay: Observations and Implications from Replay’s Inaugural Season
This article was written by Lindsay Imber
This article was published in Spring 2015 Baseball Research Journal
The 2014 baseball season’s adoption of expanded instant replay review not only introduced another wrinkle into our national pastime, it opened the door into a brand new arena of statistical analysis over 50 years in the making. Thanks to the adoption of a manager’s challenge system—which MLB has confirmed will remain in place for the 2015 season1—the new technology also added a significant element of strategy to the sport.
Televised replay made its debut during the December 7, 1963, Army-Navy football game when 29-year-old CBS director Tony Verna, who passed away January 18, 2015, at the age of 81, pressed “rewind” on his Ampex tape machine for the first time during a game broadcast.2,3 Since that effort 51 years ago, the technology has spread to all televised and otherwise streamed sports, culminating with the National Football League’s pioneering decision in 1986 to try using replay to review the officials’ on-field calls wherein a brand new off-field replay official had the power to stop play to conduct such a review.
After the system was taken out of commission in 1991 due to concerns of delays, interruptions to game flow and overall sluggishness, replay was tweaked in an effort to better engage fans and teams alike (meanwhile, the NHL adopted its own version of limited replay in 1991).4 When the NFL’s system resurfaced in 1999, it was accompanied by a cutting-edge, engaging, and exciting challenge system: for the first time, coaches could decide which plays to review. At first, the coach received two challenges before being rewarded for successful appeals: a coach would receive a third challenge if he got his first two right.
Baseball was long resistant to adopting replay in any form—it was the last of the four major sports to adopt the technology and boasted lively attitudes against its adoption, including throwbacks to the pace-of-game arguments that took the NFL’s system temporarily offline in 1991.5 Hall of Fame umpire Bill Klem once said, when confronted with a photograph of a purported blown call, “Gentlemen, he was out because I said he was out,” reflecting the human element and umpire-as-final-say argument also used against replay in baseball.6 FOX Sports’ Reid Forgrave penned the sardonic slogan, “Better Baseball Through Technology”7—while others quickly connected the dots between replay adoption and a lengthier ballgame.8
Nonetheless, pro baseball’s journey into instant replay review followed football’s path in several ways. During an otherwise benign May 31, 1999, Cardinals-Marlins contest, Florida batter Cliff Floyd drove a Kent Bottenfield fastball to deep left-center field, where it bounced off or atop the left field scoreboard and was ruled a double by second base umpire Greg Gibson. After a Marlins complaint that the fly ball struck the panel behind the Pro Player Stadium scoreboard, and therefore should have been ruled a home run, the umpires changed the call to a four-base award, prompting an equal-yet-opposite argument from St. Louis. This time, crew chief Frank Pulli opted to consult a dugout-adjacent TV camera to review the play. After the first replay review in MLB history, Pulli changed the call back to a double—effectively confirming Gibson’s initial call. The Marlins responded by filing a protest in their 5–2 loss, which was ultimately denied by National League President Len Coleman, who acknowledged and admonished Pulli for unauthorized use of video replay while denying the Marlins’ protest for Pulli’s judgment call.9
Baseball would not revisit replay until 2008, when the league became the last of the four major American sports to authorize replay reviews for select on-field calls—whether a potential home run was fair, foul, in or out of play, or subject to spectator (fan) interference. At the time of its midseason adoption, baseball required its umpires to initiate and adjudicate the entire replay process while some managers, led by Chicago’s Lou Piniella, already were campaigning for a challenge system: “I’d love to throw a red hankie.”10 Though limited replay remained in force from 2008 through 2013—producing 392 total replays in five-plus seasons, 132 of which (33.7%) were overturned11— Piniella would get his wish in late 2013, when MLB experimented with the notion of expanded replay and NFL-esque challenges. Having selected five games in the 2013 Arizona Fall League in which to experiment with a modified “unlimited challenge” version of the modern replay review system, MLB watched umpiring crew chief Tripp Gibson don the now-familiar headset 15 times, affirming 12 calls while overturning three for a 20% overturn rate.12
In a related story, a 2010 ESPN study of nearly 10,000 calls found that umpires are 20% inaccurate when it comes to “close” calls, which, all else equal, would support a 20% overturned call rate for an unlimited replay system, as occurred in the 2013 Arizona Fall League.13 On the other hand, since ESPN’s analysis also found that just 1.3 calls per game, on average, were close enough to merit replay review, further extrapolation of the data found that umpires are inaccurate less than 0.5% of the time, or, alternately, are 99.5% accurate.14
GROUND RULES: PREPARING FOR EXPANDED INSTANT REPLAY’S INAUGURAL SEASON
As Opening Day 2014 approached, Commissioner Bud Selig’s Special Committee for On-Field Matters pared down the fall’s unlimited replay regimen, settling on just one challenge per manager with the reward system of a second possible challenge if the manager experienced success with challenge number one.15 Further adding to the mystique of replay, MLB announced that, beginning in the 7th inning, the umpiring crew chief could initiate replay review if a manager was out of challenges. To make strategic matters even more delicious, limited replays circa-2008 were grandfathered and combined with matters concerning new home plate collision Rule 7.13 into a replay class that would be unchallengeable—only the crew chief could initiate home run boundary or plate-blocking replay reviews. In order to appease the umpires’ union, MLB agreed to staff its league’s new state-of-the-art Replay Operations Center with two crews of umpires, which accounted for baseball’s hiring of seven new officials to the full-time MLB staff in advance of the 2014 season.16 In order to appease its owners, MLB authorized its teams to staff replay coordinators in clubhouses to review multiple feeds and camera angles, with a direct phone line to the dugout in order to advise a team whether it should challenge a play.17
Based on expanded replay’s framework, teams would have to become “replay smart” to make the most of baseball’s new technology. In addition to choosing the right replay coordinator—some teams chose rules-smart umpires—managers themselves not only would have to hone their argument craft to ‘turn’ or delay the umpire, thus allowing the coordinator more time to review video, they would have to figure out, in a world with finite challenges, just when to use one.18
For instance, when Giants manager Bruce Bochy unsuccessfully challenged an early-inning close call at first base in Arizona less than a week into the 2014 season, he lost his challenge for the rest of the game and had to argue the old-fashioned way when the Diamondbacks scored on an ensuing passed ball— although replays indicate the plate umpire’s call was incorrect, the challenge-less Bochy couldn’t do a thing about it: Score one run for bad replay strategy, and potentially one win, too, as Arizona won the ballgame by one, 5–4.19
METHODS: CHOOSING THE VARIABLES TO TRACK
With a bevy of data set to head our way in 2014, choosing the proper variables to document proved a most important task. Reframing the task in a way that considered the potential effect of replay review on the course of a game, however, made such a chore much simpler. In the end, replay reviews were logged individually (even in the case of two replay reviews which occurred during the same play20) and included the following variables:
- Type: Manager’s Challenge or Crew Chief Review
- Umpires:
– Name
– Position (HP/1B/2B/3B)
– Status (Full-Time MLB or Triple-A Fill-in)
– Crew Chief (e.g., the umpire who actually spoke with New York) - Quality of Correctness/Outcome: Call Confirmed/Stands/Overturned
- Teams:
– City Short-Code (e.g., CIN for Cincinnati, TB for Tampa Bay)
– Active Manager Name (e.g., the person who spoke with the umpire) - Reason:
– Appeal Plays
– Base Touches
– Boundary or Ground Rules
– Catch/No Catch (e.g., a ball dropped on the transfer)
– Catch/Trap (e.g., a ball either caught or trapped by a diving outfielder)
– Fair/Foul
– HBP/Foul (e.g., questions concerning a pitched ball vs. the batter)
– HR Boundary Calls (those that were reviewable dating back to 2008)
– Non-HR Fan Interference
– Passing Runners
– Rule 7.13 (the home plate collision rule)
– Safe/Out
– Time Plays (did the run score prior to the third out being recorded?) - Variable Game Situation:
– Inning-of-Review (including Top/Bottom)
– Offense/Defense (was the requesting team at bat or in the field?)
– W/L Pre-Review (was the requesting team winning/losing/tied at the time of review?)
– W/L Final (did the requesting team win or lose the ballgame?)
– Runs Scored by the requesting team
– Runs Scored by the opposing team
– Day of Week
NEW MEASURES OF PERFORMANCE
The following sabermetric definitions were created specifically for replay review analysis: Review Affirmation Percentage (RAP) is also known as collective replay quality of correctness and is a value representing the frequency with which an umpire’s call is affirmed (confirmed or stands) by replay affected as the result of both managers’challenges and crew chief reviews. Team Success Percentage (TSP) frames the issue from the team’s perspective and is thus the inverse of RAP, while Manager’s Challenge Success Percentage (MCSP) is similar to TSP, except that it only accounts for managers’ challenges, removing crew chief reviews from the equation. None of these measures includes reviews of the record-keeping variety. In short:
- RAP = Calls Affirmed by Replay Review / Total Calls Replayed
- TSP = 1.000 – RAP (or, alternately, Calls Overturned / Total Calls Replayed)
- MCSP = Challenges Overturned by Replay Review / Total Calls Challenged
Please note that for the purposes of the instant replay review analysis contained herein, the term “percentage” is used, akin to the colloquially used “winning percentage.” This term accordingly has taken on a vernacular meaning such that a replay-based “percentage” is presented in the form of an average running from .000 to 1.000, similar to the commonly used statistic, “batting average.” The mathematical conversion from RAP, TSP or MCSP average to conventional percent is RAP/TSP/MCSP * 100. To illustrate, a RAP of .500 corresponds to a review being affirmed 50.0% of the time. For instance, Team A plays a game that features three reviews: Team A’s manager challenges a safe call in the fifth inning and, after the manager’s challenge, the original call stands. In the sixth, Team A’s manager requests the umpires review a home plate collision (Rule 7.13) play in which Team A’s runner was ruled out, and, after the crew chief review, the original call is confirmed. In the seventh, Team A’s manager requests the umpires review a safe call at first base and, after the crew chief review, the call is overturned. RAP, TSP and MCSP for this game would be calculated as follows:
- RAP = 2 / 3 = .667 (reviews were affirmed at a rate of .667, or 66.7% percent of the time)
- TSP = 1.000 – .667 = .333 (the team’s success percentage for all reviews was .333)
- MCSP = 0 / 1 = .000 (the manager’s challenge success percentage was .000)
As an aside, if this game featured a fourth review, filed by Team B, the above statistics for Team A would be unaffected.
DATA AND TRENDS: TEAMS AND MANAGERS
Data were collected from the first MLB games with expanded replay on March 31, 2014, through the final day of the regular season on September 28. With 1,274 total replay reviews across 2,428 regular season contests (the replay system was unavailable for the two Dodgers-Diamondbacks Opening Series games in Sydney, Australia)21, MLB saw an average of just over one replay review for every two games played, which featured 601 overturned calls, while 353 stood and 310 were confirmed (10 additional reviews were of the record-keeping variety).22,23 In other words, a call was overturned slightly less frequently than once every four games, which aligns quite well with the ESPN data showing that umpires miss 20% of all close calls.24 Collaterally, the present analysis on replay’s 2014 debut serves to affirm the veracity of ESPN’s 2010 study.
Replay use by team varied from a low of 32 (Milwaukee Brewers, New York Yankees) to a high of 61 (Chicago Cubs)—the average team experienced 42 reviews with 20 overturns (which follows the overall 47% overturn rate described above)25—yet there was actually a negative correlation between frequency of replay use and percentage of calls overturned.26 For instance, no team in the top 11 of replay users had more than 50% of their replayed calls reversed; seven of the bottom 12 replay users (three teams tied for the 10th-least-used position) had greater than 50% of their replayed calls reversed (see Table 1). The upper 53% of teams ranked by replay usage (two tied for 15th place) accounted for 753 (59.6%) of all reviews, with 341 calls overturned (rate of overturn=45.3%). Meanwhile, the lower 47% of teams went to replay a combined 511 times (40.4%), with 260 of their reviewed calls being overturned (rate of overturn= 50.9%). Roughly, the more reviews experienced by a given team, the greater the chance that some of these reviews were unsuccessful and/or frivolous.
To further illustrate the point, consider that when decision-making factored into replay use, defined as a team voluntarily electing to file a finite manager’s challenge as opposed to requesting a “free” umpire-initiated crew chief review, teams fared much better than when the review was a freebie: 1,053 replay reviews were managerially challenged to the tune of a .474 RAP, whereas 221 reviews were of the crew chief variety and, at a RAP of .769, the .295-point difference in RAP constituted a sizeable distinction. Furthermore, the two most successful managers in challenging calls were New York Yankees skipper Joe Girardi and Miami’s Mike Redmond, whose .793 and .731 MCSPs, respectively, were also associated with the fewest number of affirmed calls for any individual teams (nine and 14, respectively). At this point, it is important to note that the Yankees and Marlins ranked tied-for-29th and 27th, respectively, among individual team replay use (Manager Ron Roenicke of the tied-for-29th-place Brewers ranked 12th in MCSP), giving some credence to the notion of replay discretion. As if in perfect balance, the worst-performing manager was Toronto’s John Gibbons, whose .340 MCSP also featured the most affirmed calls for any individual team (39); the Blue Jays went to replay a total of 57 times, third-most in the league (#1 Chicago’s Rick Renteria’s .455 MCSP appeared noticeably below the league-average MCSP of .526 while #2 Tampa Bay’s Joe Maddon fared even worse, with a .438 MCSP). As a corollary to the previous paragraph’s conclusion, it appears the reverse was true as well. The fewer reviews experienced by a given team, the less the chance that some of these reviews were unsuccessful and/or frivolous.
DATA AND TRENDS: UMPIRES
Replay review statistics also advertised individual umpire affinity, revealing several trends amongst the men in black and powder blue. For instance, umpire Chris Guccione fared supreme with a .941 RAP (16/17) while minor-league fill-in Tom Woodring’s .167 (1/6) was the lowest RAP of all umpires with more than five replays to their name (MiLB colleagues Jon Byrne, Jeff Gosney and Ben May all scored a .000 RAP, but only had two reviews apiece). As a whole, less tenured full-time MLB umpires, such as Guccione (hired full-time in 2009), second-place Scott Barry (.875 RAP, hired in 2011), fourth-place Vic Carapazza (.833 RAP, hired in 2013) and fifth-place Mike Estabrook (.813 RAP, hired in 2014) performed much better than both veteran full-timers with significant experience—Crew chiefs Gerry Davis (hired in 1984), Jerry Layne (1989), Tim Welke (1984), Gary Cederstrom (1997) and Jim Joyce (1989) all scored below .385 (MLB’s longest-tenured umpire, Joe West [1978], for those wondering, was the outlier and performed well above average with his 28th-best .600 RAP)—and rookie call-ups with fewer than 100 MLB games under their belt, such as below-.300’ers John Tumpane, Stu Scheurwater, Seth Buckminster, and Woodring.
On the other hand, veteran minor league fill-ins such as Mark Ripperger and Will Little (.714 and .667 RAPs, respectively) performed quite well. For the umpires, a peak window of replay performance existed sometime after working 100 games as a minor-league call-up and, often, before spending many years as a full-time big-leaguer.
Umpires at the first-base position were apt to have their calls overturned more often than at any other base (.448 RAP), while home plate umpires experienced affirmed rulings with more frequency than their field umpire counterparts (.742 RAP).27
Umpires were most questioned about safe/out calls at first base (n=954), followed by HR boundary calls that would also have been reviewable dating back to 2008 (n=97), issues of home-plate collision Rule 7.13 (n=92) and whether a pitch at the plate hit the batter, bat, or nothing (n=46). Issues of catch/trap in the outfield and fair/foul tied for the fifth-most common reason for review, with 21 reviews apiece. The most common overturned call was the catch/trap call (overturned 76.2% of the time), while the least overturned call concerned Rule 7.13 (overturned just 14.1% of the time).28
Though replay is still in its infancy, the fact that Major League Baseball in January 2015 hired some of replay’s top performers amongst fill-in umpires— Ripperger and Little—to the full-time big league staff may reveal a new method of evaluation at MLB headquarters, especially after Park Avenue admitted that its 2014 postseason umpires were selected, in part, due to instant replay performance.29,30
INSTANT REPLAY DYNAMICS AND IMPACT ON GAME OUTCOME
At the end of the day, replay review may be about getting the individual call right, but it also has, from time to time, had an impact on how a game plays out. For instance, of the 1264 non-recordkeeping replays in 2014, teams entered the call-to-be-reviewed play leading 444 times, trailing 488 times, and tied 332 times. As it turns out, this 444–488–332 record turned into 614 wins and 650 losses at game’s end, which corresponds to a .486 winning average. The measured change in W–L record from pre-replay to game final was plus 170 wins and 162 losses, a winning average of .512. In an all-else-equal world where the expected league average change in winning average would be .500, one could say that a team’s invocation of replay review had a somewhat positive correlation with game outcome.
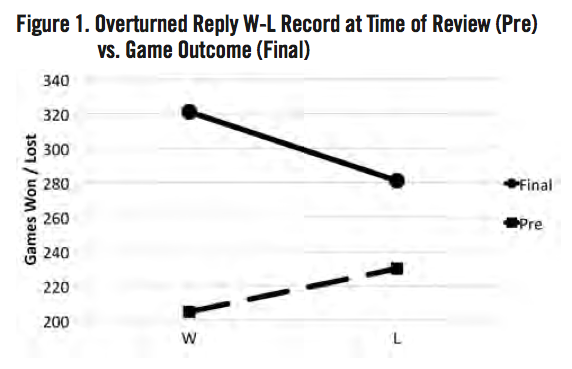
Filtering the data uncovered an interesting and powerful effect: When replay review resulted in an overturned call in 2014—in other words, when the outcome of replay benefited the team that challenged (or prodded the umpires to initiate)—teams that entered the replay situation with a 203–228–170 record finished their games with a record of 319–282 (.531 winning average), a net gain of 116 wins and 54 losses, or a whopping .682 winning average (see Figure 1).
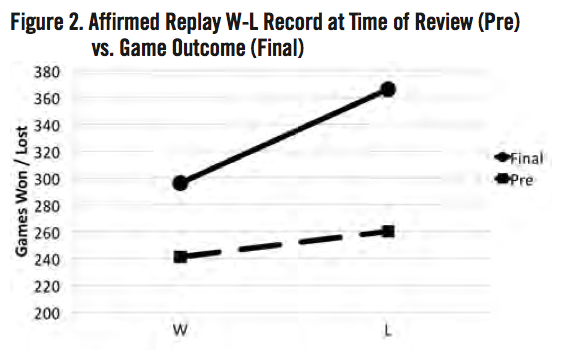
When replay review resulted in a confirmed or upheld call that did not benefit the requesting team, on the other hand, this delta-winning average dropped dramatically to just .329, a game-changing overturned vs. affirmed difference of .353 points (see Figure 2).31 Thus, the data indicate a correlation between replay success and winning a ballgame while also indicating a correlation between lack of replay success and losing.
Breaking down the data specifically by the 484 individual games in which the pre- and final statuses were incongruent—the 332 games tied at the time of review as well as those in which losing situations turned into wins (81 times), and vice versa (71 wins-to-losses)—the following results emerged:
- When Call was Affirmed: Teams stole 27 wins (L-to-W) and 39 losses (W-to-L). Ties turned into 66 wins and 96 losses (93–135 overall, .408).
- When Call was Reversed: Teams stole 54 wins and 32 losses. Ties turned into 95 wins and 75 losses (149–107 overall, .582).
Accordingly, result stealing (defined as a win-to-loss or loss-to-win outcome) occurred in 66 of the 663 affirmed cases and 85 of the 601 reversed cases. Proportionally, this favored the supposition that reversed calls were more strongly associated with change-to-outcome than affirmed calls, while the 81 total stolen wins (53+27) still only accounted for 6.4% of the 1264 total replay reviews; meanwhile, the 71 stolen losses (39+32) accounted for 5.6% of the 1264 total reviews, suggesting that, all else equal, randomly choosing to replay a call has a slightly better shot of turning a loss into a win than a win into a loss. Of course, a loss remained a loss in a majority of those pre-loss cases (407 times), while a win remained a win 373 times—this “same pre-to-final” outcome manifested in 61.7% of all replay pairings, meaning that, all else equal, replay unequivocally had no bearing on win-loss game outcome a majority of the time.
As for our 332 ties, 161 became wins and 171 became losses (.485 WPCT), whose deviation from the zero-sum state of .500 pales in comparison to the distributions related to replay outcome: whether the call was affirmed or reversed (.408 and .582, respectively).
Replay review impact has also been measured by its tangible effect on runs scored or erased, broken into the categories of “mild,” “medium,” and “spicy” (see Figure 3).32
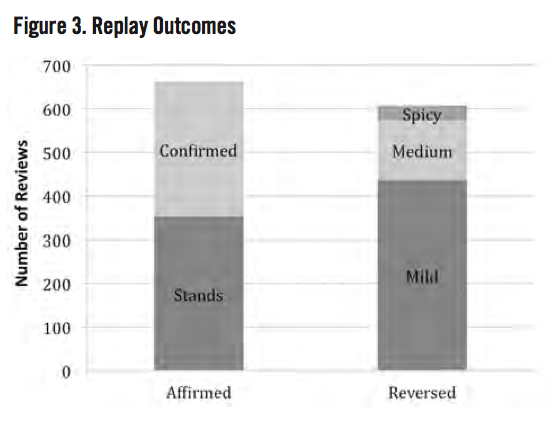
Succinctly, these impact categories only apply to an overturned call pursuant to the following schedule:33
- A mild impact is one in which an overturned call did not lead to any incremental runs being scored or erased.
- A medium impact is one in which a reversed call led to a run(s) being scored or erased, but these runs did not determine the game outcome.
- A spicy impact is one in which a reversed call led to run(s) scored or erased that did determine which team won the game.
For instance, an overturned safe call in the bottom of the ninth inning of a 13–3 ballgame would both effectively end the game and be assigned an impact of “mild.” Meanwhile, an overturned out call at home plate in the bottom of the ninth inning of this same 13–3 blowout would both make the score 13–4 and, barring a miraculous comeback, be assigned an impact rating of “medium.” Finally, this same overturned out call at home plate in the bottom of the ninth inning of a tied ballgame would effectively end the game by scoring the winning run for the home team and, thus, merit the impact rating of “spicy.”
Replay impact was mild a majority of the time (n=432, 71.9%), followed by medium (137, 22.8%) and spicy (32, 5.3%). These 32 spicy plays account for 2.5% of the 1264 total non-recordkeeping replays. Sifting through these 32 spicy replay situations shows that all except one pair of replays were exclusive to one particular game—that is, only one game featured two spicy replay outcomes. That game was the August 19 Tigers-Rays contest, in which a fourth inning home run call was overturned to a foul ball and, in the fifth, a catch was overturned to a trap. The HR play took a run off the board for Tampa Bay while the trap gave Detroit an extra run. The Tigers ultimately won the game in extra innings.34 As such, 31 of MLB’s 2428 replay-capable games contained a “spicy” replay review, a percentage of 1.3%.
Thus, by this metric, replay rarely had a directly observable impact on game outcome and was correlated with a changed outcome of games a distinct minority of the time.
REPLAY BY TIME OF INVOCATION
By game phase, teams were more likely to have a successful replay outcome (an overturned call) early than late; league-wide TSP for the ballgame’s first third (innings #1–3) was .585. This number steadily decreased throughout the contest, such that the mid-game (innings #4–6) TSP was .496 and the late game (seventh-inning onward) TSP was .388.35 The most successful individual inning for review was the second, with 81 overturned calls out of 123 total replays (.659 TSP). When filtering out the freebie crew chief-initiated reviews, teams again fared better while actually amplifying the downward trend of success present in league-wide TSP: .680 MCSP for innings #1–3, .541 for innings #4–6 and .416 for innings #7+.36 Umpires either improved and/or replay initiators (managers for challenges and crew chiefs otherwise) regressed as games progressed into the later innings.
By day-of-week, most challenged calls were overturned during weekend series, specifically on Sundays and Saturdays (.570 and .563 MCSPs, respectively), followed by Fridays (.550), Thursdays (.518), Wednesdays (.506), Tuesdays (.489) and Mondays (.454), as if managers became better challengers as the week wore on, only to repeat the cycle the following week.37
As for time of year and the question of whether more calls were reversed later in the season, the data suggest no relationship between time-of-year and percentage of calls overturned.38 The greatest percentage of overturned calls came in June 2014 (52.1% overturned) while the lowest followed in July (43.5% overturned). Meanwhile, number of replays requested peaked in August (229 replays, or 0.54 per game) after a valley in April (389 replays, or 0.47 per game). Due to the All-Star Break, July actually had the highest replays per game (.55) with the fewest number of games played. The month of September experienced the second-fewest number of total replays as well as replays per game (205 and 0.52, respectively). Thus, teams did not appear to consistently improve as the season wore on, though reviews occurred more frequently after the regular season’s first month and prior to its final month.
IMPLICATIONS FOR FUTURE REPLAY STRATEGY
Insofar as team strategy is concerned, maximizing the benefit of the challenge is key. For instance, teams can “save” this crucial challenge by opting for the freebie crew-chief initiated review, if and when available, either as a preventative measure (e.g., against losing replay capability later on) or as a protective one (e.g., by keeping the challenge).
As a preventative measure, replay challenge opportunity cost decreases throughout the contest, especially as inning number seven approaches, when the crew chief can initiate a review even if a team is out of challenges. With the probability of a missed call occurring during a game firmly lodged at less than 0.5%, the equal distribution of a missed call occurring during any particular half-inning of play is just .028%. With such odds, challenging any perceived missed call might seem like a no-brainer—except if you just happen to be the Giants playing the Diamondbacks in April 2014: then, a bad challenge can cost you a game.
Even if the odds are squarely in a team’s favor, it behooves every team to develop and invest in their video coordinators, replay technology and related education—especially early on in a weekend series game (perhaps in the second inning of a Sunday matinee as umpire eyes adjust to the bright skies and, more importantly, television cameras experience better frame rates to decipher close plays in the surplus of daylight39), when the chances of a call being overturned are highest. After all, replay review is an example of a scenario in which a clubhouse employee can have a direct impact on a team’s winning percentage or probability.
Early in 2014, MLB stated that the purpose of expanded instant replay was “for critical game situations and obvious misses, not the ‘bang-bang’ play.”40 It accordingly follows that a club’s video replay coordinator should be very adept at not simply knowing whether Glove A actually tagged Jersey B, but should be able to decipher this caper with confidence. The chance that any single replay review was confirmed in 2014 was 24.5%, compared to 27.9% for ‘stands’ and 47.5% for ‘overturned,’ meaning that, pursuant to MLB’s own framework, replay was used as intended just 47.5% of the time—and was flat out abused at least 24.5% of the time. The sure thing of overturning an “obvious miss” turned into somewhat of a coin flip because teams simply didn’t use the new technology correctly, perhaps because video coordinators, bench coaches and/or managers—notably those in Toronto, Tampa Bay, and the other “lower half” teams—didn’t know what to look for, didn’t know the rules, or simply were unable to think like an umpire.
As a protective measure, rules regarding crew chief-initiated reviews prior to (and, to a lesser extent, after) the seventh inning suggest that sly managers would do well to request an umpire-initiated freebie review whenever possible, given that 47.5% of reviewed plays result in overturned calls.41 On the other hand, crew chief reviewed plays were affirmed 76.9% of the time. Because the grandfathered home run boundary 7.13 call cannot be challenged and instead must be initiated by the crew chief—and because replay officials consider all aspects of a play during the review, which means the issue of fan interference is considered during a HR boundary call, for example—managers would be wise to request a crew chief review for any close play at the wall. Returning to the Bochy problem in Arizona, had the Giants requested a review pursuant to the Rule 7.13 framework, that, in 2014, mandated this type of review be initiated by the crew chief, perhaps the Giants would have been the beneficiaries of a crucial overturned call. After all, the Los Angeles Dodgers were granted a Rule 7.13 crew chief-initiated review in June on a tag play at home plate that didn’t even involve the catcher!42
As a matter of strategy, managers would be wise to challenge or request an-otherwise benign review when on defense, during stressful situations. Although replay regulations may prohibit actual mound visits during reviews, 2014’s league-average 1:46 review— 2:15 if the call stood—was precisely one minute and forty-six seconds of extra time for a reliever to prepare in the bullpen: over the course of the season, baseball spent 37 hours, 32 minutes, and 30 seconds watching umpires wear headsets, which should prove ample time for all manner of stall tactics.43 Since reviews are freebies after the sixth inning anyway, and most bullpen management occurs during these later innings, exploitation of replay for warm-up time gain seems self-fulfilling.
Finally, while losing a replay review dropped a team’s W–L average to .342, compounding this effort with an ejection for arguing the review’s outcome was a nearly sure-fire way to lose the ballgame. There were 24 ejections for arguing a replay review in 2014, with the ejected party’s team entering the ejection situation winning five times, losing 13 times and tied six times. Those ejected teams went on to win the game six times while experiencing a loss 18 times, for a net change of 1–5 (16.7 WPCT). Though the sample size is small, the trend is clear and has been occurring with ejections for years: Getting thrown out of a ballgame, especially for arguing a replay review, decreases win probability even in the relatively unusual circumstance in which the manager was right, which was the case in less than 30% of the 199 total ejections during the 2014 season.44
CONCLUSION
Baseball’s foray into expanded instant replay review uncovered an entirely new arena for statistical analysis and opened a Pandora’s box for adopting and applying strategy to a part of the game that didn’t even exist prior to 2014. When baseball’s replay committee first considered expanded instant replay, the committee discussed its implementation for “the game-changing play,” with committee member Tony La Russa noting that, “it doesn’t come around all that often.”45 As the 2010 “close call” study and 2014 replay review statistics both confirm, replay will not overturn a call all that often—just once every four games—yet when it does, the positive effect this produces for the benefitting team can be notable, on the order of being associated with 116 additional wins, to 54 losses (WPCT 68.2), as opposed to the additional 53 wins and 108 losses (WPCT 32.9) associated with an unsuccessful replay. With a sample size of 1264 replays, however, significance was diminished by the simple fact that most games in which a team was winning ended up as a win, while most games that a team was already losing ended up as a loss. Replay had an impact on game outcome a minority of the time, and a direct “spicy” impact at a much lower rate.
Whether via manager’s challenge or crew chief initiated review, game outcome correlated with replay result is worse for the replay-loser (affirmed call) and better for the replay-winner (reversed call). The key will continue to be discretion, and reserving challenge usage for situations in which an overturned call is the most likely outcome, which most often occurs during the third inning of a Sunday game on a catch/trap call by the first base umpire.
LINDSAY IMBER is a baseball rules expert and is a member of SABR’s Umpires and Rules Research Committee. She is the founder and chief commissioner of the Umpire Ejection Fantasy League, dedicated to the objective analysis of close and controversial calls in sport with great regard for the rules and spirit of the game.
Notes
1. Ken Davidoff, “MLB to tweak replay system, but managers’ challenges will stay,” New York Post, http://nypost.com/2014/11/21/mlb-to-tweak-replay-system-but-managers-challenges-will-stay/, November 21, 2014 (accessed November 25, 2014).
2. Jack Dickey, “Let’s Review 50 Years of Instant Replay,” TIME, http://ideas.time.com/2013/12/07/lets-review-50-years-of-instant-replay/, December 7, 2013 (accessed November 2, 2014).
3. Chris Erskine, “Tony Verna, TV director who introduced instant replay, dies at 81,” Los Angeles Times, www.latimes.com/local/obituaries/ la-me-tony-verna-20150119-story.html, January 18, 2015 (accessed February 6, 2015).
4. Gary Miles, “The NHL Gives OK to Replays, Reviews to Begin in 1991–92 Season,” Philly.com, http://articles.philly.com/1991-06-25/sports/ 25787282_1_instant-replay-video-replays-nhl-officials, June 25, 1991 (accessed November 6, 2014).
5. Jack Curry, “Baseball to Use Replay Review on Homers,” The New York Times,www.nytimes.com/2008/08/27/sports/baseball/ 27replay.html?_r=0, August 26, 2008 (accessed November 8, 2014).
6. “Bill Klem Quotes,” Baseball Almanac, www.baseball-almanac.com/ quotes/quoklem.shtml (accessed November 25, 2014).
7. Reid Forgrave, “Human element the heart of baseball,” FOX Sports, www.foxsports.com/mlb/story/Baseball-replay-expansion-winter-meetings-heart-of-the-game-120111, May 28, 2014 (accessed January 7, 2015).
8. Cork Gaines, “MLB Games Are Taking Longer Than Ever And The New Replay System Is Making It Worse,” Business Insider, www.businessinsider.com/mlb-games-length-instant-replay-system-2014-4, April 4, 2014 (accessed January 7, 2015).
9. “Marlins’ ‘Replay’ Protest Denied,” Los Angeles Times, June 4, 1999.
10. Associated Press, “MLB approves replay in series that start Thursday,” ESPN, http://articles.philly.com/1991-06-25/sports/25787282_1_ instant-replay-video-replays-nhl-officials, August 27, 2008 (accessed November 8, 2014).
11. Major League Baseball, 2014 Umpire Media Guide, Ed. Michael Teevan and Donald Muller, 90.
12. “AFL Instant Replay: 20% of Challenged Calls Overturned,” Close Call Sports/Umpire Ejection Fantasy League, www.closecallsports.com/2013/11/afl-instant-replay-20-of-challenged.html, November 10, 2013 (accessed November 10, 2014).
13. T.J. Quinn and Willie Weinbaum, “Study shows 1 in 5 close calls wrong,” ESPN, http://sports.espn.go.com/espn/otl/news/story?id=5464015, August 16, 2010 (accessed November 10, 2014).
14. Gil Imber, “Stats Prove MLB Umpires Call 99.5 Percent of Plays Correctly,” Bleacher Report, http://bleacherreport.com/articles/ 911552-defining-the-human-element-mlb-umpires-call-995-of- plays-correctly, October 26, 2011 (accessed November 10, 2014).
15. Paul Hagen, “Expanded replay approved, to begin this season,” MLB.com, http://m.mlb.com/news/article/66737912/mlb-approves-expanded-instant-replay-beginning-with-2014-season, January 16, 2014 (accessed November 15, 2014).
16. “Confirmed: MLB Hires 7 New Umpires to Full-Time Staff,” Close Call Sports/Umpire Ejection Fantasy League, www.closecallsports.com/2014/01/mlb-hires-umpires-baker-blaser-rackley.html, January 14, 2014 (accessed November 15, 2014).
17. Ben Walker, “Replay wizards becoming key positions on MLB teams,” Yahoo! Sports, www.closecallsports.com/2014/01/mlb-hires-umpires-baker-blaser-rackley.html, March 21, 2014 (accessed November 15, 2014).
18. Ken Fidlin, “Blue Jays’ intrasquad game a fine warmup,” Toronto Sun, www.torontosun.com/2014/02/25/blue-jays-intrasquad-game-a-fine-warmup, February 25, 2014 (accessed January 8, 2015).
19. Chris Haft, “Bochy loses challenge, then key opportunity,” MLB.com, http://m.mlb.com/news/article/70668478/the-d-backs-scored-a-run-after-a-call-at-first-was-upheld-after-a-giants-challenge, April 2, 2014 (accessed November 16, 2014).
20. David Brown, “Two replay reviews confirm Indians triple play against Dodgers,” Yahoo! Sports, http://sports.yahoo.com/blogs/big-league-stew/two-replay-reviews-confirm-indians-triple-play-against-dodgers- 144150176.html, July 2, 2014 (accessed November 18, 2014).
21. Steve Gilbert, “Australia series to skip new replay system,” MLB.com, http://m.dbacks.mlb.com/news/article/69150110/australia-series-to-skip-new-replay-system, March 11, 2014 (accessed November 18, 2014).
22. Gil Imber, “Umpire Ejection Fantasy League Portal: Historical Data,” Close Call Sports, http://portal.closecallsports.com/historical-data (accessed November 20, 2014).
23. Although some sources indicate 1275 total replays, one of these plays was not reviewable. On September 20, during the sixth inning of the Tigers-Royals game, the Royals had runners on second and third with one out. The batter hit a line drive that was caught on the fly by Detroit’s second baseman, who threw wildly past second base and into left field. By the end of this play, the Royals baserunner from third base had scored and the runner from second stood at third. Detroit subsequently appealed that the runner from third base failed to timely tag up and, after umpires signaled the runner safe, Detroit attempted to challenge the play. The umpires donned the replay headsets to New York, but were told the play was not reviewable and reconvened on the infield to discuss the sequence amongst themselves, the old-fashioned way. Meanwhile, Kauffman Stadium’s “Crown Vision” video board displayed its own replays of the contentious play, pursuant to MLB’s replay protocol for in-Stadium video. At least one report states that one of the umpires saw the replays on Crown Vision and elected to reverse the call based on this unauthorized video review, which I have not considered an official review—thus the 1274 vs. 1275 discrepancy. For more information, please see “Appeals: The Legalese of Reviewable Base Touching,” Close Call Sports/Umpire Ejection Fantasy League, www.closecallsports.com/ 2014/09/appeals-legalize-of-reviewable-base.html, September 20, 2014 (accessed February 8, 2015).
24. 2428 games / 601 overturned calls = 4.04 games per overturned call. This is very similar to ESPN’s 2010 data referenced in endnotes #13 and 14: 20% of 1.3 calls per game were missed, or 0.26 missed calls per game, which is the equivalent of approximately one missed call for every four games played.
25. 601 overturned calls / 1264 reviews = 47.5% overturn rate; the team average 20 overturned calls / 42 average reviews = 47.6% overturned.
26. “MLB Ejection & Replay Stats: 2014 Season Sabermetrics,” Close Call Sports/Umpire Ejection Fantasy League, www.closecallsports.com/2014/ 09/mlb-ejection-replay-stats-2014-season.html, September 30, 2014 (accessed November 20, 2014).
27. 1B Umpires: 249 affirmed calls/556 replays = .448. 2B Umpires: 173 affirmed calls/349 replays = .496. 3B: 80 affirmed calls/134 replays = .403. HP: 167 affirmed calls/225 replays = .742.
28. Safe/Out: 451 affirmed/954 replays = .473 RAP. HR/Not HR: 71/97 = .732. Rule 7.13: 79/92 = .859. HBP/Foul: 24/46 = .522. Catch/Trap: 5/21 = .238. Fair/Foul: 14/21 = .667. Catch/No-Catch: 3/9 = .333. Ground Rule/Not HR Boundary: 6/9 = .667. Base Touch: 4/5 = .800. Other Fan Interference: 1/4 = .225. Time Play: 2/3 = .667…
29. “MLB Hires Tripp Gibson, Mark Ripperger, Will Little,” Close Call Sports/ Umpire Ejection Fantasy League, www.closecallsports.com/2015/01/ mlb-hires-hw-grads-tripp-gibson-and.html, January 11, 2015 (accessed January 12, 2015).
30. “Report: Four first-time Series umps,” The Associated Press & ESPN, http://espn.go.com/mlb/playoffs/2014/story/_/id/11715511/ four-umpires-get-first-world-series-call, October 17, 2014 (accessed January 12, 2015).
31. W/L pre-of 241-260-162 became a W/L final of 295-368, or .445 winning average. The added 53 wins and 108 losses produced a winning average of just .329.
32. “Replay Impacts,” ReplayOMeter, www.replayometer.com/impacts (accessed January 12, 2015).
33. “FAQ,” ReplayOMeter, www.replayometer.com/faq (accessed January 12, 2015).
34. “Tigers @ Rays,” MLB Advanced Media, http://mlb.mlb.com/mlb/ gameday/index.jsp?gid=2014_08_19_detmlb_tbamlb_1&mode=plays, August 19, 2014 (accessed January 14, 2015).
35. For innings #1-3, 200 overturned calls/342 replays = .585. For innings #4-6, 199 overturned calls/401 replays = .496. For innings #7+, 202 overturned calls/521 replays = .388.
36. For innings #1-3, 187 overturned calls/275 replays = .680. For innings #4-6, 184 overturned calls/340 replays = .541. For innings #7+, 185 overturned calls/445 replays = .416.
37. Sunday: 102/179 = .570. Monday: 54/119 = .454. Tuesday: 69/141 = .489. Wednesday: 83/164 = .506. Thursday: 59/114 = .518. Friday: 88/160 = .550. Saturday: 99/176 = .563.
38. “Replays by Month,” ReplayOMeter, www.replayometer.com/months (accessed January 12, 2015).
39. “Lighting for High Speed,” Love High Speed, www.lovehighspeed.com/ lighting-for-high-speed/ (accessed November 25, 2014).
40. Rick Hummel, “La Russa says expanded replay is ‘remarkably effective,’” St. Louis Post-Dispatch, www.stltoday.com/sports/baseball/professional/ la-russa-says-expanded-replay-is-remarkably-effective/article_ d4c4d76e-08c0-5188-aae1-e0a5affa51b8.html, April 27, 2014 (accessed November 20, 2014).
41. 601 overturned / 1264 total calls = .475 TSP.
42. Derrick Goold, “Dodgers drub Cards, Lynn,” St. Louis Post-Dispatch, www.stltoday.com/sports/baseball/professional/cardinal-beat/dodgers-drub-cards-lynn/article_d3968561-e404-5f03-8de1-7efdcf241657.html, June 28, 2014 (accessed January 14, 2015).
43. Tom Gatto, “MLB says it wants faster games; here’s what it can do,” The Sporting News, www.sportingnews.com/mlb/story/2014-09-23/ bud-selig-pace-of-game-baseball-mlb-long-games-3-hours-replay, September 23, 2014 (accessed November 20, 2014).
44. Gil Imber, “Umpire Ejection Fantasy League Portal: Historical Data,” Close Call Sports, http://portal.closecallsports.com/historical-data (accessed November 20, 2014).
45. Tyler Kepner, “Baseball’s Expanded Replay Adds to Managerial Strategy,” The New York Times, www.nytimes.com/2014/01/17/sports/baseball/ major-league-baseball-adopts-expanded-video-review.html?_r=0, January 16, 2014 (accessed November 20, 2014).