

Ron Hunt, Coco Crisp, and the Normalization of Hit-by-Pitch Statistics
This article was written by Gary Belleville
This article was published in Fall 2018 Baseball Research Journal
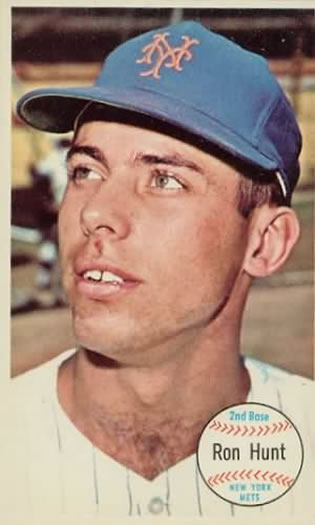 It’s a basic rule that’s familiar to all baseball fans: A batter, when struck by a pitched ball, shall be awarded first base. While some people may dismiss the hit-by-pitch as a relatively minor aspect of the game, a hit batsman can have significant consequences. As an extreme example, the Tommy Byrne pitch that struck the foot of Nippy Jones in the 10th inning of Game Four of the 1957 World Series ignited a thrilling come-from-behind rally by the Milwaukee Braves, and it is generally regarded as the turning point of the series. Certain batters, such as the indomitable Ron Hunt, intentionally used the hit-by-pitch on a regular basis to boost their on-base percentage; in Hunt’s case, his HBP prowess helped prop up a faltering career, extending his time in the big leagues by several years.
Aside from Hunt, many other batters throughout baseball history have routinely used the hit-by-pitch as an offensive weapon. This brings up an obvious question: Who was the best of all time at reaching base on an HBP? Previous research on this topic has relied on rudimentary statistics, such as the total number of hit-by-pitches in a season or career. While these traditional measures do provide some insight, their inherent drawbacks limit their usefulness. This article will briefly outline these deficiencies and introduce a new and improved metric for effectively comparing hit-by-pitch statistics of players, including those from different eras. This metric will then be used to identify the players who employed the hit-by-pitch to their greatest (or least) advantage. A discussion section of this paper will focus on the most noteworthy performances identified and describe some of the reasons why those players stood out so much from their peers.
DEVISING A NEW HBP METRIC
One obvious drawback with simply comparing players based on their HBP totals is that those figures do not factor in how many opportunities each player had to get plunked. Even among the group of players with enough plate appearances to qualify for the batting title in a given season, there may be some players with roughly 50 percent more plate appearances than others. Effectively comparing career HBP totals is even more problematic using these traditional methods, since some players may enjoy 20-year careers (or more), while others may be forced to retire after only a dozen or so years in the major leagues.1 Clearly, the formula devised for an improved HBP metric must include the total number of plate appearances.
Another significant issue that limits the effectiveness of using raw HBP totals to compare players from different eras is the fact that hit-by-pitch rates have varied significantly over the years, as shown in Figure 1. The graph, which was generated from statistics in the Lahman Baseball Database, demonstrates that hit-by-pitch rates have ebbed and flowed throughout baseball history, from an all-time high of 1.24 percent of all plate appearances in 1899 to a low of 0.32 percent in 1941.2
Figure 1. HBP Percentage per Plate Appearance.
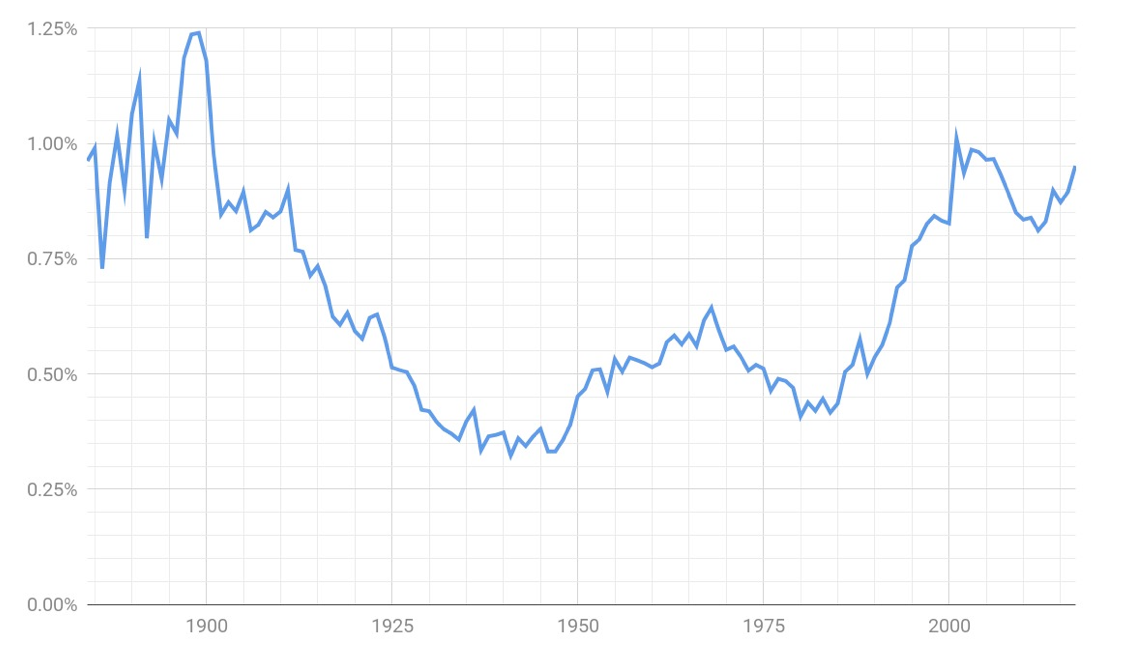
Yearly rates combined for the American Association (1884–91), National League (1887–2017), Players League (1890), American League (1901–2017), and Federal League (1914–15).
Since HBP rates have fluctuated so dramatically over the years, simply dividing the number of hit-by-pitches by the number of plate appearances to calculate a HBP average wouldn’t be sufficient to effectively compare HBP statistics across the different eras. For instance, a batter getting hit in 5 percent of his plate appearances in 1941 would be far more significant than someone being plunked at the exact same rate in 2001, when hit batsmen were roughly three times more common. A better approach would be to devise a metric that also adjusts for the HBP rate of the corresponding season.
However, a closer look at the numbers shows that there are many seasons in which the individual leagues have had significantly different HBP rates. For example, the American League HBP rate in 1909 was roughly 40 percent higher than the corresponding National League rate. Conversely, the senior circuit’s HBP rate was 21 percent greater than in the American League in 2013.
Figure 2. HBP Percentage per Plate Appearance.
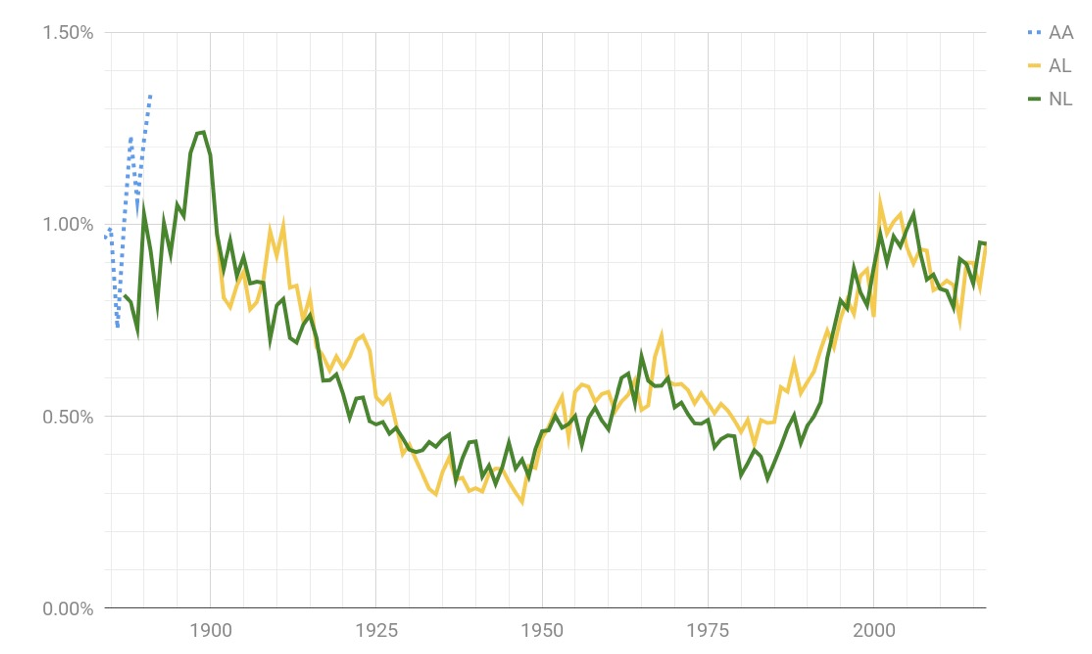
Data shown for the American Association (1884–91), National League (1887–2017), and American League (1901–2017). Data for the Players League (1890) and Federal League (1914–15) are not shown due to legibility issues.
Due to the disparate HBP rates of the individual leagues, the proposed metric will adjust for the hit-by-pitch rate of the corresponding league and season instead of using a combined rate for all leagues. This will allow players to be compared relative to their league peers rather than those who may have played under markedly different conditions (e.g. opposing pitchers, fastball usage rates, and umpire strike-zone interpretations that may alter the percentage of pitches delivered high in the zone).
METHODOLOGY
Adjusted HBP, also known as HBP+, will be used to normalize hit-by-pitch numbers across leagues and seasons. Single-season HBP+ numbers can be calculated for a player using the following formula:
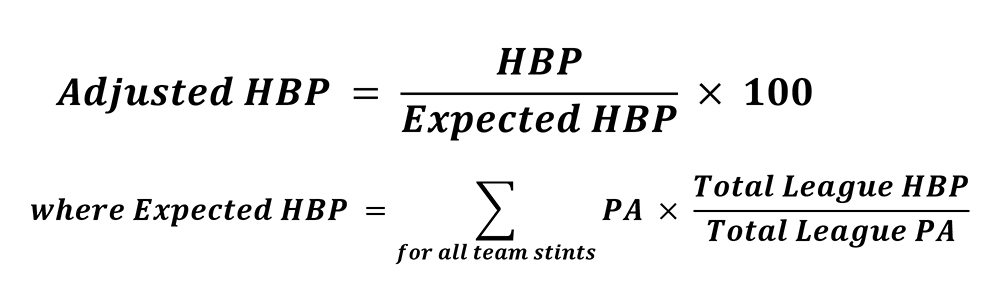
This formula adjusts HBP numbers so that players who get hit with pitches at the same rate as the league average will have an HBP+ of 100. Players who are struck twice as often as league average will have an HBP+ of 200, and those who are hit at half of the league rate will have an HBP+ of 50.
Career HBP+ numbers can be calculated for a player using a similar formula:

Please note that Expected HBP is calculated as per the single-season HBP+ formula.
DATA ANALYSES
Data were downloaded from the Lahman Baseball Database and loaded into an Oracle database.3 The author wrote several SQL queries to produce the data for the tables and figures in this article.
The Lahman Baseball Database contains complete hit-by-pitch data for the following leagues/seasons: American Association (1884–91), National League (1887–2017), Players League (1890), American League (1901–2017), and Federal League (1914–15). Batting data from other seasons and leagues were excluded from the SQL queries.
DISCUSSION
Single-Season HBP Leaders (Traditional Metric)
Before we turn our attention to the single-season HBP+ leaders, let’s take a brief look at the top marks in our traditional metric, the total number of hit-by-pitches in a season, as shown in Table 1.
The list is dominated by Baltimore Orioles from the 1890s such as Hughie Jennings, Dan McGann, and Curt Welch. The Orioles of that era were a juggernaut, winning three consecutive National League pennants from 1894 to 1896 using an aggressive brand of small ball. The architect and manager of those teams, Ned Hanlon, was a strong proponent of using the hit-by-pitch as an offensive weapon, and his clubs led the National League in hit-by-pitches for seven consecutive seasons: the 1894–98 Orioles and the 1899–1900 Brooklyn Superbas.4 The hit batsmen on Hanlon’s squads peaked in 1898, when the Orioles were plunked an astounding 160 times in 154 games, more than the combined total of the St. Louis Browns and Pittsburgh Pirates, who finished second and third in hit-by-pitches respectively.
Table 1. Single-season HBP leaders
|
Player |
Year |
Team(s) |
HBPs |
|
Hughie Jennings |
1896 |
Baltimore Orioles |
51 |
|
Ron Hunt |
1971 |
Montreal Expos |
50 |
|
Hughie Jennings |
1897 |
Baltimore Orioles |
46 |
|
Hughie Jennings |
1898 |
Baltimore Orioles |
46 |
|
Dan McGann |
1898 |
Baltimore Orioles |
39 |
|
Dan McGann |
1899 |
Brooklyn Superbas, Washington Senators |
37 |
|
Curt Welch |
1891 |
Baltimore Orioles |
36 |
|
Don Baylor |
1986 |
Boston Red Sox |
35 |
|
Curt Welch |
1890 |
Athletics (Phila.), Baltimore Orioles |
34 |
|
Craig Biggio |
1997 |
Houston Astros |
34 |
|
Tommy Tucker |
1889 |
Baltimore Orioles |
33 |
|
Hughie Jennings |
1895 |
Baltimore Orioles |
32 |
|
Brandon Guyer |
2016 |
Tampa Bay Rays, Cleveland Indians |
31 |
|
Jason Kendall |
1997 |
Pittsburgh Pirates |
31 |
|
Jason Kendall |
1998 |
Pittsburgh Pirates |
31 |
|
Steve Evans |
1910 |
St. Louis Cardinals |
31 |
|
Anthony Rizzo |
2015 |
Chicago Cubs |
30 |
|
Craig Wilson |
2004 |
Pittsburgh Pirates |
30 |
|
Chief Roseman |
1890 |
St. Louis Browns, Louisville Colonels |
29 |
|
Tommy Tucker |
1891 |
Boston Beaneaters |
29 |
|
Tommy Tucker |
1887 |
Baltimore Orioles |
29 |
|
Curt Welch |
1888 |
Philadelphia Athletics |
29 |
Single-Season HBP+ Leaders
Calculating the single-season HBP+ leaders across baseball history produces quite a different list than using the traditional metric. These rather eye-popping results can be found in Table 2. Not only does Hunt hold the top two spots of all time and five of the top 15 entries, but his 1971 season surpasses all others by an exceedingly wide margin. That year, Hunt was hit by a pitch almost 15 times more frequently than a league-average batter. To put that figure in perspective, to surpass the league-average home-run rate by a similar multiple, he would have had to have slugged a whopping 175 home runs in 1971, a season in which Willie Stargell led the National League with 48 round-trippers. Of course, Hunt was anything but a power hitter; the slap hitter spent most of his career batting leadoff or second in the order, and he was clever enough to understand his limitations and use every tool at his disposal to get on base, including intentionally getting in the way of a pitch.5
Hunt was quite open about his hit-by-pitch techniques. “First, I would blouse the uniform—this big, wool uniform, I would make sure it was nice and loose,” he recalled in a 2015 interview. “Then I’d choke way up on the bat and stand right on top of the plate. That way, I could still reach the outside pitch. That was the Gil Hodges philosophy on hitting: The two inches on the outside corner were the pitcher’s, the rest was his. I thought, ‘If I can take away those two inches, and he’s not perfect, I can put the ball in play and get some hits. And if he comes inside, I can get on base that way, too.’”6
Rule 5.05(b)(2) of the Official Baseball Rules clearly states that a batter hit by a pitched ball is not entitled to first base when “the batter makes no attempt to avoid being touched by the ball.” To get around this stipulation, Hunt developed a spin move to help deceive the plate umpire. “The ball would be headed toward his elbow or his ribcage,” said Dave Van Horne, the longtime Montreal Expos broadcaster. “He would turn his back away from the pitcher and deflect the ball with that spin move, so that he avoided those direct hits. To the average person, it would look like he was trying to get out of the way of the pitch, when, in fact, he just wanted to stand in there and take it.”7
Another aspect that may have boosted Hunt’s hit-by-pitch totals was the fact that the feisty player was almost universally disliked by both opponents and teammates.8 He had a mean streak and a short temper, and he was not averse to resorting to fisticuffs on the field.9 One habit that didn’t exactly endear Hunt to other players in the league was his routine of picking up the ball after getting plunked and casually flipping it back to the pitcher in an act of defiance. One opponent, San Diego Padres catcher Bob Barton, took exception to Hunt’s attempt to return the ball to pitcher Steve Arlin after he got plunked in consecutive at-bats in an August 1971 game, which led to Hunt yanking off Barton’s mask and punching him in the face. The benches emptied, and when order was restored, Hunt was the only player ejected from the game.10
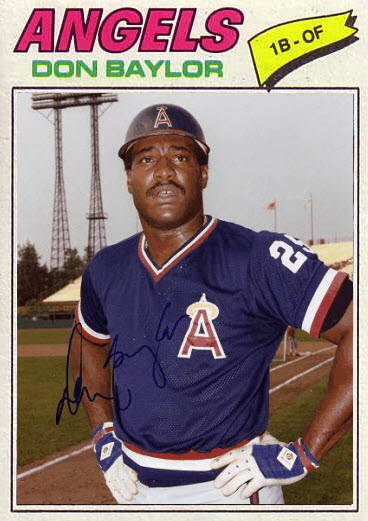 While Hunt was an average hitter who used the hit-by-pitch to help extend a middle-of-the-road career, the same cannot be said of Don Baylor. In a stellar 19-year career, Baylor slugged 338 home runs, won the Silver Slugger award three times, and was named the American League MVP in 1979. He was also quite happy to stand in the batter’s box and let pitches hit him. Not only did he lead the American League in HBPs in eight different seasons, but in a three-year period from 1984 to ’86, Baylor posted three of the top five single-season HBP+ marks in history, getting hit almost nine times more often than his American League peers. “My first goal when I go to the plate is to get a hit,” he said in a 1987 interview. “My second goal is to get hit.”11
The primary reason Baylor was hit so often was that he crowded the plate. “When the ball is inside, I don’t back away,” he said. “Common sense says back away, but I guess common sense isn’t that common. I just stiffen up and take the blow.”12 Baylor had a stubborn streak and he refused to be intimidated by the opposing pitcher. “There was always that confrontation,” he said. “You’re not going to beat me, and I’m not going to give in. I’m going to be right here. If you hit me, I’m coming right back again. I’m going to be right on the plate and you’re not going to move me off the plate.”13
Other than Hunt and Baylor, the only name that appears more than twice on the single-season HBP+ leaders in Table 2 is Chet Lemon, the Detroit Tigers and Chicago White Sox center fielder who was known for both his outstanding fielding and potent bat. Lemon’s raw HBP numbers from 1981 to ’83 may be rather modest, but they were partially masked by a moderate number of plate appearances and the fact that he played at a time of relatively low HBP rates. Although he led the American League in hit-by-pitches four times, Lemon spent most of his career in Baylor’s HBP shadow, and he is not particularly well known as an HBP specialist by baseball fans today. Like Baylor, Lemon stood almost on top of the plate. “I actually didn’t mind being pitched inside, I wanted to be pitched inside,” he said. “I felt I could always turn on pitches. If you look at my hits, like all those doubles, I think you’ll find that I went down the left-field line in most of them.”14
Table 2. Single-season HBP+ leaders (min. 3.1 PAs per team game)
|
Player |
Year |
Team(s) |
HBPs |
HBP+ |
|
Ron Hunt |
1971 |
Montreal Expos |
50 |
1,463 |
|
Ron Hunt |
1972 |
Montreal Expos |
26 |
968 |
|
Don Baylor |
1986 |
Boston Red Sox |
35 |
885 |
|
Don Baylor |
1985 |
New York Yankees |
24 |
878 |
|
Don Baylor |
1984 |
New York Yankees |
23 |
854 |
|
Hughie Jennings |
1896 |
Baltimore Orioles |
51 |
829 |
|
Ron Hunt |
1969 |
San Francisco Giants |
25 |
733 |
|
Mike Macfarlane |
1994* |
Kansas City Royals |
18 |
716 |
|
Hughie Jennings |
1897 |
Baltimore Orioles |
46 |
713 |
|
Chet Lemon |
1983 |
Detroit Tigers |
20 |
712 |
|
Frank Robinson |
1956 |
Cincinnati Redlegs |
20 |
704 |
|
Chet Lemon |
1981* |
Chicago White Sox |
13 |
692 |
|
Chet Lemon |
1982 |
Detroit Tigers |
15 |
685 |
|
Ron Hunt |
1968 |
San Francisco Giants |
25 |
663 |
|
Ron Hunt |
1974 |
Montreal Expos, St. Louis Cardinals |
16 |
649 |
|
Steve Evans |
1910 |
St. Louis Cardinals |
31 |
627 |
|
Carlton Fisk |
1981* |
Chicago White Sox |
12 |
621 |
|
Jason Kendall |
1997 |
Pittsburgh Pirates |
31 |
612 |
|
Jimmy Dykes |
1933 |
Chicago White Sox |
12 |
603 |
|
Jason Kendall |
1998 |
Pittsburgh Pirates |
31 |
601 |
* Strike-shortened season.
Career HBP leaders (traditional metric)
Table 3 contains a list of the career hit-by-pitch leaders. Hall of Fame shortstop Hughie Jennings holds the record with 287, while Biggio, another Hall of Famer, is in second with 285 during his 20 seasons with the Houston Astros. As expected, the career leaders in this traditional metric are dominated by batters who played in an era of relatively high HBP rates and/or those who enjoyed lengthy careers.
Table 3. Career HBP leaders
|
Player |
Years Active |
HBPs |
|
Hughie Jennings |
1891–1903, 1907, 1909–10, 1912, 1918 |
287 |
|
Craig Biggio |
1988–2007 |
285 |
|
Tommy Tucker |
1887–99 |
272 |
|
Don Baylor |
1970–88 |
267 |
|
Jason Kendall |
1996–2010 |
254 |
|
Ron Hunt |
1963–74 |
243 |
|
Dan McGann |
1896, 1898–1908 |
230 |
|
Chase Utley* |
2003–17 |
199 |
|
Frank Robinson |
1956–76 |
198 |
|
Minnie Miñoso |
1949, 1951–64, 1976, 1980 |
192 |
|
Jake Beckley |
1888–1907 |
183 |
|
Jason Giambi |
1995–2014 |
180 |
|
Andres Galarraga |
1985–98, 2000–04 |
178 |
|
Alex Rodriguez |
1994–2013, 2015–16 |
176 |
|
Curt Welch |
1884–93 |
173 |
|
Carlos Delgado |
1993–2009 |
172 |
|
Derek Jeter |
1995–2014 |
170 |
|
Kid Elberfeld |
1898–99, 1901–11, 1914 |
165 |
|
Fernando Viña |
1993–2004 |
157 |
|
Fred Clarke |
1894–1911, 1913–15 |
154 |
|
Brady Anderson |
1988–2002 |
154 |
* Active as of 2018.
Career HBP+ leaders
 Table 4 contains a tally of the top 20 hitters in career HBP+ and, not surprisingly, Hunt appears in the top spot. Although his career HBP+ of 713 is still comfortably ahead of Baylor’s 550, the figure is considerably lower than Hunt’s peak single-season numbers. In his first five years in the major leagues, Hunt “only” registered an HPB+ of 372, but his use of the hit-by-pitch as an on-base tool really kicked into gear following his trade to the San Francisco Giants just prior to the 1968 season.15 From that point on, Hunt led the National League in hit-by-pitches every year for the rest of his career, posting an HBP+ of 941 in those seven bruising seasons.
Jennings holds the third-best career HBP+ at 477. In the five-year period 1894–98, he was hit by a stunning 202 pitches, a figure that represents over 70 percent of his career total. Jennings also stood extremely close to home plate when he batted. “Hughie had a way of riding the plate, standing up as close as he could get and shoving his body out over it,” said his Orioles teammate Jack Doyle.16 While some may dismiss the hit-by-pitch statistics from this rough-and-tumble era, the achievements of Jennings, along with McGann, Tommy Tucker, and Kid Elberfeld, should not be minimized. For instance, if one excludes the batters on Hanlon’s Orioles, the HBP rate for the rest of the league was 1.1 percent of all plate appearances in 1898, which is not that much different from the HBP rate in the American League in 2001 (1.05) or the National League in 2006 (1.03).
Aside from the trio of Hunt, Baylor, and Jennings, both Frankie Crosetti and Minnie Miñoso merit special mention as being head and shoulders above all others in career HBP+. Crosetti, a player and coach with the New York Yankees for 37 seasons, led the American League in hit-by-pitches eight times, including 1942, when he appeared in a mere 74 games. Crosetti was proud of his hit-by-pitch accomplishments, which were made possible by one of his coaches, Art Fletcher, who taught him the art of avoiding injury while getting hit.17 Fletcher, ranked 11th overall in career HBP+, had an opportunity to perfect that technique years earlier as a member of the New York Giants, a team managed by the former third baseman of those pugnacious Orioles of the 1890s, John McGraw.
As baseball’s first Latin American superstar, Minnie Miñoso possessed a lethal combination of speed and power. Miñoso, along with Willie Mays, helped reintroduce speed as an offensive weapon in the 1950s, and in addition to his other talents, he led the American League in hit-by-pitches a record 10 times. Like most other HBP+ leaders, Miñoso crowded the plate, and he was not opposed to leaning into a pitch to “steal first.”18 He was also fearless in the batter’s box; after having his skull fractured on a pitch from Bob Grim in 1955 that hit him above the left eye, he bounced back and hit better than ever upon his return.19
When Miñoso broke in with the Cleveland Indians in 1949, he became only the eighth openly black player in major-league history, a mere two years after Jackie Robinson broke the color barrier. In April 1951, he was traded to the White Sox, making the Cuban native the first black player on either of Chicago’s MLB teams. Much like the seven black players before him, Miñoso endured discrimination and segregation, although he also had to deal with language and cultural issues that the others did not. Years later, Orlando Cepeda would refer to Miñoso as “the Jackie Robinson of Latino players.”20 “He was everybody’s hero,” Cepeda reminisced. “I wanted to be Miñoso. [Roberto] Clemente wanted to be Miñoso.”21
Racism may have contributed to Miñoso’s elevated hit-by-pitch rate, a subject he broached in a 2015 interview, mere days before he passed away suddenly. “What was I doing wrong in the game, that they’d purposefully want to hit me? They didn’t do it because I’m nice-looking, and I didn’t do it to get the record. I crowded the plate, because if you only have to look middle-outside, you can kill a pitcher, and if it’s outside it’s a ball,” he said. “My father and my mother taught me there was a way to pay somebody back if they tried to break your arm or break your face: Pay them back on the field with a smile on your face.”22
Biggio holds the modern-day high for the most career hit-by-pitches, so it is a bit of a surprise to see him only ranked 20th in career HBP+. However, he did make 12,504 plate appearances during his lengthy career, much of which was played at a time of relatively high HBP rates.23 Fans looking for a relatively recent example of a HBP machine would be wise to refer to Jason Kendall, the rugged catcher who played most of his career with the Pirates. Not only did Kendall place well ahead of Biggio with a career HBP+ of 327, but he is the only player since 1900 to have been hit by 30 or more pitches twice in a season (as of the end of 2017). Two other twenty-first century players, Rickie Weeks and Andres Galarraga, also rank higher than Biggio in career HBP+.
Table 4. Career HBP+ leaders (min. 5,000 PAs)
|
Player |
Years Active |
HBPs |
HBP+ |
|
Ron Hunt |
1963–74 |
243 |
712.8 |
|
Don Baylor |
1970–88 |
267 |
549.7 |
|
Hughie Jennings |
1891–1903, 1907, 1909–10, 1912, 1918 |
287 |
477.3 |
|
Frankie Crosetti |
1932–48 |
114 |
468.0 |
|
Minnie Miñoso |
1949, 1951–64, 1976, 1980 |
192 |
464.5 |
|
Dan McGann |
1896, 1898–1908 |
230 |
385.1 |
|
Chet Lemon |
1975–90 |
151 |
369.7 |
|
Sherm Lollar |
1946–63 |
115 |
357.4 |
|
Tommy Tucker |
1887–99 |
272 |
356.9 |
|
Kid Elberfeld |
1898–99, 1901–11, 1914 |
165 |
352.5 |
|
Art Fletcher |
1909–20, 1922 |
141 |
350.7 |
|
Gene Tenace |
1969–83 |
91 |
337.4 |
|
Lonnie Smith |
1978–94 |
92 |
336.7 |
|
Jason Kendall |
1996–2010 |
254 |
327.1 |
|
Frank Robinson |
1956–76 |
198 |
303.7 |
|
Frank Chance |
1898–1914 |
137 |
298.0 |
|
Rickie Weeks |
2003, 2005–17 |
134 |
296.1 |
|
Andres Galarraga |
1985–98, 2000–04 |
178 |
291.7 |
|
Bucky Harris |
1919–29, 1931 |
99 |
290.0 |
|
Craig Biggio |
1988–2007 |
285 |
287.9 |
Career HBP+ laggards
If Hunt was the most distinguished hitter at reaching first base on a hit-by-pitch, then who was plunked the least often compared to his peers? The answer to that question can be found in Table 5, which lists the batters with the lowest career HBP+ in baseball history.
Coco Crisp, who was hit only five times in his 15 years in the big leagues, holds the distinction of having the lowest career HBP+ for players with more than 5,000 plate appearances. His HBP+ of 8.4 means that he was hit with a pitch roughly 12 times less often than his contemporaries. There are several reasons why Crisp was hit so infrequently, starting with the structural advantage of being a switch-hitter, which means that he was always batting against an opposite-handed pitcher. Due to typical pitch trajectories, hurlers hit opposite-handed batters significantly less often than they do same-handed hitters.24
However, the fact that Crisp hit from both sides of the plate doesn’t explain why he was struck by pitches so much less frequently than other switch-hitters in the American League. Crisp, an agile center fielder, also had a willingness to scoot out of the way of inside pitches, and a video review of a half-dozen examples from 2012 to 2016 of extreme inside pitches that he successfully dodged shows his quickness and dexterity at work.25 However, perhaps the most significant reason for his extremely low HBP+ is the fact that the book on Crisp was to feed him a steady diet of outside pitches. An analysis of PITCHf/x data from the last 10 years of his career shows that only 22 percent of pitches thrown to him were on the inner third of the plate or further inside.26
One of the more obscure players listed in Table 5 is Bones Ely, who at 6-foot-1 was the tallest man to play shortstop regularly in the big leagues during the nineteenth century.27 The steady-fielding Ely was 155 pounds soaking wet, so his low HBP numbers could at least be partially chalked up to self-preservation. A controversial figure throughout his career, he was let go by the Pirates during the 1901 season on suspicion of recruiting players to join the upstart American League. Ely’s release led the way for Honus Wagner to be converted from an outfielder to a shortstop, a move the 27-year-old Wagner was initially hesitant to make due to Ely’s popularity with Pittsburgh fans.28
Table 5. Lowest career HBP+ (min. 5,000 PAs)
|
Player |
Years Active |
HBP |
HBP+ |
|
Coco Crisp |
2002–16 |
5 |
8.4 |
|
Garret Anderson |
1994–2010 |
8 |
9.7 |
|
José Cruz Jr. |
1997–2008 |
5 |
9.9 |
|
Sandy Alomar |
1964–78 |
3 |
10.1 |
|
Ruben Sierra |
1986–98, 2000–06 |
7 |
11.0 |
|
Otis Nixon |
1983–99 |
5 |
13.0 |
|
Neifi Pérez |
1996–2007 |
7 |
13.9 |
|
Ozzie Guillén |
1985–2000 |
7 |
15.0 |
|
José Reyes* |
2003–17 |
11 |
15.4 |
|
Lance Johnson |
1987–2000 |
7 |
16.9 |
|
Jim Hegan |
1941–42, 1946–60 |
4 |
17.0 |
|
Jerry Mumphrey |
1974–88 |
4 |
17.2 |
|
Joe Tinker |
1902–16 |
10 |
17.3 |
|
Luis Castillo |
1996–2010 |
12 |
17.8 |
|
Bones Ely |
1884, 1886, 1890–91, 1893–1902 |
11 |
18.2 |
|
José Cruz |
1970–88 |
7 |
18.4 |
|
Chipper Jones |
1993, 1995–2012 |
18 |
19.3 |
|
Sam West |
1927–42 |
5 |
19.8 |
|
Pete O’Brien |
1982–93 |
7 |
20.0 |
|
Rollie Hemsley |
1928–44, 1946–47 |
4 |
20.3 |
* Active as of 2018.
CONCLUSIONS
By factoring in the number of plate appearances and the league-wide HBP rate, the HBP+ metric provides an effective means of comparing hit-by-pitch numbers of players from different eras.
Although the HBP rates in the late nineteenth century were the highest ever recorded, the hit-by-pitch accomplishments of players of that era should not be downplayed. Ned Hanlon’s Baltimore Orioles and Brooklyn Superbas were among the first teams to use the HBP as an offensive weapon, and his club skewed the hit-by-pitch rates of the entire National League for several seasons. Of all of Hanlon’s batters, none were as proficient at leveraging the hit-by-pitch as Hughie Jennings, although Dan McGann was also among the very best of all time at taking one for the team. In addition, two other nineteenth-century ballplayers, Tommy Tucker and Kid Elberfeld, appear in the top 10 for career HBP+.
When viewed through an HBP+ lens, Ron Hunt’s modern-day record of 50 HBPs in 1971 stands out as one of the most impressive single-season records in baseball history. His feat represents an HBP+ of 1,463, which means that he was plunked at a rate that was almost 15 times greater than his National League peers that season. His career HBP+ of 713 easily surpasses all others, a clear indication that Hunt is worthy of being referred to as baseball’s all-time HBP king. Perhaps the Montreal Expos press guide summed it up best with its cheeky assessment of Hunt: “He gets good flesh on the ball,” it said.29
Aside from Hunt, nobody had a penchant for getting hit with a pitch like Don Baylor. Between 1984 and 1986, Baylor notched an HBP+ of 854 or greater, giving him three of the top five single-season marks. By a comfortable margin, his career HBP+ of 550 is the second best of all time. Chet Lemon, whose hit-by-pitch skills were overshadowed by Baylor in the 1980s, quietly posted exceptional HBP numbers. Lemon ranks seventh all time with a career HBP+ of 370.
Hughie Jennings, Frankie Crosetti, and Minnie Miñoso put up equally impressive career HBP+ numbers despite playing under considerably different conditions. While the trio is well behind Hunt and Baylor in career HBP+, they are still significantly ahead of all other major-leaguers.
In recent years, no batter had a better knack for reaching first base on a hit-by-pitch than Jason Kendall. Other players from the early part of the twenty-first century with a similar aptitude include Rickie Weeks, Andres Galarraga, and Craig Biggio.
GARY BELLEVILLE is a retired Information Technology professional living in Victoria, British Columbia. He spent seven years as an editor and lead writer for baseball blogs devoted to local independent league and college wood-bat teams. Gary served as an official scorer in the West Coast League for two seasons, and he worked for the Asheville Tourists in the South Atlantic League. He grew up in Ottawa and graduated from the University of Waterloo with a Bachelor of Mathematics (Computer Science) degree. He patiently awaits the return of his beloved Montreal Expos.
Notes
1 This paper will use a similar approach as The SABR Baseball List and Record Book and only consider players with at least 5,000 plate appearances for the list of career leaders in the new HBP metric. Single-season leaders will require at least 3.1 plate appearances per team game. Society for American Baseball Research, The SABR Baseball List and Record Book (New York: Scribner, 2007).
2 This paper does not offer opinions on why HBP rates have fluctuated across the different eras of baseball history. While that topic may be of interest to some and it may be the subject of further research, this article will focus on the development of an improved HBP metric and the resulting insights from reviewing the all-time leaders in this metric.
3 Lahman Baseball Database, March 31, 2018, http://www.seanlahman.com/baseball-archive/statistics/.
4 Jack Smiles, ”Ee-Yah”: The Life and Times of Hughie Jennings, Baseball Hall of Famer, (Jefferson, NC: McFarland, 2005), 48.
5 Jonah Keri, “The Year Ron Hunt Got Hit By 50 Pitches,” FiveThirtyEight, February 3, 2015, https://fivethirtyeight.com/features/the-year-ron-hunt-got-hit-by-50-pitches/.
6 Keri.
7 Keri.
8 Bill James, The New Bill James Historical Baseball Abstract, (New York: Free Press, 2001), 520.
9 Keri, “The Year Ron Hunt Got Hit By 50 Pitches.”
10 Keri.
11 Jack Friedman, “For Don Baylor, Baseball Is a Hit or Be Hit Proposition,” People, August 24, 1987, https://people.com/archive/for-don-baylor-baseball-is-a-hit-or-be-hit-proposition-vol-28-no-8/.
12 Friedman.
13 Jose De Jesus Ortiz, “Don Baylor brings rugged style back to game,” Houston Chronicle, March 28, 2004, https://www.chron.com/sports/astros/article/Baseball-Notebook-Don-Baylor-brings-rugged-style-1959380.php.
14 Mark Liptak, “Flashing Back . . . with Chet Lemon,” White Sox Interactive, ND, http://www.whitesoxinteractive.com/rwas/index.php?category=11&id=2719.
15 Benjamin Pomerance, “Where Are They Now: Ron Hunt,” Baseball Savvy, January 14, 2011, http://www.baseballsavvy.com/w_hunt.html.
16 Smiles, ”Ee-Yah,” 79.
17 Tara Krieger, “Frankie Crosetti,” SABR BioProject, https://sabr.org/bioproj/person/460d26a7.
18 Mark Stewart, “Minnie Minoso,” SABR BioProject, https://sabr.org/bioproj/person/796bd066.
19 Larry Moffi and Jonathan Kronstadt, Crossing the Line: Black Major Leaguers, 1947–1959, (Lincoln, NE: University of Nebraska Press, 2006), 43.
20 Jay Jaffe, “Baseball pioneer and seven-time MLB All-Star Minnie Minoso dies,” Sports Illustrated, March 1, 2015, https://www.si.com/mlb/2015/03/01/minnie-minoso-chicago-white-sox-cubs-mlb-cuban-obituary.
21 Los Angeles Times, “Minnie Minoso dies; Chicago’s first black big-league baseball player,” March 1, 2015, http://www.latimes.com/local/obituaries/la-me-minnie-minoso-20150302-story.html.
22 Christina Kahrl, “’If Jackie Could Make It, I Could Too,’” ESPN.com, http://www.espn.com/mlb/story/_/page/blackhistoryMLBminoso/white-sox-great-minnie-minoso-integration-fan-appreciation-cuba-hof-slight.
23 As of the beginning of the 2018 season, Craig Biggio ranked 11th in baseball history with 12,504 career plate appearances. Biggio’s 34 HBP in 1997 translates into an HBP+ of 516; although that was the highest single-season HBP+ mark of his career, it was still well out of the top 20 of all time due to his extraordinary 744 plate appearances and a robust league-wide HBP rate of 0.88 percent.
24 Mike Fast, “Spinning Yarn: Why are Batters Hit by Pitches?” Baseball Prospectus, August 17, 2011, https://www.baseballprospectus.com/news/article/14807/spinning-yarn-why-are-batters-hit-by-pitches/.
25 Neil Weinberg, “The Man Who Hasn’t Been Hit in Almost Six Years,” Fangraphs, January 13, 2017, https://www.fangraphs.com/blogs/the-man-who-hasnt-been-hit-in-almost-six-years/.
26 The PITCHf/x data was extracted from the two 5×5 heat maps (from both the right and left sides of the plate) for the 2007 to 2016 seasons on Coco Crisp’s Fangraphs player page at https://www.fangraphs.com/statss.aspx?playerid=1572.
27 Jacob Pomrenke, “Bones Ely,” SABR BioProject, https://sabr.org/bioproj/person/3a97d15b.
28 Pomrenke.
29 Jonathan Fraser Light, The Cultural Encyclopedia of Baseball, 2nd ed., (Jefferson, NC: McFarland, 2005), 412.