

Overall Offensive Performance (OOP)
This article was written by Barry Hyman
This article was published in Fall 2021 Baseball Research Journal
We propose to measure overall offensive performance of a baseball player as the ratio of Bases Advanced to Outs Created. This new Overall Offensive Performance (OOP) statistic is deterministic, objective, readily calculated, and easily understood. OOP captures in a single number all aspects of offensive performance included in multiple, existing offensive stats, plus additional aspects not captured in any other offensive statistic. Among these additional aspects, OOP gives batters credit for advancing runners already on base and gives runners credit for taking extra bases on batted balls.
To provide the appropriate background, we first review existing offensive performance stats, including commonly used and lesser known deterministic stats, as well several probabilistic ones. Next, after pointing out some of the deficiencies in the existing stats, we introduce the rules governing the determination of the OOP numerator (Bases Advanced) and denominator (Outs Created). We then show how OOP may easily be incorporated into traditional scorekeeping, and close with sample calculations for four players.
EXISTING OFFENSIVE PERFORMANCE STATS
While there is a plethora of ways to measure offensive performance of baseball players, the statistics that are summarized here are those that are most relevant to overall offensive performance. Since the proposed OOP statistic is deterministic, we focus on other deterministic stats, i.e. those that describe the actual and immediate outcome of an individual player’s offensive actions. Stats that compare or weight such outcomes relative to other outcomes (average player, replacement player, etc.) or different settings (eras, ballparks, etc.) are not addressed. Probabilistic stats that estimate or predict the eventual outcome of a player’s offensive actions (runs, wins, etc.) are discussed only to the extent that they shed light on the proposed OOP stat.
COMMONLY USED DETERMINISTIC STATS
The most common measure of offensive performance is Batting Average (BA). One of the criticisms of BA is that it treats all hits equally, so it is combined with RBI and home runs to try to create a more comprehensive picture of overall offensive performance. Despite the shortcomings in this approach, not only are the league leaders in each of these categories lauded, but the “Triple Crown” is won by the player who leads his league in all three categories.
Sometimes additional measures such as runs scored and bases stolen are included in the description of offensive achievements. For example, the AP article announcing Jose Altuve as the AL MVP in 2017 included the following: “Altuve batted a major-leaguebest .346 in the regular season, hit 24 home runs with 81 runs batted in, scored 112 times, stole 32 bases… .”1 Using this collection of five numbers to characterize offensive performance does not help us compare Altuve’s 2017 performance with another (hypothetical) player who batted .340, with 20 home runs, 85 RBI, 105 runs, and 40 stolen bases. Let’s call this the “Altuve problem” and our goal in this paper is to solve the problem using a single, easily calculated, deterministic measure of overall offensive performance. We begin by reviewing several other widely utilized offensive stats.
One commonly cited overall offensive performance statistic is Slugging Average (SLG) which gives proportionally more credit to extra-base hits and takes the following form, where TB is total bases:
![]()
Another widely used statistic is On Base Average (OBA) defined as follows:
![]()
OBA treats all hits (H) equally but also gives the batter credit in the numerator for walks and being hit by a pitch. In the denominator, OBA adds walks, HBP, and sacrifice flies (SF) to obtain total plate appearances, except for sacrifice bunts. (The argument used in the MLB glossary for not including sacrifice bunts is that “…it is rarely a hitter’s decision to sacrifice himself, but rather a manager’s choice as part of an in-game strategy.”2)
Recently it has become increasingly popular to add SLG and OBA together to produce On Base Plus Slugging (OPS). Slowinski argues that while OPS is a relatively quick and easy way to combine the ability to get on base (OBA) with the ability to hit for power (SLG), it incorrectly treats them as equal in value.3 In addition, there is a major intellectual problem to combining SLG and OBA in this way because both the numerators and denominators of the two statistics represent different things. Keith Thompson characterized OPS as “…like adding apples and oranges.”4 Keith Law described OPS as “…a mash-up the way a toddler smushes two lumps of Play-Doh together and calls it a present for Mommy….”5
Even if we can overcome the intellectual problem of treating OPS as a mathematically meaningful measure of performance, it cannot be computed directly. To obtain it, we first have to compute both SLG and OBA, then add them together. So, from both an intellectual and computational perspective, OPS does not satisfy the desire for a single, simple measure of overall offensive performance.
LESS-KNOWN RELEVANT DETERMINISTIC STATS
Many other deterministic stats have been proposed to characterize overall offensive performance but have not been widely adopted in the mainstream media. The most interesting ones are examined in this section.
Secondary Average (SecA) was created by Bill James.6 It is a modification of SLG that includes walks, stolen bases (SB), and caught stealing (CS) in the numerator and focuses only on hits for extra bases (TB-H). There are variations of SecA that include HBP and/or delete CS in the numerator.
In 1987 Richard Cochrane introduced Total Batting Average (TBA) that added SLG to BA, plus gives batters credit for RBIs (unlike the stats mentioned so far) and walks.7 Here is his formula:
![]()
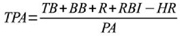
A similar stat, Total Production Average, (TPA) was introduced in 1995, added runs scored (R), and took the following form, in which all plate appearances (PA) are included in the denominator:8
Recognizing the mathematical fallacy embodied in OPS, Mark Kanter developed a refinement called New Production (NewProd) where CI is catcher’s interference.9
![]()
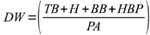
Another approach to rectifying the OPS mathematical inconsistency is the Diamond Weight (DW) proposed by Barry Codell.10 It takes the following form:
This approach was further refined by William Gilbert with his Bases per Plate Appearance (BPA), where grounding into double plays (GIDP) and sacrifice bunts (SH) are included.11
![]()
Total Average (TA), developed by sportswriter Thomas Boswell, is the number of bases reached by a batter, divided by the number of outs created by the player.12
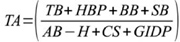
Unlike BA, SLG, OBA, OPS, SecA, TBA, TPA, New-Prod, DW, and BPA, which are essentially ratios of successes/opportunities, TA is a ratio of successes/failures — the approach used in OOP. (In principle, either approach could measure overall offensive performance.)
Another stat that uses the successes/failures ratio is the Base Out Percentage (BOP) which adds sacrifice hits (SH) and sacrifice flies (SF) to both the numerator and denominator of TA.13
![]()
Including SH and SF in the denominator is an important improvement since they both result in outs. Including them in the numerator is more interesting, though, because although sacrifice flies and sacrifice hits both represent success, BOP is the only stat discussed so far other than TBA and TPA that gives the batter credit for advancing a runner other than himself.
This failure to properly account for advancing the runners ahead of the batter is the basis for some criticism of the stats discussed earlier in this section.14 And in a 2008 Fangraphs article, Brandon Heipp critiqued TA, BOP, and several similar stats, writing:
“All of the base-based measures above ignore the existence of baserunners, and implicitly assume that all plate appearances occur in bases empty situations (or alternatively posit that the effects of a batter’s actions on the other baserunners are meaningless in evaluating his performance). What if instead we look at how many bases actually are accounted for, on average, for each event?”15
But, as discussed above, BOP does in fact account for some of the runners on base by including SH and SF in the numerator and giving the batter credit for advancing them. Heipp’s claim that he looks “at how many bases actually are accounted for” is immediately qualified by saying he does it “on average.” While this is an improvement over other stats mentioned, there is a big difference between accounting for the bases actually advanced in an event and accounting for the average number of bases advanced in similar events. As we will show, one of the major contributions of OOP is tracking the actual bases advanced. In 2008, Bill James did introduce Player Baserunning as a separate stat.16 However, it was not integrated with batting stats to arrive at a measure of overall offensive performance as OOP does.
In a 2004 application for a patent, Richard Kerns proposed to incorporate all actual bases advanced in the stat that he dubbed Offensive Average (OA).17 Its basic form is as follows:
![]()
BARAB = bases advanced by runner at bat,
BARO1st= bases advanced by runner on first, etc.
While this numerator is an improvement over BOP, it credits all the bases advanced to the batter. OOP, on the other hand, assigns credit in a more nuanced manner.
While in its basic form, OA is a ratio of successes/opportunities, Kerns offers the option of adding an At-Bat Adjustment term to the denominator to include one or more terms such as CS, GIDP, and “any other factor deemed meaningful or useful by user.” Such a modification would transform the denominator into a combination of opportunities and failures, thereby destroying the meaning of the ratio. Kerns’s patent application was abandoned on July 31, 2006.18
Another deterministic stat that doesn’t represent either a ratio of successes/opportunities or a ratio of successes/failures is Runs Created (RC).19 Developed by Bill James, its original form is as follows:
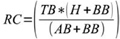
James developed several other versions of RC, the most well-known of which is the following, where
![]()
This expression discounts the value of terms such as BB and SB. As quoted by John Thorn in The Hidden Game of Baseball, James’s justification for such discounts is that, “A stolen base advances only the runner” but “each…hit advances the batter…and anyone else aboard.”21 Thorn goes on to explain that “a walk cannot drive in a runner from third, as a single can, unless the bases are loaded.”22 This is another example of considering the value of advancing runners already on base.
It is important to emphasize that all of the stats mentioned so far except RC are deterministic and describe what actually happens as the immediate result of a player’s offensive actions. On the other hand, while RC is deterministic, it is an empirical formula that estimates what will happen as the ultimate result of a player’s actions. See Figure 1 for a typology of the deterministic offensive stats (including OOP) where the stats in the Partial category shown in Figure 1 include only either SB and/or RBI, SH, and SF as bases advanced.
PROBABILISTIC STATS
We now consider the category of stats that use large data sets and probabilistic considerations to estimate and predict the ultimate outcome of a player’s offensive actions.
Figure 1. Typology of Deterministic Offensive Stats
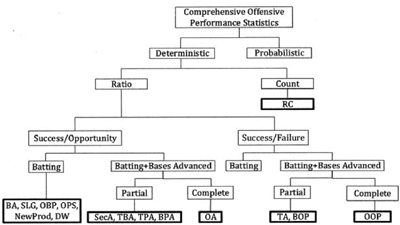
(Click image to enlarge)
We briefly review some of these stats in this section, even though they are primarily of value to team managers and executives who use them to plan in-game and long-term team development strategy, estimate trade values, and negotiate salaries and contract terms. These stats are also of great interest to professional statisticians, baseball stats enthusiasts, and baseball history aficionados who use them to, among other things, distinguish between performance in home/away and day/night games, forecast future performance, and compare players from different leagues and eras. They are not easily accessible — in many cases not easily understandable — to the typical baseball fan.
However, there are several probabilistic stats that help to inform the way we calculate OOP, so we limit our coverage in this section to those stats.
A key data set that underlies many probabilistic stats is the Expected Run Matrix which lists the probability of runs scoring in an inning for every one of all 24 possible states of outs and bases occupied. Table 1 is Tom Tango’s Expected Run Matrix for 1999–2002.23 Consider, for example, the value of 0.953 associated with a runner on first and no outs. That number is obtained by knowing that during those four seasons, there were 44,552 times that MLB teams had a runner on first with no outs, and during those times teams scored 42,432 runs before the end of the inning. Therefore, on average there were 0.953 runs scored in an inning when there is a runner on first and no outs. a similar calculation is made to arrive at the other 23 numbers in the matrix.
Table 1. Expected Run Matrix (1999–2002)
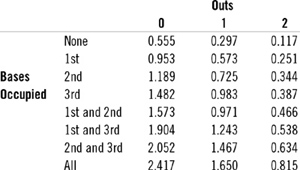
These data can be used to determine Expected Run value of any offensive act. For example, if a batter doubles with the bases empty and one out, the Expected Runs increase from 0.297 to 0.725, an increase of 0.428.
Based on these data, Tango performed an extensive series of calculations and adjustments (spanning six tables and ten pages in his book) to arrive at this expression for Weighted On-Base Average (wOBA) for the 1999–2002 period:
![]()
In the wOBA formula, NIBB=nonintentional bases on balls, and RBOE=reach base on error.24
One feature that distinguishes wOBA from any of the previously discussed stats is that wOBA gives a player credit for reaching base on an error (although it does not distinguish between a one-base error and multi-base error). Fangraphs publishes a version of wOBA for every year; its version omits the RBOE term.25
Mark Pankin utilized the Expected Run Matrix concept to develop similar estimates of a player’s offensive performance that include actions such as SB and CS.26 Several others have applied the Expected Run Matrix concept to develop more comprehensive probabilistic baserunning stats such as Equivalent Baserunning Runs (EqBRR)27 and Ultimate Base Running (UBR).28
Lee Panas makes the point that the addition of baserunning to batting statistics provides a more complete picture of a player’s offensive production.29 This type of data is incorporated into OOP as will be explained in detail in the following pages.
DEFICIENCIES IN EXISTING DETERMINISTIC OFFENSIVE STATS
Consider the following situations that are not captured by any of the deterministic offensive stats.
- With a runner on first, the batter hits a ground ball. If the runner advances to second and the batter is out at first, the result is better than if the runner is forced out at second while the batter is safe at first. None of the deterministic stats distinguishes between these two results.
- If a batter is out trying to stretch a single into a double, he is still credited with a base hit for that at-bat and is not penalized by any of the deterministic stats for creating the out.
- If a batter hits a single with a runner on base, unless the runner scores so the batter is credited with an RBI, deterministic stats (except for OA) do not give the batter credit for advancing the runner.
- If a runner scores from third on a fly ball out, the runner gets credit for scoring and the batter gets credit for an RBI and is not charged with an AB. However, if the runner advances from second to third on a fly ball out, neither the batter (except for OA) nor the runner gets any credit.
- There is no extra penalty for hitting into a double play in deterministic stats (except for TA and the refined version of RC) as compared to making an out.
We now turn to introducing a new stat that accounts for these and other deficiencies in existing deterministic offensive stats.
OVERALL OFFENSIVE PERFORMANCE
The offensive player’s role is to advance as many players (including himself) as much as possible while creating as few outs as possible. We propose to capture this objective in Overall Offensive Performance (OOP) defined as:
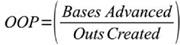
This single, simple measure of offensive performance incorporates the bases covered by a player as a batter and a runner plus the bases covered by runners advanced by the batter. OOP also penalizes players for the outs they cause.
A fundamental rule underlying the calculation of OOP is that we must account for all Bases Advanced and all Outs Created. Detailed explanations for the numerator and denominator in OOP are provided in the next sections along with illustrative examples.
BASES ADVANCED
A player is awarded one point in the OOP numerator for each base advanced. Since there are multiple ways for players to reach first base and advance beyond first, the following subsections explore all of the possibilities.
Bases Empty. We start with the situation where the bases are empty and the batter advances to at least first base; we first examine reaching base on a hit, then reaching base via other means.
• Bases Advanced via Base Hits
The following points are earned by a batter for getting a hit when the bases are empty:
– The player who singles gets 1 point.
– The player who hits a double gets 2 points.
– The player who hits a triple gets 3 points.
– The player who hits a home run gets 4 points.
These point values are the same as those used in all the other deterministic offensive stats.
• Bases Advanced via Other Means
Remember that the fundamental OOP rule requires that we account for all Bases Advanced. A walk is treated like a single, worth one point in the numerator. This is the same approach taken by OBA, SecA, TPA, NewProd, DW, BPA, TA, BOP, OA, and the original RC. Neither the current versions of RC nor wOBA gives credit for intentional walks. Both TBA and the current version of RC include walks, but at a discounted value.
Being hit by the pitch should also be awarded a point. As with walks, reaching base by HBP is included in OBA, NewProd, DW, BPA, TA, BOP, OA, the current version of RC, and wOBA.
Batters who reach base on an error are credited with the points associated with the base reached. Many errors are the result of the fielder hurrying the play on a speedy offensive player. Other errors are the result of a judgment call by the official scorer and hence are not an objective statistic. OOP gives the batter credit as does Tango’s wOBA, but all other stats mentioned above essentially charge the batter with an out. But since OOP requires that all outs be accounted for, it makes no sense to account for an out that has not occurred.
This discussion makes it clear that batters are given credit in OOP for bases advanced regardless of the mechanism by which they reach base. Thus, batters who reach first base by catcher’s interference (included in NewProd) or dropped third strike also receive one point.
Runners on Base. Once a batter reaches a base as a result of a hit or other mechanism discussed above, he becomes a runner and can advance to subsequent bases in a variety of ways.
• Bases Advanced by Runners
When a runner advances in the absence of action by a subsequent batter, the runner gets credit for the bases advanced. Stealing a base is an offensive contribution and the runner is credited with a point in OOP, as is done in SecA, BPA, TA, BOP, OA, while a discounted point is awarded in the revised RC. The runner also gets credited if he advances due to an error on an attempted pickoff play, or advances an extra base due to a throwing error on his stolen base effort. A point is earned in OOP even if the base is advanced on catcher indifference, balk, passed ball, or wild pitch; James includes these as part of his baserunning stat.30 So does Panas.31 The basis for crediting the runner with such advances, as Panas says, is that “there is some evidence that such advancement is caused, in part, by baserunners distracting pitchers and catchers. Thus, good baserunners should benefit more from these events than poor baserunners.”32
• Runners Advanced by Action of Subsequent Batters
If there are runners on base when the batter gets a hit, the batter gets the appropriate points for the bases he advances plus additional points for advancing the runners already on base. Here are some examples, with the points earned by the batter for advancing runners in front of him shown in italics:
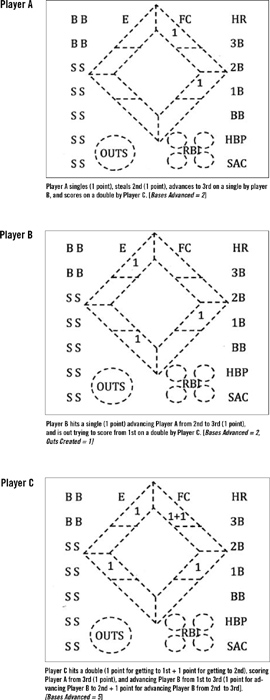
– The batter who singles and advances a runner one base either from first to second, or from second to third, or scores from third, gets 1+1=2 points.
– The batter who doubles and advances a runner either from first to third, or from second to home, gets 2+2=4 points.
– The batter who triples with runners on first and third, gets 3+3+1=7 points.
– The batter who hits a grand slam, gets 4+1+2+3=10 points.
In each of the above examples, the runner(s) do not advance more bases than the batter.
Of course, there are situations where a runner advances two bases on a single (either from first to third or from second to home) or three bases on a double (scoring from first). Consider the following five circumstances under which these situations can develop:
1. The batted ball is a long hit or a hit combined with an error so that any runner, regardless of speed, could easily make it to the extra base.
2. The runner makes it to the extra base primarily on the basis of his speed.
3. A hit-and-run play is called by the manager so the runner breaks toward second at the manager’s direction.
4. A runner approaching third is waved home by the third base coach.
5. With two outs and a 3–2 count on the batter, the runner(s) take off on the pitch and thus get a head-start.
The OOP rule requires that all the bases advanced be accounted for. So we have to decide who gets the credit for the extra base advanced, the batter or the runner? (We cannot give credit to either the manager or the coach.) A similar issue was addressed by Hal Stern, who assumed for his probabilistic model “that there are three types of singles (short singles, which advance all runners one base; medium singles, which advance all runners one base but allow a runner on second base to advance two bases; and long singles, which advance all runners two bases) and that the three types are equally likely.”33 That may be fine for a probabilistic stat, but we need a clear and unambiguous rule for OOP.
We have concluded that the credit for the extra base should always be awarded to the runner. This is supported by James Click who argues that “going from first to third or scoring from second on a single counts for just as much as stealing third or home.”34 This is the same approach taken by Bill James in his Player Baserunning stat. Panas used the same method in his probabilistic Bases Gained Above Average (BGAA) stat.35 John Dewan also awarded the extra base to the runner and included estimated runs due to baserunning in his probabilistic stat Total Runs (TR).36
Runners can also advance as the result of the batter making an out. OOP gives the runner credit when he tags up and advances a base on a fly out, or advances a base on a groundball out in a non-force situation. This is similar to Panas’s approach.37
OUTS CREATED
The OOP denominator is the number of Outs Created. As with Bases Advanced, there are multiple ways in which outs can be recorded.
The most obvious way, and the way captured by traditional stats, is the batter is out via a strikeout, fly out, or ground out. But consider the following ways of making outs that are not reflected in traditional stats, but are incorporated into OOP by applying the rule that all outs must be accounted for.
If a batter is out trying to stretch a single into a double, or a double into a triple, OOP gives the player credit for the bases he successfully reached but the player is also charged with an out.
If a runner unsuccessfully tries to advance from first to third or from second to home on a batter’s single, OOP charges the runner with an out while the batter gets credit for advancing the runner one base. The same approach gives the batter credit for advancing a runner from first to third on a double but charges the runner with an out if he is thrown out at home. These rules complement the ones adopted in the previous section which gives the runner credit for advancing the extra base. Thus, we have a perfect symmetry: the runner is credited if successfully reaching the extra base and is penalized for the unsuccessful effort. Panas takes a similar approach, but since BGAA is a counting stat rather than a ratio stat, he deducts “from a player’s bases gained total every time he is thrown out trying to advance an extra base on a hit.”38
Similarly, this symmetry argument is applied to charge a runner with an out when he unsuccessfully tries to advance on a fly out or an unforced ground out.
A batter grounding into a double play is charged with two outs if the runner is forced. Another double play occurs when a runner takes off on a well-hit line drive or long fly ball that is caught and the runner is picked off before he can return to the base. We consider two situations. If the runner is either on first or all bases behind the runner are occupied, the runner is virtually obligated to head towards the next base or risk being forced out so OOP charges the batter with both outs. However, if the runner has the option to stay on his base because the base immediately preceding his is unoccupied, then the runner is charged with an out.
When a batter hits into a force play, there may be a temptation to award the batter a point for advancing to first in addition to charging him with an out. But, since there was a runner on first to begin with, all that happened is that one person on first is replaced by a different person on first and there is no advance.
While a batter gets appropriate points for advancing a runner from first on a sacrifice bunt, in accordance with the OOP rule the batter is also charged with an out.
If a runner successfully advances to a base, but then is tagged out because his foot comes off the base, the runner is charged with an out. Runners picked off a base are also charged with an out.
And if the runner is caught stealing, he gets a point added to the denominator. Runner interference, runner hit by the ball, running out of the base path, and illegal slide are further ways to be charged with creating an out.
KEEPING SCORE
One of the advantages of OOP is that managers, coaches, sportscasters, fans, and members of the media could use it to easily capture all of the ingredients of offensive performance during a game. Score-keeping systems vary, but most use a scoresheet containing a grid of square boxes in which the offensive performance for each player’s at-bat is recorded. The preprinted content of the box and which additional information is entered by the scorer varies widely. (See Kern’s patent application for his approach to tracking OA data.39)
To illustrate one way OOP could easily be incorporated, consider the fairly complex preprinted box shown in Figure 2. It facilitates keeping track of balls, strikes, RBIs, errors, outs, etc., as well as details about the player’s progress around the bases.
Without eliminating any of that information, OOP can be included by adding an outer dashed diamond as shown in Figure 3 that is subdivided into zones for each base which in turn are subdivided into two parts. The upper part of each zone is used to record the bases advanced while the lower part records the outs created.
To illustrate how to easily keep track of Bases Advanced and Outs Created, consider a hypothetical three-player segment of a scorebook shown in Figure 4. The only entries displayed are the values in the outer dashed diamond in order to focus on the application of the OOP rules, but narratives explaining the player’s actions are added underneath each segment.
Figure 2. Typical Preprinted Scorecard Box
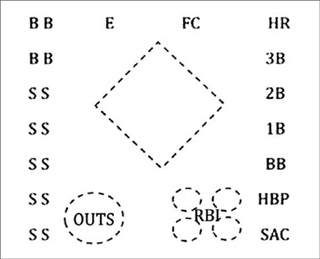
Figure 3. Scorecard Box for OOP

Figure 4. OOP Scorebook Examples
EXAMPLE OOP VALUES
While it is straightforward to develop new OOP data using a slightly modified traditional scorecard, developing historical OOP data is more difficult because not enough information is contained in traditional box scores. However, Retrosheet includes detailed complete play-by-play narratives of most games in the American and National Leagues from 1915 through 2020.40 This is the source for our OOP data.
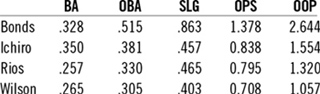
To get a preliminary feel for the range of numerical OOP values, we focused on the season-long performance of four players in 2001: Barry Bonds and Armando Rios of the San Francisco Giants, and Ichiro Suzuki and Dan Wilson of the Seattle Mariners. Bonds, a quintessential slugger, hit a record-breaking 73 home runs and was the National League MVP that year. By contrast, Ichiro led the American League in batting average, hits, and stolen bases, won the American League MVP, and was a quintessential speedster and small-ball player. The two superstars illustrate a vast difference. Wilson, the Mariners 2001 catcher, and Rios, Giants outfielder, were selected as prototypical average players.41 These choices were based on Wilson’s BA=.265 being close to the AL average in 2001 of BA=.267, and Rios’s BA=.257 with the NL average in 2001 of BA=.261.
We calculated the 2001 season OOP values for these four players by applying the Bases Advanced and Outs Created rules to the play-by-play information in Retrosheet. See Table 2 for the results along with traditional stats.
Table 2. Sample OOP and Conventional Stats Values for the 2001 Season
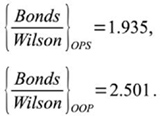
Note that the OOP ranking of these four players is the same as their OPS ranking, although their relative standings can be quite different, for example:
While the OOP values are the result of many different ways a player accumulates Bases Advanced and Outs Created, it is instructive to consider other ways to interpret them.
For example, one straightforward interpretation of Bonds’s OOP could be that for every out he caused, he hit the equivalent of at least a double (actually, it was closer to a triple).
A perhaps more intriguing result of our OOP calculations is that the OOP values for our two prototypical average players are in the range 1 < OOP < 1.3. This very preliminary result suggests that this range may indeed be the hallmark of an average offensive player. Of course, an important limitation on drawing such a conclusion is that our selection of Rios and Wilson was based on comparing their BA to the league average BA. What would be required to properly select prototypical average players would be to compare their OOP values to the league average OOP. But since no one has calculated the league average OOP (and we are not about to attempt such a Herculean feat), we are left, for the time being, with pure speculation. If enough other people hop on the OOP bandwagon, a meaningful database can be constructed to draw more definitive conclusions.
DISCUSSION
Once the few rules are learned, OOP is easy to understand and calculate. It captures in one number all of the ingredients of BA, OBA, SLG, and DW. Also, OOP accounts for SB and CS and GIDP that are part of the SecA, BPA and TA stats as well as the CI term in New-Prod, SH term in BOP and RBOE term in wOBA.
In addition, OOP explicitly incorporates the batter’s contribution to advancing runners ahead of him, without resorting to probabilistic analysis such as done in wOBA and other probabilistic stats.
Although OOP does not explicitly include RBI, it does serve as a surrogate. So, for example, in addition to the points a batter earns for the bases he covers, he also earns one point for scoring a runner from third on a single, double, triple, or home run. So in those situations OOP is accurately reflecting RBI. But OOP goes beyond RBI by crediting the batter two points for scoring a runner from second on a double, triple, or home run, three points for scoring a runner from first on a triple or home run, and six points for clearing the bases with a grand slam (in addition to the points the batter earns for the bases he covers). These additional points compensate for OOP not giving the batter credit for an RBI on an SF or an unforced ground out.
OOP incorporates a partial surrogate for runs scored because it only credits a player who scores from third on an SF or unforced ground out, from second on a single, from first on a double, or hits a home run.
This paper began by posing the “Altuve problem” — the difficulty in determining who is best within a group of offensive players by comparing their traditional stats (BA, HR, RBI, SB, etc.). We end it by claiming that OOP solves this problem by reducing each player’s total offensive performance to a single number and thereby enabling the comparison. So when someone claims that the answer is OPS, we say oops, the real answer is OOP.
BARRY HYMAN is Professor Emeritus of Mechanical Engineering and Public Affairs at the University of Washington. He started his career as an active baseball player at the age of 67. In the summers he plays in the Puget Sound Senior Baseball League. During the off-seasons he competes in the Men’s Senior Baseball League and Roy Hobbs World Series tournaments. He is also a veteran of several Pro-Ball Baseball Clinics and Seattle Mariners Fantasy Camps.
Acknowledgments
The author gratefully acknowledges the valuable comments received on a previous version of this document by Ray Baculi, Shawn Brinsfield, Glenn Drosendahl, Bob Pessemier, Jim Pfeifer, Harvey Sadis, Clark Swisher, and Betty Houchin Winfield. Their feedback has led to a much improved version.
Notes
1. Jake Seiner, “Altuve wins AL MVP, Marlins’ Stanton earns NL honor,” Seattle Times, November 16, 2017. https://www.seattletimes.com/sports/marlins-slugger-stanton-wins-nl-mvp-edges-reds-votto (accessed August 14, 2020).
2. “On-base Percentage (OBP),”https://mlb.com/glossary/standard-stats/on-base-percentage (accessed August 16, 2020). SABR prefers the term “On-base Average” (OBA) over “On-base Percentage” (OBP) since the stat is usually expressed as a three decimal term in the same style as Batting Average (e.g. .320), and not as a percentage (32%).
3. OPS and OPS+ | Sabermetrics Library, http://library.fangraphs.com/offense/ops (accessed July 16, 2021).
4. Keith R. Thompson, “What’s Wrong with the OPS Analysis in Baseball,” (persports.com) (accessed July 15, 2021).
5. Keith Law, Smart Baseball (New York: HarperCollins, 2017), 127.
6. Andrew Kneeland, “MLB Stat of the Week,” Bleacher Report, May 20, 2002. https://bleacherreport.com/articles/24464-mlb-stat-of-the-weeksecondary-average. Andrew Kneeland, “MLB Stat of the Week,” Bleacher Report, May 20, 2002. https://bleacherreport.com/articles/24464-mlbstat-of-the-week-secondary-average.
7. Richard M. Cochrane, “The Total Average Concept: Hitting, Pitching, Team Play,” The Baseball Research Journal 16 (1987): 9–14, https://sabr.org/baseball-research-journal-archives (accessed July 21, 2020).
8. Eugene E. Heaton Jr. and Alan W. Heaton, “The Best Overall Batting Performance Measure-8 So Far,” The Baseball Research Journal 24 (1995): 127–30, https://sabr.org/baseball-research-journal-archives (accessed July 21, 2020).
9. Mark Kanter, “New Production,” The Baseball Research Journal 29 (2000): 102–04, https://sabr.org/baseball-research-journal-archives (accessed July 21, 2020).
10. Barry F. Codell, “DW: A Way to Truly Weigh the Diamond!” By the Numbers, Newsletter of the SABR Statistical Analysis Research Committee 5, no. 1 (1993): 4–6, http://sabr.org/research/statisticalanalysis-research-committee-newsletters (accessed July 23, 2020).
11. William C. Gilbert, “A True Measure of Offensive Performance,” By the Numbers, Newsletter of the SABR Statistical Analysis Research Committee 5, no. 2 (1993): 11–12, http://sabr.org/research/statisticalanalysis-research-committee-newsletters (accessed July 23, 2020).
12. “Total average,” https://www.baseball-reference.com/bullpen/Total_Average.
13. Barry Codell, “The Base-Out Percentage: Baseball’s Newest Yardstick,” The Baseball Research Journal (1979), https://sabr.org/journal/article/the-base-out-percentage-baseballs-newest-yardstick-2 (accessed August 17, 2020).
14. “Bases Fallacy,” https://www.baseball-reference.com/bullpen/Bases_Fallacy (accessed August 20, 2020).
15. Brandon Heipp, “Bases and outs ad nauseum,” https://tht.fangraphs.com/bases-and-outs-ad-nauseum (accessed August 18, 2020).
16. Bill James, “Player Baserunning,” in Baseball Info Solutions, The Bill James Handbook 2008, (Skokie, IL: ACTA Sports (2007), 301–12.
17. US Patent and Trademark Office, United States Patent Application Pub. No: US 20050227793 A1, “Method, Apparatus, and System for Determining Player Effectiveness”, Richard Dean Kerns, 2005, http://appft.uspto.gov/netacgi/nph-Parser?Sect1=PTO1&Sect2=HITOFF&d=PG01&p=1&u=%2Fnetahtml%2FPTO%2Fsrchnum.html&r=1&f=G&l=50&s1=%2220050227793%22.PGNR.&OS=DN/20050227793&RS=DN/20050227793 (accessed August 18, 2020).
18. US Patent and Trademark Office, Public Patent Application Information Retrieval, https://portal.uspto.gov/pair/PublicPair (accessed August 18, 2020).
19. “A Primer on Statistics,” https://sabr.org/sabermetrics/statistics (accessed August 18, 2020).
20. “Runs created,” https://www.baseball-reference.com/bullpen/Runs_created (accessed August 18, 2020).
21. John Thorn and Pete Palmer, The Hidden Game of Baseball (Chicago: University of Chicago Press, 2015), 50.
22. Thorn and Palmer, 50.
23. Tom M. Tango, Mitchel G. Lichtman, and Andrew E. Dolphin, The Book: Playing the Percentages in Baseball (TMA Press, 2006), 19–20.
24. Tango, Lichtman, and Dolphin, 30.
25. Steve Slowinski, “wOBA,” https://library.fangraphs.com/offense/woba (accessed August 18, 2020).
26. Mark D. Pankin, “Evaluating Offensive Performance in Baseball,” Operations Research 26, no.4 (1978): 610–19.
27. Albert Chen, “The Running Man,” https://vault.si.com/vault/2009/07/27/the-running-man (accessed August 19, 2020).
28. Mitchel Lichtman, “Ultimate Base Running Primer,” https://blogs.fangraphs.com/ultimate-base-running-primer (accessed August 20, 2020).
29. Lee Panas, Beyond Batting Average: Baseball Statistics for the 21st Century, 62, https://www.lulu.com/search?q=Lee+Panas&adult_audience_rating=00 (accessed July 25, 2020).
30. James, 302.
31. Panas, 63.
32. Panas, 66.
33. Hal S. Stern, Column Editor “A Statistician Reads the Sports Page: Baseball by the Numbers,” CHANCE 10, no.1 (1997): 38–41.
34. James Click, “What if Ricky Henderson Had Pete Incaviglia’s Legs?” in Baseball Between the Numbers, ed. Jonah Keri (New York: Basic Books, 2006), 116.
35. Panas, 63–67.
36. John Dewan, The Fielding Bible-Volume II (Skokie, IL: ACTA Sports, 2009) 393.
37. Panas, 64–65.
38. Panas, 64.
39. US Patent and Trademark Office, United States Patent Application Pub. No: US 20050227793 A1.
40. Retrosheet event files, https://www.retrosheet.org.
41. Rios was traded to the Pirates in late July 2001 but only played two games for them before suffering a season-ending injury.