

The .400 Club
This article was written by Trent McCotter
This article was published in 2004 Baseball Research Journal
Since the National League started in 1876, there have been only 28 seasons in which a batter finished with a batting average of .400 or higher. Wanting to see how different players had achieved the rare feat of batting .400, I used many different sources to compile different “splits” about each and every .400 season. I inputted the game-by-game stats into a database for each player to calculate statistics that I think help compare the .400 hitters, from Ross Barnes to Ted Williams. If nothing else, they provide some interesting facts about each of these fantastic batting seasons, such as the four times that a player reached .400 in the final game of the season, including one batter who did it twice!
A NOTE ABOUT THE STATS
I used the standard interpretation for batting average (H/AB) for all seasons, even those from 1876 and 1887, in which walks were 0-for-1s (1876) or 1-for-1s (1887). Also, I included only those players who qualified for the batting title that season as the cutoff for .400; seasons like Craig Wilson’s .468 average in 1998 (22-for-47) aren’t included. While compiling the splits for these seasons, I found a few errors in official totals, which I have incorporated into these splits. See the section titled “Why Some Numbers Are Different” to see which numbers are different from what most books have and why the change was made.
EXPLANATIONS FOR THE CHARTS
The categories are mostly self-explanatory, but definitions should be given just for clarity. The categories 1+H, 2+H, 3+H, etc., mean “games during the season in which the player had at least 1 hit (or games with at least 2 hits, 3 hits, etc.) with the percentage of games of that variety in parentheses.
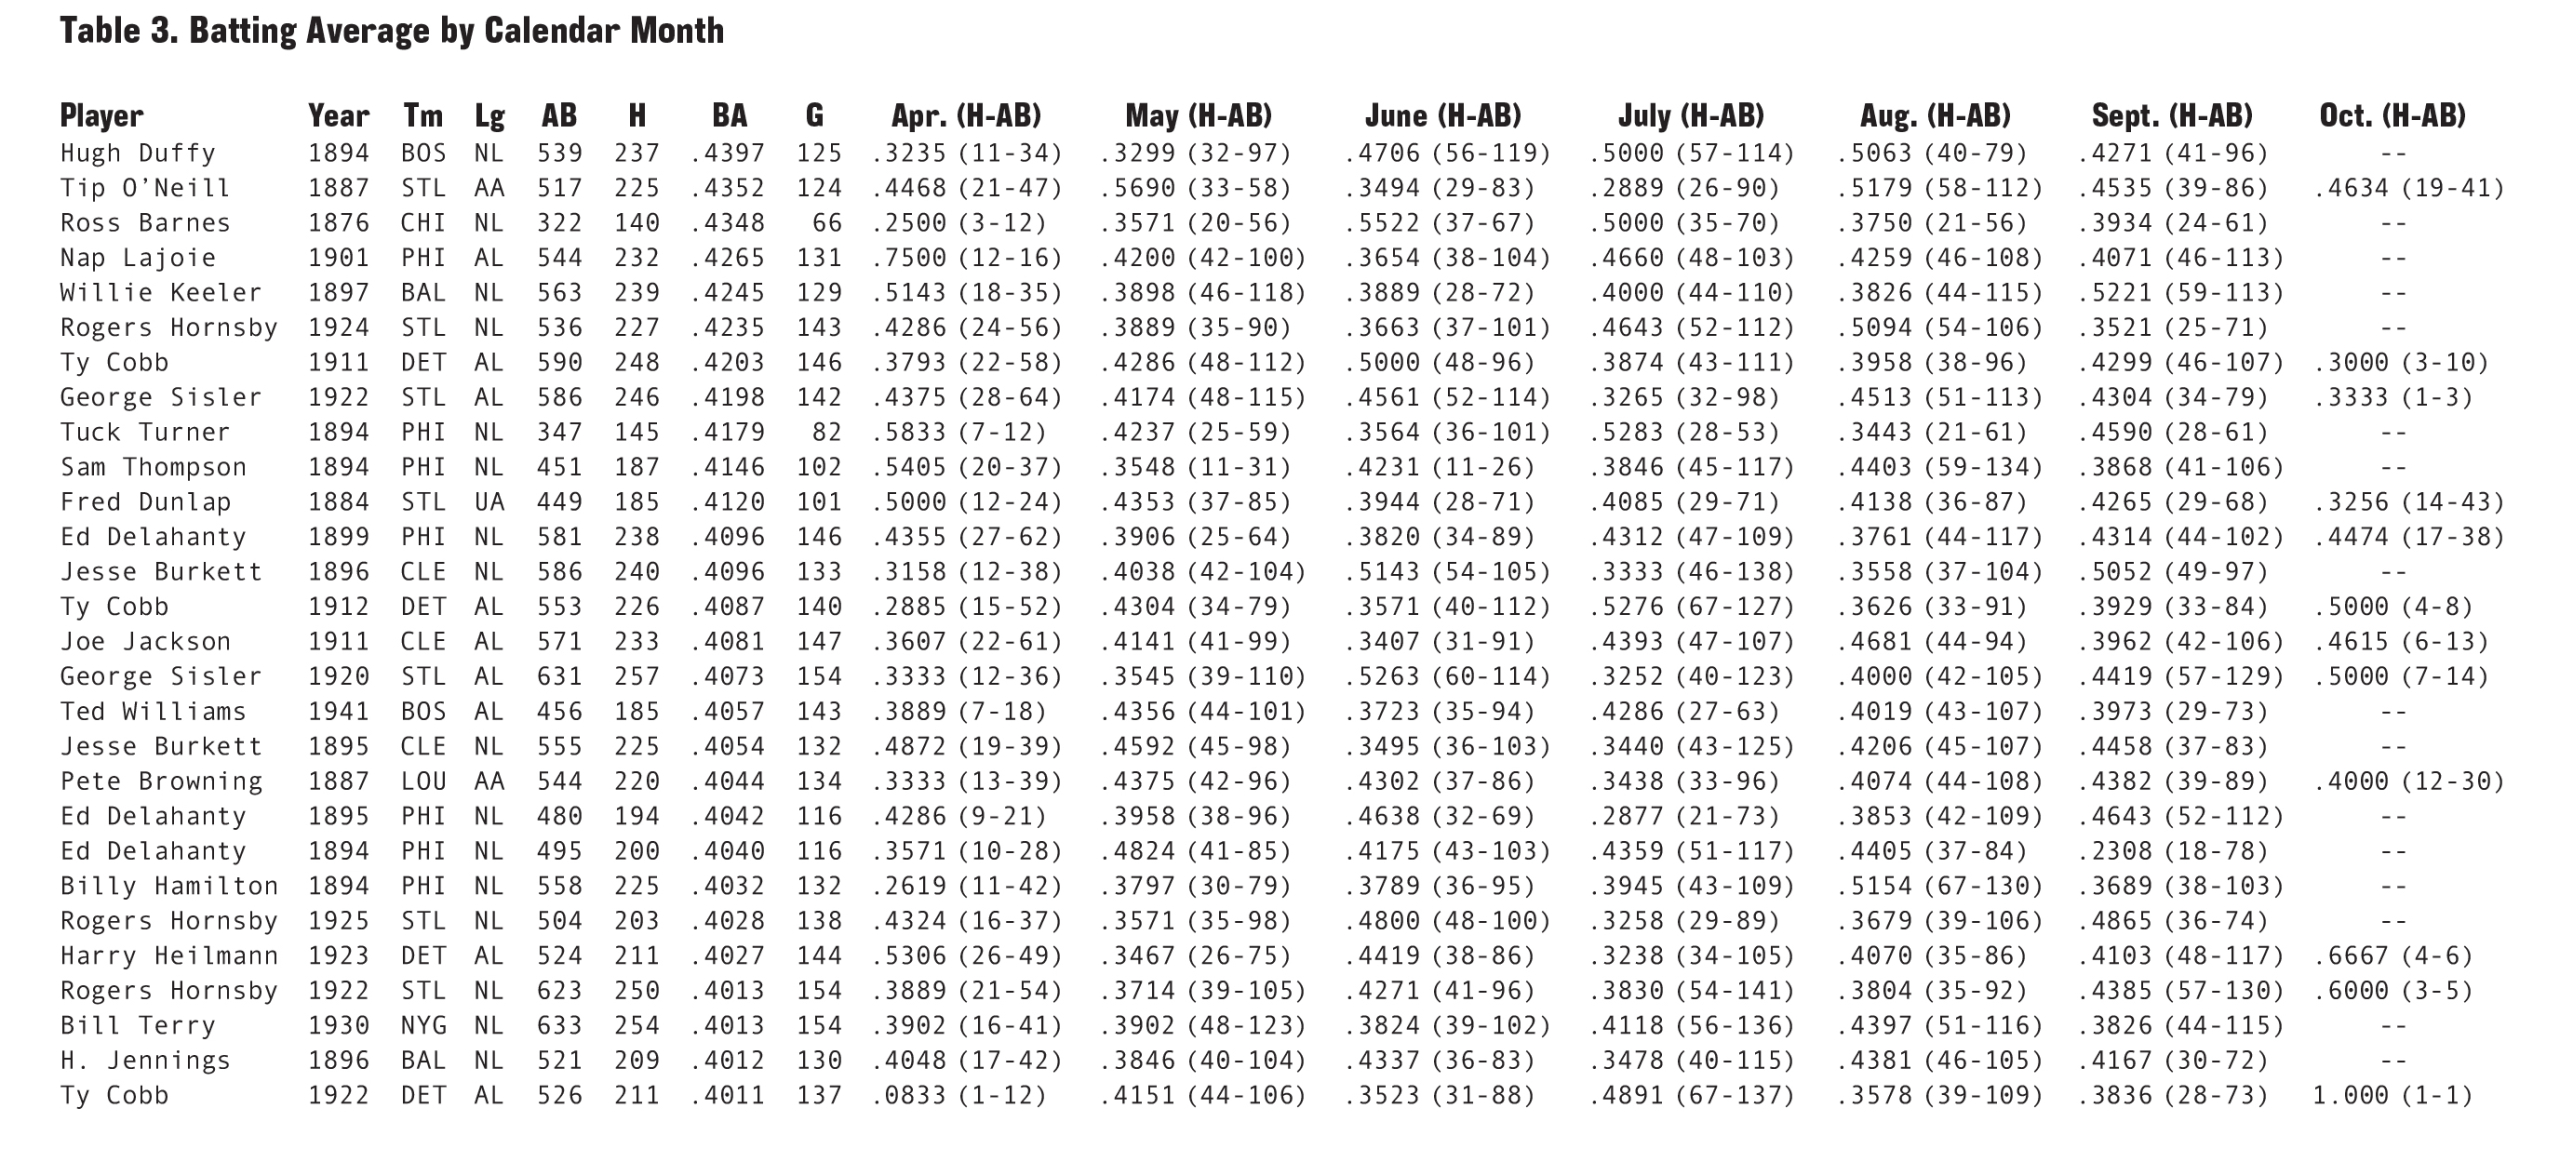
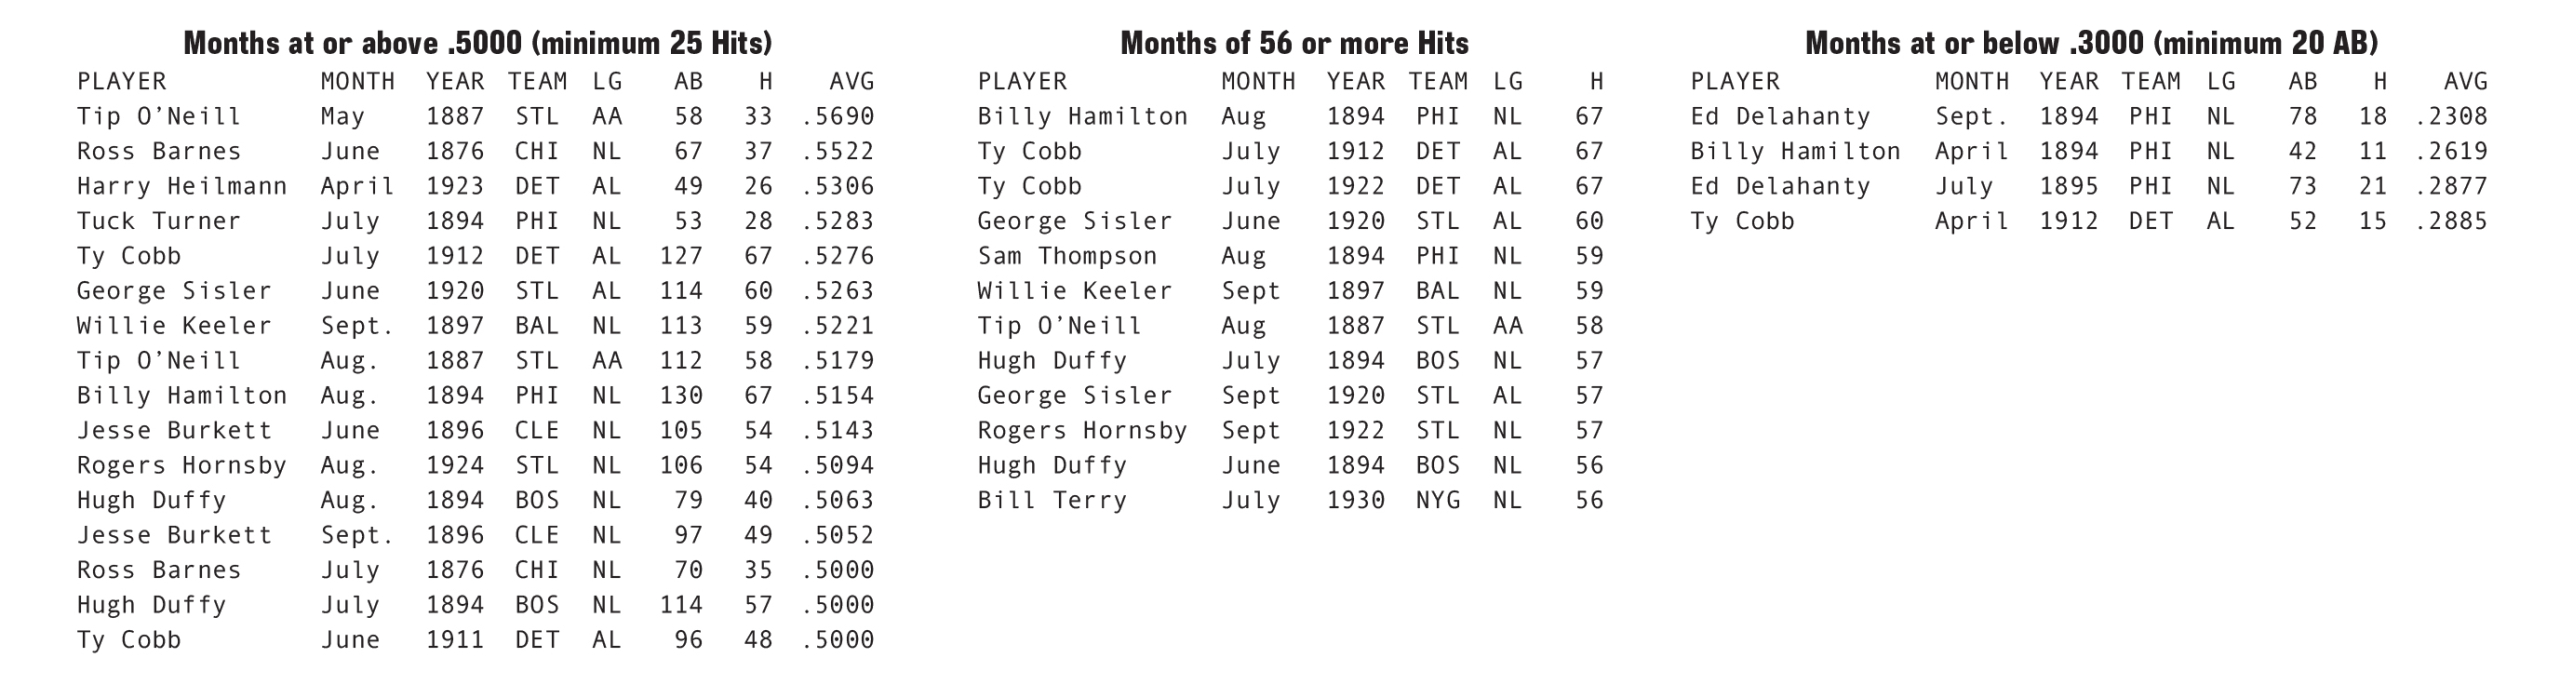
The APR, MAY, JUN, etc., categories are the batting averages the player had in that particular calendar month, with the aggregate AB and H totals in parentheses.
The “home” and “away” categories list the batting average the player had at their home park and at away parks during the season, with the aggregate AB and H totals in parentheses.
The G >= .400 is the total number of games in which the cumulative season batting average at the end of a game was at or above .400. This category is like looking in the newspaper the day after each game to see what that player’s batting average was season-to-date; Nap Lajoie, the one player with 100%, started the season at .750 (3-for-4) in the first game and never fell below .400.
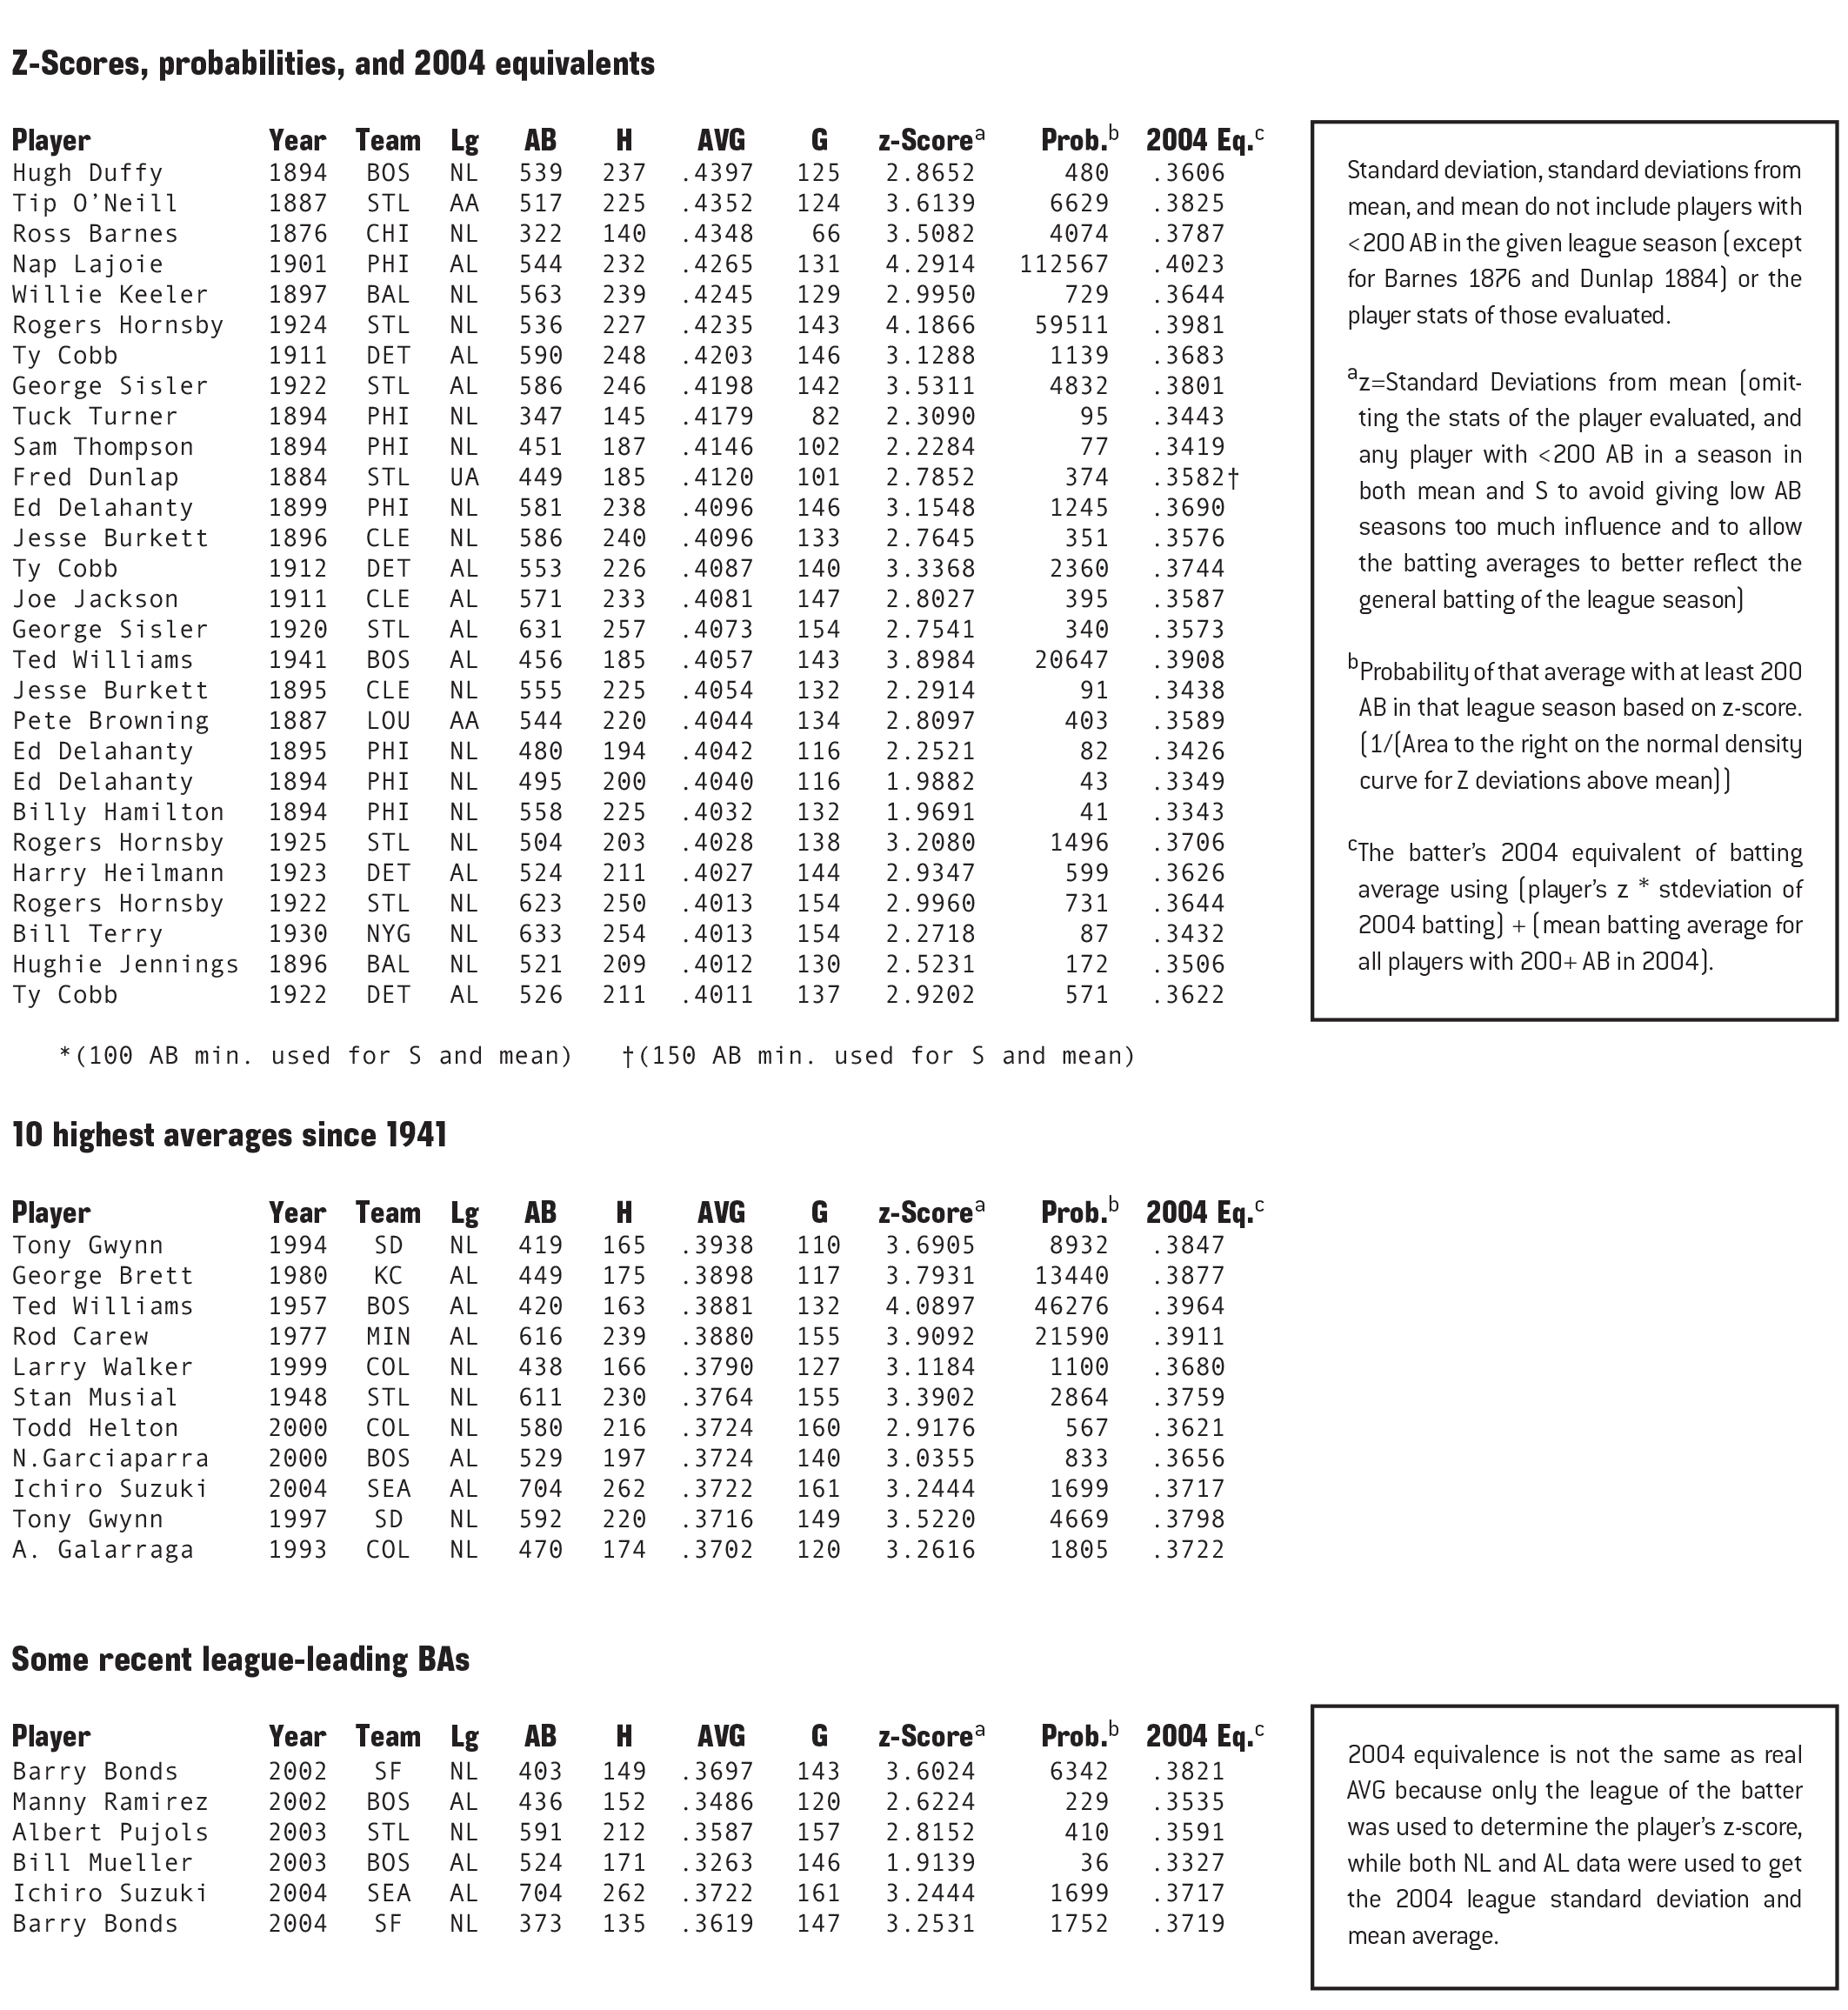
Z-Score tells how many deviations away from the mean the batting average was for that year. The z-score formula is
x – μ
____
σ
where x is the statistic of the individual player whose z- score is being calculated, μ is the mean for the entire league, and σ is the standard deviation. Or in this case:
((.400 hitter’s AVG) – (LgAVG))
______________________
Standard deviation of LgAVG
I used data only for players with 200+ AB in the league season, not including the player that was being evaluated. For instance, for Ted Williams’ 1941 season, I used only averages from players with 200+ AB in 1941 American League, not including Williams’ data. I then used the z-score to find the probability of that batting average in that particular season, using the normal density curve (the bell-shaped curve). For normal distributions (and major league batting averages are close to normal data), then 68% of all averages will be within one standard deviation of the mean, 95% within two deviations of the mean, and 99.7% within three deviations of the mean. Using a graphing calculator allows a more precise percentage to be given for z-scores that are not even numbers like one or two. When one is divided by the area under the curve, the probability of that batting average in that season results:
The “2004 Equivalence” is what the .400 batting average would translate into in “2004 average.” The formula is (z-score x Stand. Dev. Of 2004 AVG)+League AVG of 2004. This uses the player’s z-score to give us its 2004 equivalent in terms of deviations above mean. Since Standard Deviation of league averages has been going down, batting .400 is becoming
Table 1. Games in Which the Cumulative Season Batting Average at the End of the Game Was at or above .400
|
Player |
Year |
Tm |
Lg |
AB |
H |
AVG |
G |
G>.400(%)* |
|
H. Duffy |
1894 |
BOS |
NL |
539 |
237 |
.4397 |
125 |
68(54.4%) |
|
T. O’Neill |
1887 |
STL |
AA |
517 |
225 |
.4352 |
124 |
105(84.7%) |
|
R. Barnes |
1876 |
CHI |
NL |
322 |
140 |
.4348 |
66 |
43(65.2%) |
|
N. Lajoie |
1901 |
PHI |
AL |
544 |
232 |
.4265 |
131 |
131(100.0%) |
|
W. Keeler |
1897 |
BAL |
NL |
563 |
239 |
.4245 |
129 |
112(86.8%) |
|
R. Hornsby |
1924 |
STL |
NL |
536 |
227 |
.4235 |
143 |
112(78.3%) |
|
T. Cobb |
1911 |
DET |
AL |
590 |
248 |
.4203 |
146 |
124(84.9%) |
|
G. Sisler |
1922 |
STL |
AL |
586 |
246 |
.4198 |
142 |
140(98.6%) |
|
T. Turner |
1894 |
PHI |
NL |
347 |
145 |
.4179 |
82 |
78(95.1%) |
|
S. Thompson |
1894 |
PHI |
NL |
451 |
187 |
.4146 |
102 |
101(99.0%) |
|
F. Dunlap |
1884 |
STL |
UA |
449 |
185 |
.4120 |
101 |
99(98.0%) |
|
E. Delahanty |
1899 |
PHI |
NL |
581 |
238 |
.4096 |
146 |
137(93.8%) |
|
J. Burkett |
1896 |
CLE |
NL |
586 |
240 |
.4096 |
133 |
68(51.1%) |
|
T. Cobb |
1912 |
DET |
AL |
553 |
226 |
.4087 |
140 |
66(47.1%) |
|
J. Jackson |
1911 |
CLE |
AL |
571 |
233 |
.4081 |
147 |
51(34.7%) |
|
G. Sisler |
1920 |
STL |
AL |
631 |
257 |
.4073 |
154 |
75(48.7%) |
|
T. Williams |
1941 |
BOS |
AL |
456 |
185 |
.4057 |
143 |
112(78.3%) |
|
J. Burkett |
1895 |
CLE |
NL |
555 |
225 |
.4054 |
132 |
81(61.4%) |
|
P. Browning |
1887 |
LOU |
AA |
544 |
220 |
.4044 |
134 |
72(53.7%) |
|
E. Delahanty |
1895 |
PHI |
NL |
480 |
194 |
.4042 |
116 |
50(43.1%) |
|
E. Delahanty |
1894 |
PHI |
NL |
495 |
200 |
.4040 |
116 |
108(93.1%) |
|
B. Hamilton |
1894 |
PHI |
NL |
558 |
225 |
.4032 |
132 |
36(27.3%) |
|
R. Hornsby |
1925 |
STL |
NL |
504 |
203 |
.4028 |
138 |
64(46.4%) |
|
H. Heilmann |
1923 |
DET |
AL |
524 |
211 |
.4027 |
144 |
82(56.9%) |
|
R. Hornsby |
1922 |
STL |
NL |
623 |
250 |
.4013 |
154 |
21(13.6%) |
|
B. Terry |
1930 |
NYG |
NL |
633 |
254 |
.4013 |
154 |
79(51.3%) |
|
H. Jennings |
1896 |
BAL |
NL |
521 |
209 |
.4012 |
130 |
65(50.0%) |
|
T. Cobb |
1922 |
DET |
AL |
526 |
211 |
.4011 |
137 |
49(35.8%) |
*This category is like looking in the newspaper after each game played by the .400 hitter, and tallying how many games they were at or above a .400 average for the season.
Highest Percentage of Games Finished At or Above .4000
- 100.0%: Lajoie PHI AL 1901
- 99.0%: Thompson PHI NL 1894
Most Games Finished At or Above .4000
- 140: Sisler STL AL 1922
- 137: Delahanty PHI NL 1899
Lowest Percentage of Games Finished At or Above .4000
- 13.6%: Hornsby STL NL 1922
- 34.7%: Jackson CLE AL 1911
Fewest Games Finished At or Above .4000
- 21: Hornsby STL NL 1922
- 49: Cobb DET ATL 1922
Reaching .400 on the Final Game of the Season
- Ed Delahanty (1895): Entering 09/30/1895, he was at .3979. He went 5-for-5 on 09/30/1895 to finish at .4042.
- Hughie Jennings (1896): Entering 09/26/1896, he was at .3996. He went 2-for-3 on 09/26/1896 to finish at .4012.
- Rogers Hornsby (1922): Entering 10/01/1922, he was at .3997. He went 3-for-5 on 10/01/1922 to finish at .4013.
- Rogers Hornsby (1925): Entering 09/27/1925(2), he was at .3992. He went 3-for-3 on 09/27/1925(2) to finish at .4028.
Note: Ted Williams is not listed because his average entering his last game on 09/28/1941(2) was .4040.
No player has ever had a batting average of .4000 or higher entering the final game of the season, and ended up losing it. However, Hornsby (1921) came close:
- Rogers Hornsby (1921): Entering 10/01/1921, he was at .4024. He went 0-for-4 on 10/01/1921 AND on 10/02/1921 to finish at .3970. (Note: Hornsby’s average entering 10/02/1921, his final game, was .3997, so he just missed qualifying for this list). Players who came very close to batting .400
Players who came very close to batting .400
|
Player |
Year |
Team |
Lg |
AB |
H |
AVG |
How close? |
|
Cap Anson |
1881 |
CHI |
NL |
343 |
137 |
.3994 |
-1AB(.4006) |
|
Lefty O’Doul |
1929 |
PHI |
NL |
638 |
254 |
.3981 |
+1H,-1AB(.4003) |
|
H. Heilmann |
1927 |
DET |
AL |
505 |
201 |
.3980 |
+1H(.4000) |
|
R. Hornsby |
1921 |
STL |
NL |
592 |
235 |
.3970 |
+2H(.4003) |
|
Ed Delahanty |
1896 |
PHI |
NL |
499 |
198 |
.3968 |
+2H(.4008) |
|
Jesse Burkett |
1899 |
STL |
NL |
558 |
221 |
.3961 |
+2H,-1AB(.4004) |
|
Joe Jackson |
1912 |
CLE |
AL |
572 |
226 |
.3951 |
+3H(.4003) |
Players who batted .400 over a 162-game stretch
|
Player |
Start |
End |
AB |
H |
2B |
3B |
HR |
BA |
|
Tony Gwynn |
7-27-93 |
5-13-95 |
624 |
251 |
53 |
1 |
15 |
.402 |
|
Wade Boggs |
6-09-85 |
6-06-86 |
641 |
257 |
50 |
2 |
12 |
.401 |
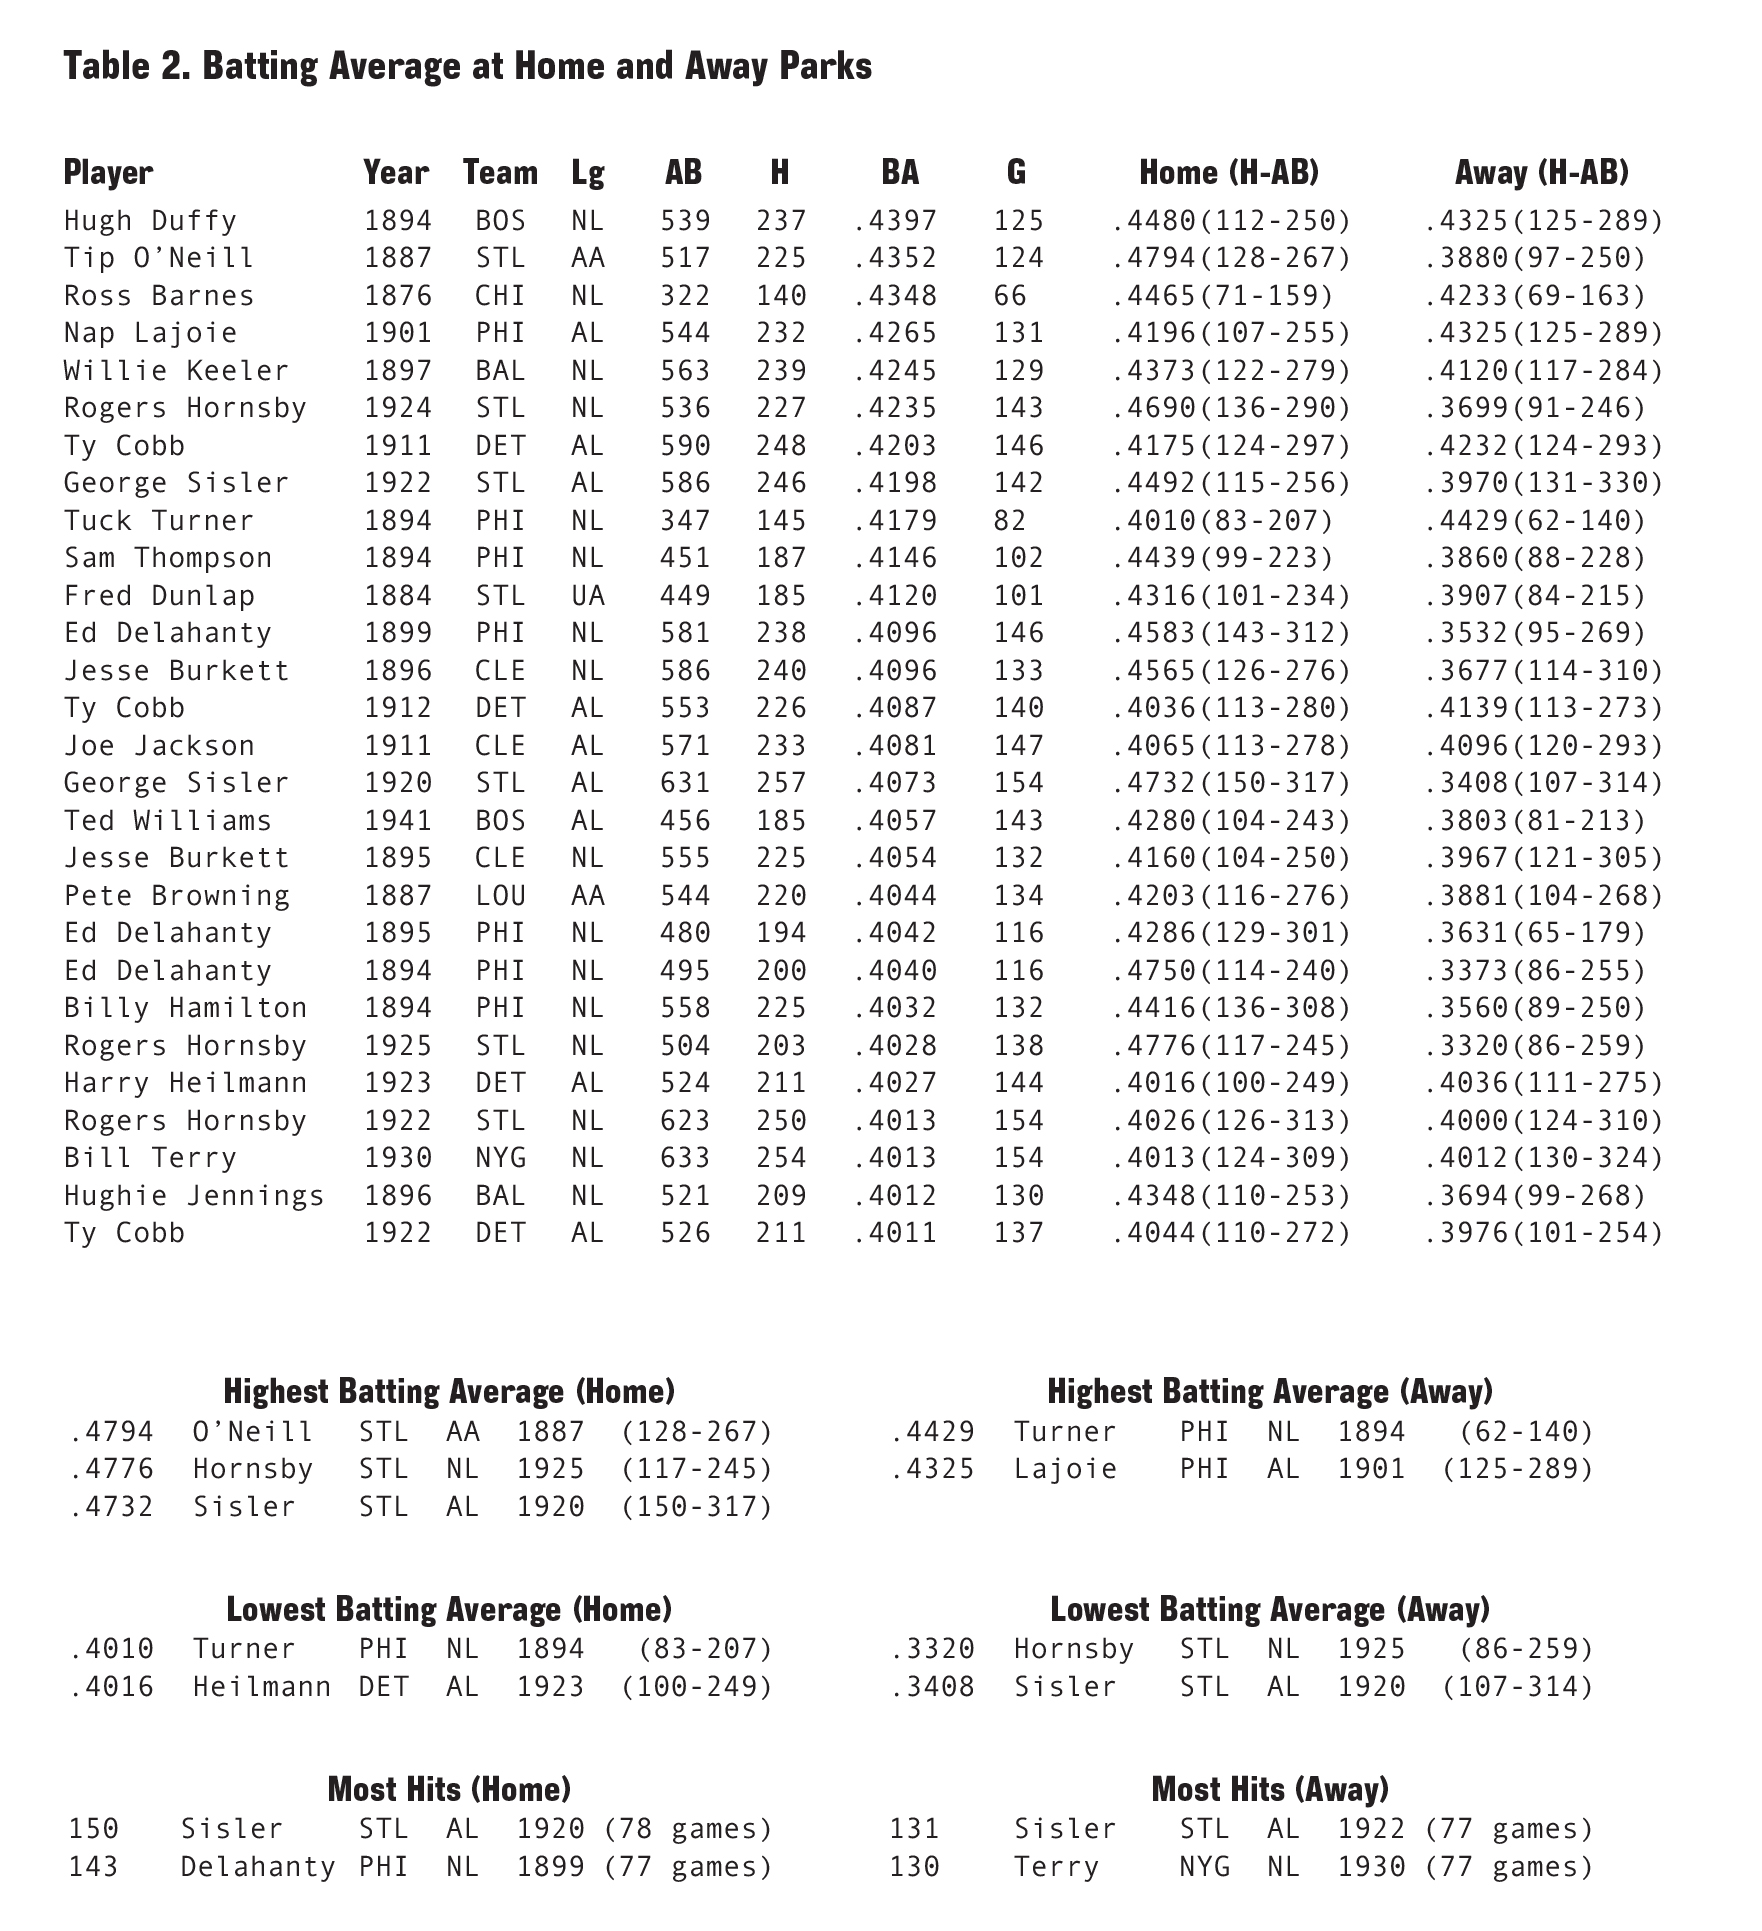
Table 2. Batting Average at Home and Away Parks
(Click image to enlarge)
Interesting Facts
- All players batted at or above .4000 in their home parks.
- Only 11 of 28 players batted at or above .4000 in road parks.
- Four of the five highest home batting averages were in St. Louis ballparks.
- Turner (1894) holds the records for highest road BA (.4429) and the lowest home BA (.4010) in the same season.
- Hornsby (1925) holds the NL records for highest home BA (.4776) and the lowest road BA (.3320) in the same season.
- Sisler (1920) holds the AL records for highest home BA (.4732) and the lowest road BA (.3408) in the same season.
(Click image to enlarge)
(Click image to enlarge)
(Click image to enlarge)
Interesting Facts
- Approximate odds of hitting .400 in 2004: z-score of 4.212 (or 1 in 79000)
- Approximate odds of hitting .400 in 1894: z-score of 1.852 (or 1 in 31.2)
- Batting .400 in 2004 would have been approximately equivalent to batting .505 in 1894. Nap Lajoie in 1901 is the only .400 hitter whose z-score would have resulted in a .400 or greater average in 2004.
Games with a certain amount of hits in the season
|
Player |
Year |
Team |
Lg |
AB |
H |
AVG |
G |
1+H(%G) |
2+H(%G) |
3+H(%G) |
4+H(%G) |
5+H(%G) |
|
Hugh Duffy |
1894 |
BOS |
NL |
539 |
237 |
.4397 |
125 |
106 (84.8%) |
82 (65.6%) |
34 (27.2%) |
13 (10.4%) |
2 (1.6%) |
|
Tip O’Neill |
1887 |
STL |
AA |
517 |
225 |
.4352 |
124 |
103 (83.1%) |
70 (56.5%) |
34 (27.4%) |
14 (11.3%) |
4 (3.2%) |
|
Ross Barnes |
1876 |
CHI |
NL |
322 |
140 |
.4348 |
66 |
57 (86.4%) |
46 (69.7%) |
25 (37.9%) |
9 (13.6%) |
2 (3.0%) |
|
Nap Lajoie |
1901 |
PHI |
AL |
544 |
232 |
.4265 |
131 |
114 (87.0%) |
76 (58.0%) |
33 (25.2%) |
8 (6.1%) |
0 (0.0%) |
|
Willie Keeler |
1897 |
BAL |
NL |
563 |
239 |
.4245 |
129 |
117 (90.7%) |
82 (63.6%) |
27 (20.9%) |
11 (8.5%) |
2 (1.6%) |
|
Rogers Hornsby |
1924 |
STL |
NL |
536 |
227 |
.4235 |
143 |
119 (83.2%) |
75 (52.4%) |
29 (20.3%) |
4 (2.8%) |
0 (0.0%) |
|
Ty Cobb |
1911 |
DET |
AL |
590 |
248 |
.4203 |
146 |
129 (88.4%) |
84 (57.5%) |
29 (19.9%) |
5 (3.4%) |
1 (0.7%) |
|
George Sisler |
1922 |
STL |
AL |
586 |
246 |
.4198 |
142 |
126 (88.7%) |
72 (50.7%) |
36 (25.4%) |
12 (8.5%) |
0 (0.0%) |
|
Tuck Turner |
1894 |
PHI |
NL |
347 |
145 |
.4179 |
82 |
68 (82.9%) |
48 (58.5%) |
24 (29.3%) |
5 (6.1%) |
0 (0.0%) |
|
Sam Thompson |
1894 |
PHI |
NL |
451 |
187 |
.4146 |
102 |
89 (87.3%) |
58 (56.9%) |
27 (26.5%) |
9 (8.8%) |
3 (2.9%) |
|
Fred Dunlap |
1884 |
STL |
UA |
449 |
185 |
.4120 |
101 |
87 (86.1%) |
61 (60.4%) |
24 (23.8%) |
11 (10.9%) |
2 (2.0%) |
|
Ed Delahanty |
1899 |
PHI |
NL |
581 |
238 |
.4096 |
146 |
125 (85.6%) |
75 (51.4%) |
30 (20.5%) |
6 (4.1%) |
2 (1.4%) |
|
Jesse Burkett |
1896 |
CLE |
NL |
586 |
240 |
.4096 |
133 |
115 (86.5%) |
75 (56.4%) |
34 (25.6%) |
13 (9.8%) |
3 (2.3%) |
|
Ty Cobb |
1912 |
DET |
AL |
553 |
226 |
.4087 |
140 |
119 (85.0%) |
76 (54.3%) |
25 (17.9%) |
5 (3.6%) |
1 (0.7%) |
|
Joe Jackson |
1911 |
CLE |
AL |
571 |
233 |
.4081 |
147 |
127 (86.4%) |
76 (51.7%) |
26 (17.7%) |
4 (2.7%) |
0 (0.0%) |
|
George Sisler |
1920 |
STL |
AL |
631 |
257 |
.4073 |
154 |
130 (84.4%) |
74 (48.1%) |
41 (26.6%) |
12 (7.8%) |
0 (0.0%) |
|
Ted Williams |
1941 |
BOS |
AL |
456 |
185 |
.4057 |
143 |
113 (79.0%) |
50 (35.0%) |
18 (12.6%) |
4 (2.8%) |
0 (0.0%) |
|
Jesse Burkett |
1895 |
CLE |
NL |
555 |
225 |
.4054 |
132 |
110 (83.3%) |
73 (55.3%) |
36 (27.3%) |
5 (3.8%) |
1 (0.8%) |
|
Pete Browning |
1887 |
LOU |
AA |
544 |
220 |
.4044 |
134 |
117 (87.3%) |
71 (53.0%) |
25 (18.7%) |
6 (4.5%) |
1 (0.7%) |
|
Ed Delahanty |
1895 |
PHI |
NL |
480 |
194 |
.4042 |
116 |
94 (81.0%) |
61 (52.6%) |
26 (22.4%) |
11 (9.5%) |
2 (1.7%) |
|
Ed Delahanty |
1894 |
PHI |
NL |
495 |
200 |
.4040 |
116 |
92 (79.3%) |
64 (55.2%) |
31 (26.7%) |
10 (8.6%) |
2 (1.7%) |
|
B. Hamilton |
1894 |
PHI |
NL |
558 |
225 |
.4032 |
132 |
112 (84.8%) |
73 (55.3%) |
27 (20.5%) |
11 (8.3%) |
2 (1.5%) |
|
Rogers Hornsby |
1925 |
STL |
NL |
504 |
203 |
.4028 |
138 |
111 (80.4%) |
65 (47.1%) |
22 (15.9%) |
5 (3.6%) |
0 (0.0%) |
|
H. Heilmann |
1923 |
DET |
AL |
524 |
211 |
.4027 |
144 |
123 (85.4%) |
63 (43.8%) |
21 (14.6%) |
3 (2.1%) |
1 (0.7%) |
|
Rogers Hornsby |
1922 |
STL |
NL |
623 |
250 |
.4013 |
150 |
135 (87.7%) |
78 (50.6%) |
32 (20.8%) |
5 (3.2%) |
0 (0.0%) |
|
Bill Terry |
1930 |
NYG |
NL |
633 |
254 |
.4013 |
154 |
129 (83.8%) |
80 (51.9%) |
32 (20.8%) |
11 (7.1%) |
2 (1.3%) |
|
H. Jennings |
1896 |
BAL |
NL |
521 |
209 |
.4012 |
130 |
106 (81.5%) |
67 (51.5%) |
29 (22.3%) |
6 (4.6%) |
1 (0.8%) |
|
Ty Cobb |
1922 |
DET |
AL |
526 |
211 |
.4011 |
137 |
111 (81.0%) |
67 (48.9%) |
21 (15.3%) |
8 (5.8%) |
4 (2.9%) |
Leaders, hits per game (HPG)
One or more HPG
- Most often: Keeler had 1 or more hits in 117 of 129 games in 1897 for 90.7%, the only player above 90.0%.
- Most times: Hornsby had the most games with 1 or more hits with 135 in 1922 (out of 150 games for 87.7%).
Two or more HPG
- Most often: Barnes had 2 or more hits in 46 of 66 games in 1876 for 69.7%, one of only 3 players with 2 or more hits in >60.0% of their games.
- Most times: Cobb had the most games with 2 or more hits with 84 in 1911 (out of 146 games for 57.5%).
Three or more HPG
- Most often: Barnes had 3 or more hits in 25 of 66 games in 1876 for 37.9%, the only player above 30.0%.
- Most times: Sisler had the most games with 3 or more hits with 41 in 1920 (out of 154 games for 26.6%).
Four or more HPG
- Most often: Barnes had 4 or more hits in 9 of 66 games in 1876 for 13.6%, one of only 4 players with 4 or more hits in >10.0% of their games.
- Most times: O’Neill had the most games with 4 or more hits with 14 in 1887 (out of 124 games for 11.3%).
Five or more HPG
- Most often: O’Neill had 5 or more hits in 4 of 124 games in 1887 for 3.2%, one of only 5 players with 5 or more hits in >2.0% of their games.
- Most times: O’Neill and Cobb had the most games with 4 or more hits with 4 each O’Neill had 5 or more hits 4 times in 1887 (out of 124 games for 3.2%). Cobb had 5 or more hits 4 times in 1922 (out of 137 games for 2.9%). increasingly difficult.
Hopefully, these splits will provide some insight into how these great seasons were compiled, so enjoy!
WHY SOME NUMBERS ARE DIFFERENT
Ross Barnes, 1876
Since no game-by-game logs have ever been made in any form for NL players pre-1891, I had to use newspapers to put together Barnes’s splits. I used the New York Clipper for the majority of games, but also used the Chicago Tribune for about 40% of Barnes’s data. Using newspapers, I came up with two more hits for Barnes than what most encyclopedias list.
Pete Browning, 1887
In 1887, walks were counted as 1-for-1 in box scores. On August 31, 1887, Pete Browning went 4-for-7 by 1887 standards, but 3 of those were walks. Thus, Browning went 1-for-4 by today’s standards. When ICI (Information Concepts, Incorporated) made their game logs, they put Browning down as 1-for-7 with 3 walks. ICI clearly forgot to subtract the 3 walks from his at-bat total, as they did subtract 3 from his hit total. Browning should be listed as 1-for-4 with 3 walks by today’s standards, not 1- for-7 with 3 walks, which ICI used (which incorrectly used the 1887 definition for at-bats, but the current definition for hits). If ICI were correct, then this would mean Browning came up to bat 10 times in a 9-inning game, 2 more times than the known record. While there are probably many errors like this, this one gave Browning 3 more at-bats than he really had, and this error is a pretty obvious one.
Willie Keeler, 1897
The change for Keeler’s 1897 season is one fewer at-bat. I found this one while investigating Keeler’s 5-hit games in 1897. The Sporting News’s Complete Baseball Record Book lists Keeler with four 5-hit games in 1897, but the ICI logs made in 1968 and 1969 have Keeler with only two 5-hit games. One of the games listed by TSN but not ICI was on September 3, 1897. Most newspapers list Keeler as going 6-for-6 with no walks. However, data collected by Pete Palmer shows Keeler as 4-for-5 with a hit- by-pitch:
- PA1) Single,Stolen Base, Run Scored (1st inning)
- PA2) Reached on E6, Stolen Base, Run Scored (2nd inning)
- PA3) Triple, Run Scored (3rd inning)
- PA4) Hit-By-Pitch,Stolen Base, Run Scored (4th inning) PA5) Single (6th inning)
- PA6) Single, Run Scored (8th inning) TOTALS–5 AB, 5 R, 4 H, 1 HBP
Since ICI lists Keeler as going 4-for-6, Keeler clearly should have one fewer at-bat than currently listed with. All sources agree that Keeler was HBP, and, using the number of total team plate appearances, it is impossible Keeler could have batted 7 times (6 AB and 1 HBP). Therefore, I have Keeler with 563 AB instead of his listed 564.
Ty Cobb, 1911
Most encyclopedias list Cobb with 248 hits in 591 at-bats for 1911. While inputting Cobb’s 1911 data from his official AL game logs into a database, I found that Cobb was really credited with 590 AB if the individual game totals were added up. However, the aggregate total listed at the end of Cobb’s sheet was the number used, which was incorrectly put as 591 at-bats. Since the totals were summed by hand, the likelihood of errors made for these early years is high; this mistake in addition means that Cobb should be credited with 1 fewer at-bat for 1911.
Tuck Turner, 1894
Sam Thompson, 1894; Ed Delahanty, 1894; Billy Hamilton, 1894; Jesse Burkett, 1895: These players all played in at least one protested game in the year listed. These games’ stats were counted by the National League office in the 1890s (except for wins and losses), but when ICI recalculated all stats from these years in the late 1960s, they incorrectly omitted the protested games’ stats in their totals. Using box scores, the totals have been updated to what they should have been. Here are dates and stats for each of these protested games; these stats have been added to the formerly listed totals for each of these players (these changes are shown in Total Baseball (8th ed.) and The Baseball Encyclopedia (2004).
Acknowledgments
Putting together all of these wonderful splits on some of the best seasons in baseball history required a great deal of aid from fellow researchers and friends. I would like to thank Bill Deane, Steve Gietschier, Pete Palmer, Brian Rash, and Bob Tiemann for helping me throughout this process; it simply would not have been feasible without their help.