

The Accuracy of Preseason Forecasts
This article was written by Frederic Reamer
This article was published in 2003 Baseball Research Journal
Each spring produces a new crop of preseason forecasts by baseball columnists and other sports pundits. About a week or two before the first official pitch is thrown, prognosticators survey rosters, injury reports, and trade rumors, and speculate about the order of finish in each American and National League division. Page one of the typical newspaper sports section presents side-by-side comparisons of columnists’ predictions.
Rarely, however, does one find any serious end-of season accounting of the accuracy of these forecasts. An exception was the ESPN.com column (October 30, 2002), which reprinted the forecasts made by ESPN.com’s baseball staffers at the start of the 2002 season and compared them with the season’s final standings. As a measuring rod, ESPN.com assigned one point for each place missed in the final standings.
After reading the ESPN.com column, I realized that an adaptation of a well-known statistic would provide a much more sensitive and robust indicator of the accuracy of preseason forecasts and facilitate comparisons among various staffers and publications. I think this approach can be used broadly whenever sports columnists predict the final standings in any sport.
The statistic on which my approach is based is known as Spearman’s rho. It is one of many statistics that researchers use to analyze quantitative data. This particular statistic is known in the trade as a nonparametric measure and provides a clear, direct indication of the extent to which there is a linear relationship, or correlation, between two sets of ranked (or what are called ordinal) scores. Put more simply, Spearman’s rho allows one to determine the extent to which two sets of ranks of the same phenomenon — in this case, the preseason and post-season ranks of each baseball division’s teams — are similar. Did the final standings resemble the preseason forecast or not?
Based on a mathematical formula that looks intimidating but is very easy to calculate, Spearman’s rho is a number or coefficient, that is very intuitive and easy to interpret. The final coefficient is a number between +1.0 and -1.0. If the two sets of ranks (e.g., preseason and final standings) are identical, Spearman’s rho would be +1.0, i.e., the postseason order of finish is identical to the preseason forecast.
If the two sets of ranks are completely reversed, the Spearman’s rho would be -1.0, i.e., the team that the columnist thought would finish first actually finished last, the team the columnist thought would finish last actually finished first, and so on up and down the line. Spearman’s rho will equal zero, or will be close to zero, if the results are very mixed, i.e., some predictions were on the mark, some were close, and some were way off the mark.
For illustrative purposes, I compared the accuracy of the preseason forecasts (2002 season) of five ESPN.com staffers: Jayson Stark, Rob Neyer, Jim Caple, Matt Szefc, and Sean McAdam. I calculated the Spearman’s rho coefficients for each staffer’s predictions for each of the three divisions in both leagues. Thus, I calculated six Spearman’s rho coefficients for each staffer. Positive coefficients are better than negative, i.e., they indicate more accurate preseason forecasts.
The maximum (and best possible) total score for each staffer was +6.0 (the sum of a coefficient of +1.0 for each of the six divisions). The worst possible total score was -6.0. In order to come up with a summary score, I added each staffer’s six coefficients (whether positive or negative) and divided the total by +6.0 (the best possible out come). For example, Matt Szefc’s six Spearman’s rho coefficients were:
AL East: +1.0 (Perfect prediction of the final standings.)
AL Central: +.6 (A pretty good result — what hurt Szefc most was that he predicted the Twins, who finished in first place, would come in third.)
AL West: +.4 (A fair, but not great result — Szefc predicted the Mariners to come in first, but they came in third.)
NL East: 0.0 (The results were quite mixed — Szefc accurately predicted the Braves’ first-place finish, but he predicted the Expos, who finished second, would come in last; he predicted the Mets would come in second, but they came in last.)
NL Central: +.54 (A good result — what hurt Szefc that most was that he predicted the Cubs, who finished fifth, would come in second.)
NL West: +.6 (A good result — Szefc predicted the Padres, who finished in last place, would come in third.)
The sum of these coefficients is +3.14 (out of a maximum total of +6.0.)
An easy way to compare the accuracy of each staffer’s predictions is to calculate a final score based on the sum of each division’s Spearman’s rho coefficients (adding up both positive and negative coefficients) divided by +6 (the largest possible total if all preseason forecasts perfectly match the final standings).
A set of perfect predictions would generate a final score of + 1.00 (+6 divided by +6); a set of perfectly inaccurate predictions (the final results are the reverse of the predictions) would generate a final score of-1.00 (-6 divided by +6). Positive final scores are better than negative final scores; scores closer to +1.0 are the strongest and scores closer to -1.0 are the weakest. Scores around zero are truly mediocre.
One can also compare the staffers’ final scores with a final score corresponding to what Phil Birnbaum calls “naïve predictions,” that is, the extent to which the final standings at the end of one season (in this case 2001) accurately forecast the final standings at the end of the following season (2002).
To compute the final score for naïve predictions, one can calculate a Spearman’s rho coefficient corresponding to the naïve predictions for each American League and National League division and calculate a final score by adding up these six coefficients and dividing by +6 (the largest possible total if all of the naïve preseason forecasts, based on the final standings at the end of the preceding season, match the final standings at the end of the following season).
In Szefc’s case, the final score is +0.52, indicating a good but not great outstanding set of predictions (+3.14 divided by +6.0). One can then compare this final score with the scores of all other staffers who made preseason predictions; the higher the score the more accurate the prediction. For the ESPN.com staffers and naïve predictions, the results for each league1 and overall are:
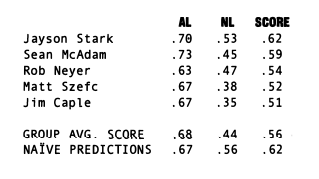
This statistical strategy facilitates easy comparisons among staffers and the naïve predictions. Jayson Stark was the most accurate prognosticator and Jim Caple was the least.2 Overall, the group’s preseason fore cast was good, but not outstanding (+.56). Also, the group’s preseason forecasts for the American League (+.68) were much more accurate than for the National League (+.44).
The naïve predictions for the American League (+.67) were virtually identical to the staffers’ group average (+.68), but the naïve predictions for the National League (+.56) were considerably better than the staffers’ group average (+.44). The overall final score for the naïve predictions (+.62) was somewhat higher than the final score for the group of staffers (+,56). None of the staffers had a higher final score than the final score based on the naïve predictions.
This statistical procedure — the Reamer Prediction Accuracy Index — provides a straightforward, precise, and intuitive measure of the accuracy of preseason predictions in any sport and at any level.
Spearman’s Rho
The formula for Spearman’s rho, which can be found in any standard statistics textbook, is:
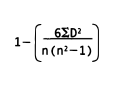
where D is the difference between each pair of ranks and n is the number of items (i.e., teams) ranked. In our case, each team in the preseason forecast would be ranked from first to last (rank=l, rank=2, and so on). These same numbers or ranks would then be listed based on the actual post-season finish and D is calculated by subtracting the post-season rank from the preseason rank.
For example, if the predicted order of finish were: Yankees, Red Sox, Blue Jays, Orioles, and Devil Rays, the Yankees would be assigned rank #1, the Red Sox rank #2, the Blue Jays rank #3, and so on. If the Blue Jays finished in first place, D would equal +2, which is the result of 3 (the predicted place in the final standings) minus 1 (the actual place in the final standings). Some D scores will be positive (when teams do better than predicted), and some will be negative (when teams do worse than predicted). D will equal zero if the team’s place in the final standings is exactly as predicted, no matter where in the standings the team falls. Each D score is squared (to avoid the problem of working with positive and negative numbers), and the sum of these squared D scores is multiplied by 6 (the mathematical reasons for this are complex).
This result is divided by the mathematical product of the number of ranked teams (n) and the total of the number of ranked teams squared (n2) minus 1 (again, the mathematical reasons for this are complicated and can be read in any traditional statistics textbook). This number is then subtracted from 1, and the result is the Spearman’s rho coefficient, which ranges from + 1.0 (a perfect direct correlation) to -1.0 (a perfect inverse correlation).
For an overview of Spearman’s rho, see R P. Runyon and A. Haber, Fundamentals of Behavioral Statistics, 2nd ed. (Reading, MA: Addison-Wesley, 1971), pp. 102-104.
FREDERIC REAMER, Ph.D., is a professor in the graduate program, School of Social Work, Rhode Island College. His research and teaching address issues related to criminal justice, professional ethics, and public policy. His most recent book is Criminal Lessons: Case Studies and Commentary on Crime and Justice (Columbia University Press).
Notes
1. The American and National League scores were calculated by adding the three Spearman’s rho coefficients for each league (one coefficient for each division) and dividing by 3 (the largest possible total if the preseason forecasts match the final standings).
2. The results produced by this statistical procedure are different from the results produced by ESPN.com’s analysis, which was based only on how far each individual team’s actual finish was from the predicted finish (as reported in the ESPN.com column, each place missed in the final standings was worth one point). The ESPN.com approach does not take into consideration the overall pattern among the ranked scores when the two sets of ranks are compared. The advantage of my approach is that it takes into consideration the overall pattern of ranks and compares the total preseason forecast with the total post-season results.